

vzphotos/iStock Editorial via Getty Images
Micron (NASDAQ:MU), a major producer of memory chips, reports Q1 FY 2023 results after market close on December 21, 2022. The company is the 3rd-largest producer of DRAM chips, globally, and 4th-largest producers of NAND chips. The memory chip market is cyclical, and is currently in a global downswing, with a substantial decrease in revenues this year. As the outlook has weakened, the share price has fallen MU has had a total return of -36.5% over the past 12 months, as compared to -29.2% for the iShares Semiconductor ETF (SOXX) and -16.2% for the S&P 500 (SPY). As recently as mid February, MU was trading at $96 a share, as compared to the most recent closing price of $52.07.
Seeking Alpha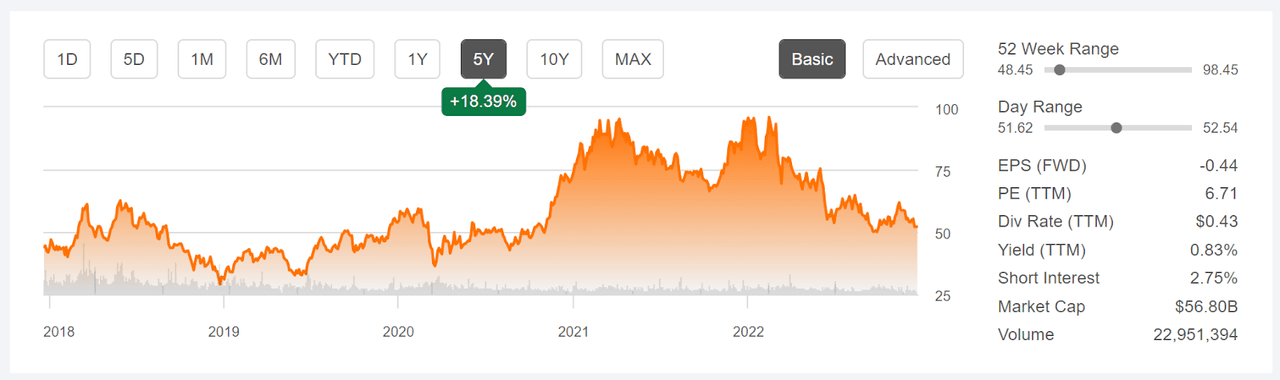
5-Year price history and basic statistics for MU (Source: Seeking Alpha)
The consensus outlook for MU earnings reflect projections for falling demand in the coming year, and quarterly EPS is expected to be very low over the next year. The earnings outlook has gotten weaker in recent months. Back in August, the consensus outlook was for Q1-Q4 of FY 2023 to have EPS ranging from a low of +$0.75 per share (Q2) to a high of +$1.37 (Q4). Today, the consensus estimate for Q1 through Q4 is to have EPS at or below zero.
ETrade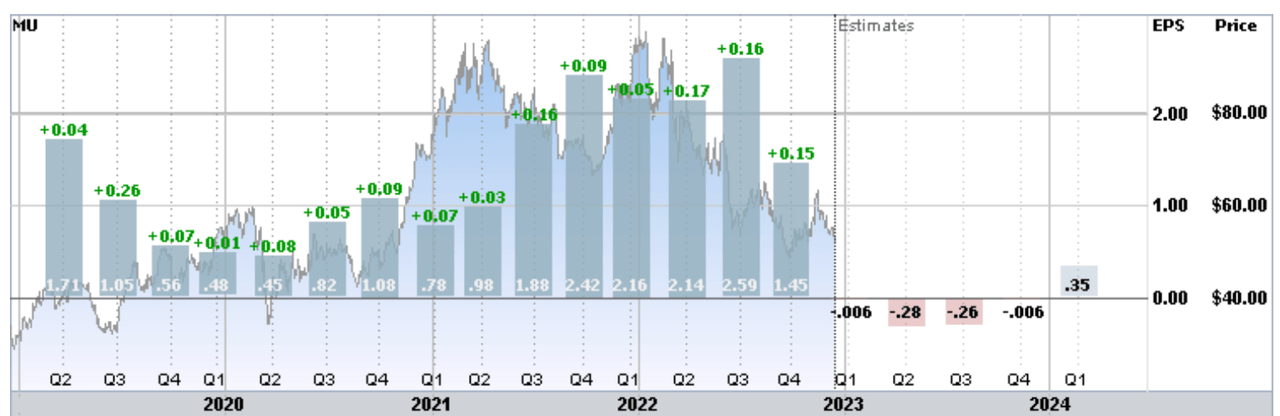
Trailing (4 years) and estimated future quarterly EPS for MU. Green values are amounts by which EPS beat the consensus expected value (Source: ETrade)
I last wrote about MU on August 22, 2022, at which time I maintained a hold rating on the shares. At that time, MU had fallen about 35% for the YTD. The Wall Street consensus rating on MU was bullish and the consensus 12-month price target was about 23% above the share price at that time. One red flag from the Wall Street consensus was the high level of spread among the individual analyst price targets, indicating that there was little agreement. The consensus price target is not a good predictor of future performance when this dispersion is high. As a rule of thumb, I strongly discount the consensus price target when the ratio of the largest and smallest price targets is at or above 2. This ratio was slightly above 2 in both ETrade’s and Seeking Alpha’s versions of the consensus. The market-implied outlook, a probabilistic price forecast that represents the consensus view from the options market, was also a source of concern. The market-implied outlook was neutral to January of 2023, shifting to moderately bearish from now to the middle of 2023.
Seeking Alpha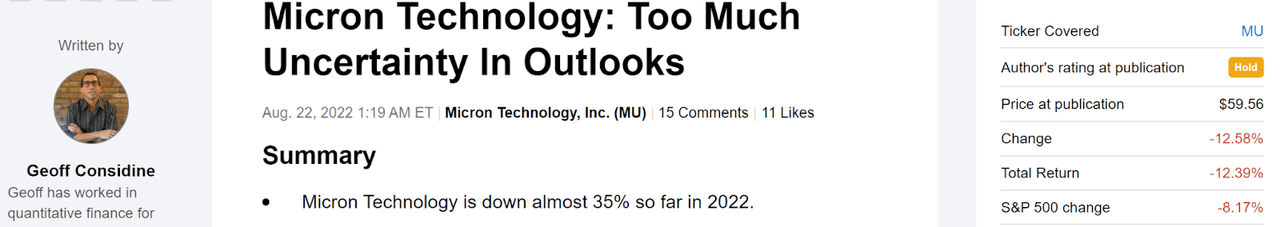
Previous analysis of MU and subsequent performance vs. the S&P 500 (Source: Seeking Alpha)
For readers who are unfamiliar with the market-implied outlook, a brief explanation is needed. The price of an option on a stock is largely determined by the market’s consensus estimate of the probability that the stock price will rise above (call option) or fall below (put option) a specific level (the option strike price) between now and when the option expires. By analyzing the prices of call and put options at a range of strike prices, all with the same expiration date, it is possible to calculate a probabilistic price forecast that reconciles the options prices. This is the market-implied outlook. For a deeper explanation and background, I recommend this monograph published by the CFA Institute.
As we approach the Q1 earnings report, I have calculated updated market-implied outlooks for MU and compared these with the current Wall Street consensus outlooks in revisiting my rating.
Wall Street Consensus Outlook for MU
ETrade calculates the Wall Street consensus outlook for MU by aggregating the views of 22 ranked analysts who have published ratings and price targets over the last 3 months. The consensus rating continues to be a buy, as it has been for all of the past year, and the consensus 12-month price target is 23.2% above the current share price. There is a large dispersion among the individual price targets, however, which reduces confidence in the predictive value of the consensus.
ETrade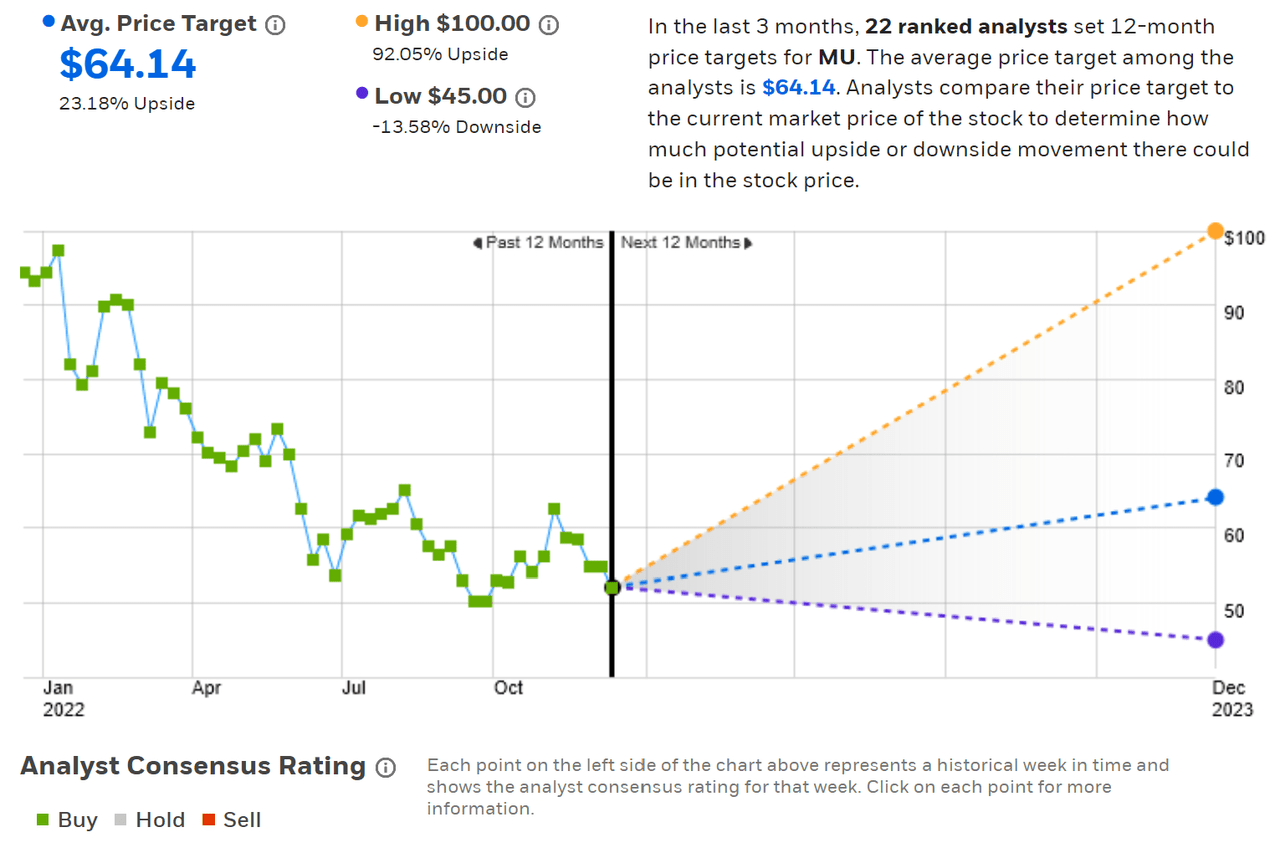
Wall Street analyst consensus rating and 12-month price target for MU (Source: ETrade)
Seeking Alpha’s version of the Wall Street consensus outlook is calculated using ratings and price targets from 37 analysts who have published opinions over the past 90 days. The consensus rating continues to be a buy (and it was a strong buy around the middle of 2022) and the consensus 12-month price target is 27.4% above the current share price. Similar to the ETrade results, there is a high dispersion in the individual price targets.
Seeking Alpha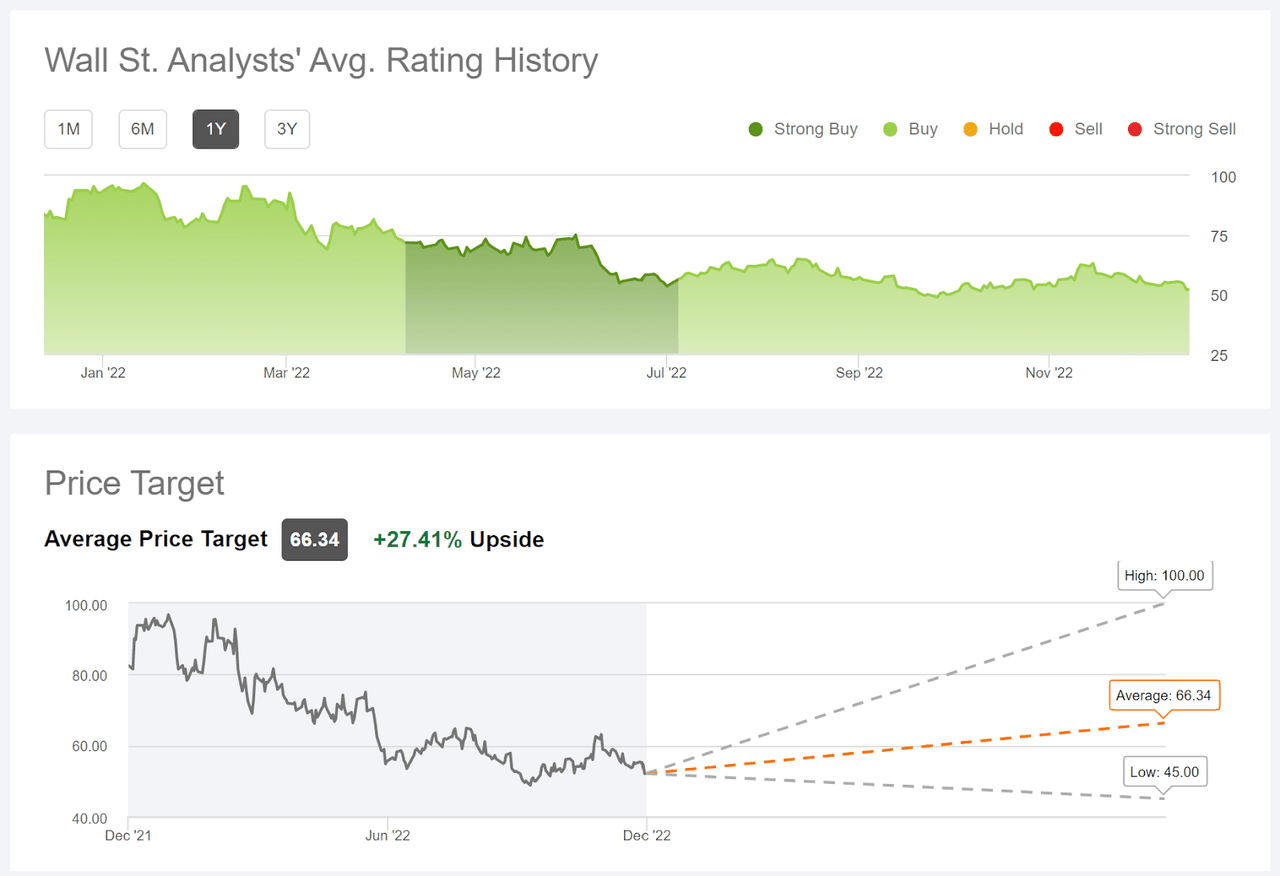
Wall Street analyst consensus rating and 12-month price target for MU (Source: Seeking Alpha)
One interesting observation from these charts is that, despite the fact that memory companies are in a period of falling revenue and earnings, the analyst consensus ratings remain steadfastly bullish. The consensus rating on MU has been a buy (or a strong buy) for all of the past year. The ratio of the highest and lowest individual analyst price targets is above 2 in both the ETrade and the Seeking Alpha results, such that the predictive value of the consensus 12-month price target is questionable.
Market-Implied Outlook for MU
I have calculated the market-implied outlook for MU for the 5.9-month period from now until June 16, 2023 and for the 13-month period from now until January 19, 2024, using the prices of call and put options that expire on these dates. I selected these specific expiration dates to provide a view to the middle of 2023 and through the entire year.
The standard presentation of the market-implied outlook is a probability distribution of price return, with probability on the vertical axis and return on the horizontal.
Geoff Considine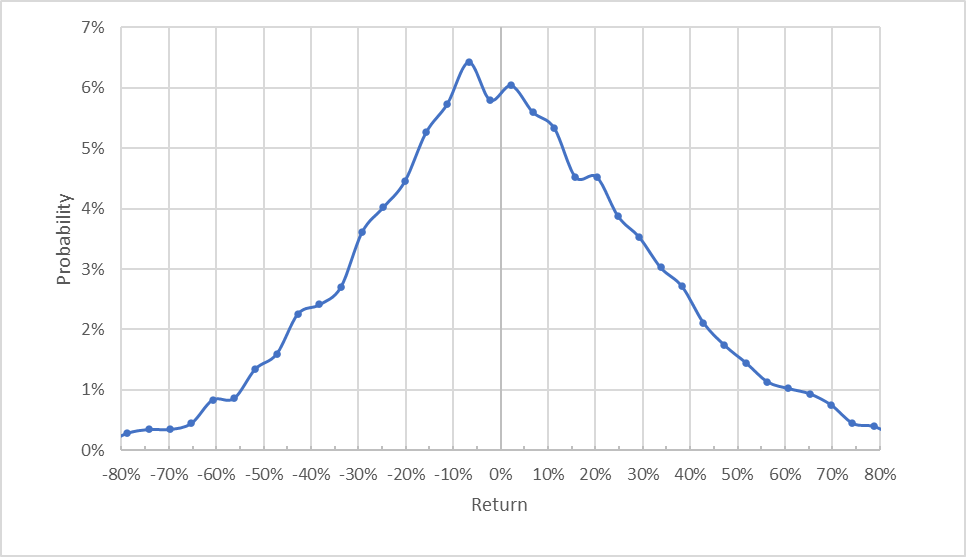
Market-implied price return probabilities for MU for the 5.9-month period from now until June 16, 2023 (Source: Author’s calculations using options quotes from ETrade)
The market-implied outlook to the middle of 2023 is generally symmetric, with comparable probabilities of positive and negative returns of the same size. Compare, for example, the probability of having a return of +20% to the probability of a -20% return. The peak in probabilities is slightly tilted to favor negative returns, however. The maximum probability corresponds to a return of -6.8%. The expected volatility calculated from this distribution is 47% (annualized), which is quite high for a large cap stock. For comparison, ETrade calculates a 46% implied volatility for the options expiring on June 16, 2023.
To make it easier to compare the relative probabilities of positive and negative returns, I rotate the negative return side of the distribution about the vertical axis (see chart below).
Geoff Considine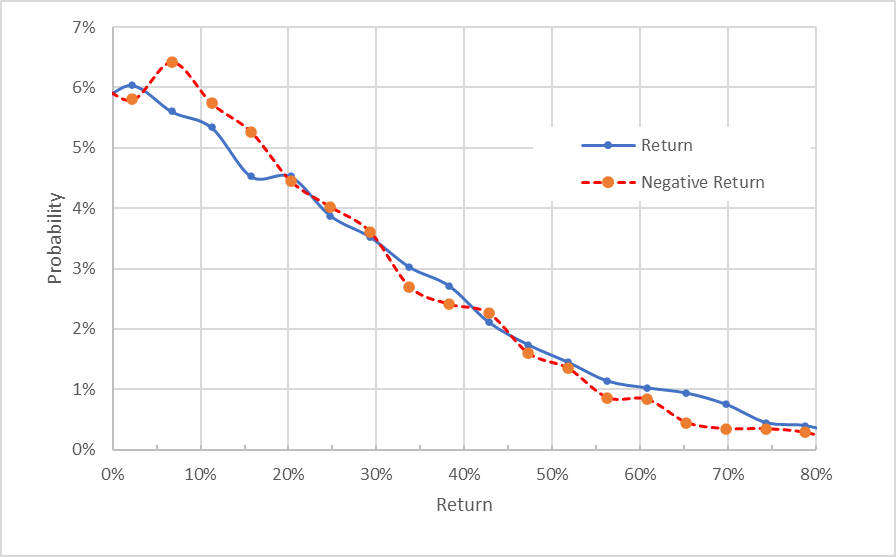
Market-implied price return probabilities for MU for the 5.9-month period from now until June 16, 2023. The negative return side of the distribution has been rotated about the vertical axis (Source: Author’s calculations using options quotes from ETrade)
This view confirms that, aside from having slightly elevated probabilities of negative returns for smaller-magnitude price swings, the probabilities of positive and negative returns match closely (the dashed red line is above the solid blue line over the left ⅕ of the chart above, but the lines are almost on top of one another outside of this range). There is, arguably, a slight elevation in the probabilities of positive outcomes that are very large (the solid blue line is slightly above the dashed red line over the right ⅓ of the chart above), but these outcomes are expected to occur at very low overall probabilities.
Theory indicates that the market-implied outlook is expected to have a negative bias because investors, in aggregate, are risk averse and thus tend to pay more than fair value for downside protection. There is no way to measure the magnitude of this bias, or whether it is even present, however. Considering the higher probabilities of small-magnitude (but high-probability) negative return vs. positive return, the expectation of a negative bias suggests that the best interpretation of this outlook is neutral.
The 13.1-month outlook is distinctly bearish, with notably higher probabilities for negative returns across a wide range of the most-probable outcomes (the dashed red line is well above the dashed red line over the left ½ of the chart below). The maximum probability corresponds to a price return of -13% over this period. There are, however, higher probabilities of very large gains relative to those for declines of similar size (the solid blue line is consistently above the dashed red line over the right ⅓ of the chart below). Given MU’s depressed share price, this is not surprising. The expected volatility calculated from this outlook is 46% (annualized).
Geoff Considine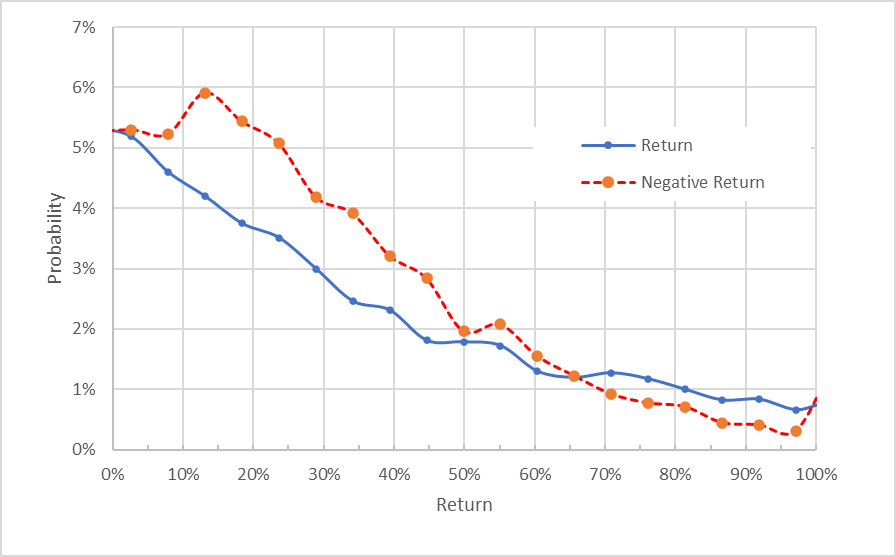
Market-implied price return probabilities for MU for the 13-month period from now until January 19, 2024. The negative return side of the distribution has been rotated about the vertical axis (Source: Author’s calculations using options quotes from ETrade)
MU’s market-implied outlook is neutral to the middle of 2023, but moderately bearish for the full year, with expected volatility of 46%-47% over this period. These outlooks are very similar to the results that I got back in August.
Summary
Coming up on MU’s Q1 FY 2023 earnings report, the outlook for MU is muted. The DRAM and NAND industry is in a declining swing. The consensus outlook for MU’s earnings has fallen in recent months. The Wall Street consensus rating on MU continues to be a buy, although there is a large spread in the price targets from individual analysts, reducing confidence in the predictive value of the consensus. The consensus price target implies a 26% total return over the next year (averaging the ETrade and Seeking Alpha consensus price targets and adding the dividend). As a rule of thumb for a buy rating, I want to see an expected total return that is at least ½ the expected volatility (46% in this case). Taking the analyst consensus price target at face value, MU exceeds this threshold. The issue, of course, is that we have little faith in the consensus because (1) there is a high spread in the individual price targets, and (2) the analysts have tended to be too optimistic about MU. The market-implied outlook for MU is neutral to the middle of 2023 and moderately bearish for the full year. I am maintaining my hold rating on MU.
Be the first to comment