

vzphotos
Micron Technology (NASDAQ:MU), a major memory and storage chip manufacturer, has returned -34.8% for the year to date, as compared to -26.5% for the semiconductor industry (as defined by Morningstar) and -24.7% for the iShares Semiconductor ETF (SOXX). MU has also underperformed the industry over the past 1-, 3-, and 5-year periods. Intriguingly, the Wall Street consensus rating on MU has either a buy or a strong buy for all of the past 3 years, a period over which MU has underperformed the semiconductor industry / SOXX by 16% per year.
Seeking Alpha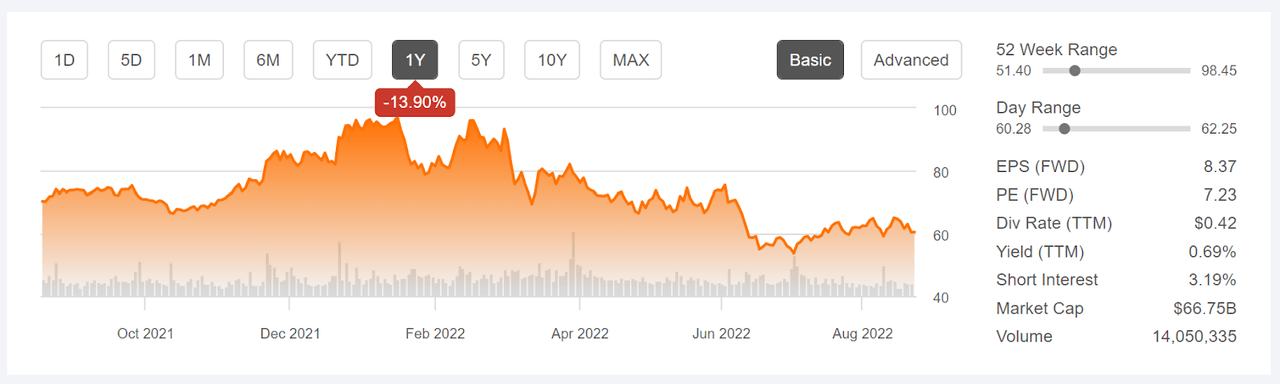
12-Month price history and basic statistics for MU (Source: Seeking Alpha)
MU’s current P/E is low, as compared to peers, the 2nd-lowest among the SOXX top 10 holdings, indicating that the market outlook is for slow growth relative to the industry. The consensus estimated for EPS growth over the next 3-5 years is 7.3% per year.
ETrade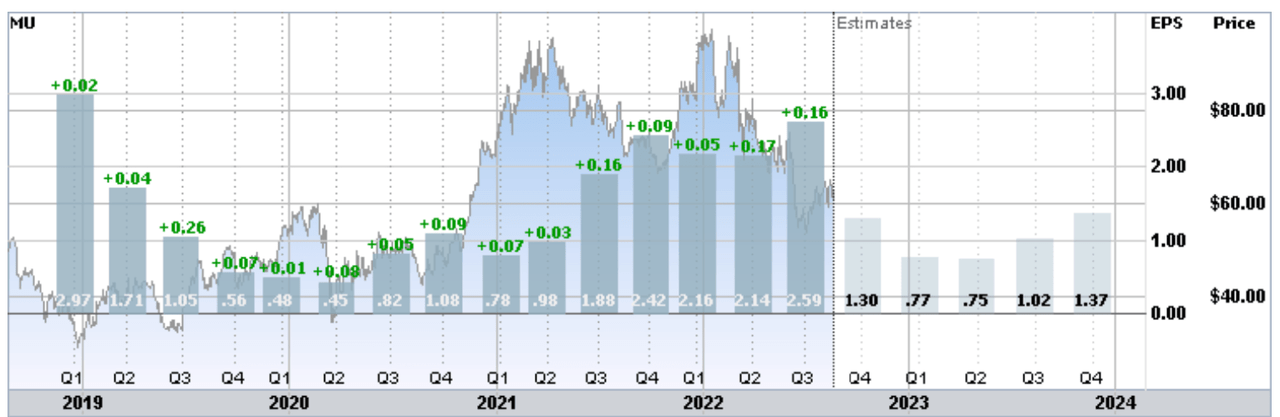
Historical (4 years) and estimated future quarterly EPS for MU. Green values are amounts by which EPS exceeded expectations (Source: ETrade)
MU’s EPS was declining rapidly heading into COVID but has subsequently bounced back and has grown steadily since mid-2020. Earnings are projected to fall substantially in 2023 and into 2024, consistent with the industry cycle for DRAM and NAND chips (see page 3 in the linked presentation).
Morgan Stanley boldly, albeit somewhat prematurely, called the top for the memory market back in August of 2021, with MU trading at around $70. The shares subsequently rose to close at a 12-month high of $97.36 on January 14th but have since declined 38% to reach the most-recent closing prices of $60.51.
I last analyzed MU on October 26, 2021, almost 10 months ago, at which time I maintained a neutral rating on the stock. My rating was driven by conflicting information. Then, as now, the consensus rating from the Wall Street analysts was bullish. The Wall Street consensus 12-month price target was 35% above the share price at that time. There was, however, a large spread among the individual price targets, which reduces confidence in the meaningfulness of the consensus as a predictor. The forward P/E was a modest 7.6. The consensus outlook implied by the prices of call and put options on MU (the market-implied outlook) was neutral to the start of 2022 and bearing to mid-2022. With the bullish Wall Street consensus, with little agreement between analysts, along with the bearish market-implied outlook to the middle of 2022, I compromised by sticking with my neutral rating.
Seeking Alpha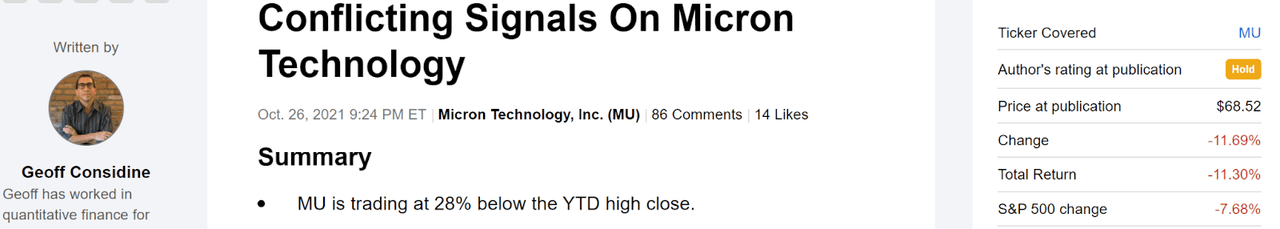
Previous analysis of MU and subsequent performance vs. the S&P 500 (Source: Seeking Alpha)
For readers who are unfamiliar with the market-implied outlook, a brief explanation is needed. The price of an option on a stock is largely determined by the market’s consensus estimate of the probability that the stock price will rise above (call option) or fall below (put option) a specific level (the option strike price) between now and when the option expires. By analyzing the prices of call and put options at a range of strike prices, all with the same expiration date, it is possible to calculate a probabilistic price forecast that reconciles the options prices. This is the market-implied outlook. For a deeper explanation and background, I recommend this monograph published by the CFA Institute.
I have calculated updated market-implied outlooks for MU and I have compared these with the current Wall Street consensus outlook in revisiting my rating on MU.
Wall Street Consensus Outlook for MU
ETrade calculates the Wall Street consensus outlook for MU using price targets and ratings from 24 ranked analysts who have published their views over the past 3 months. The consensus rating is bullish / buy, and the consensus 12-month price target is 21.6% above the current share price. Notably, the consensus 12-month price target is more than $20 below the value from my last analysis. There is also a high level of dispersion among the individual price targets, as was the case back in October. As a rule of thumb, I strongly discount the consensus as a predictor when the highest price target is more than twice the lowest price target. MU has a ratio of 2.2.
ETrade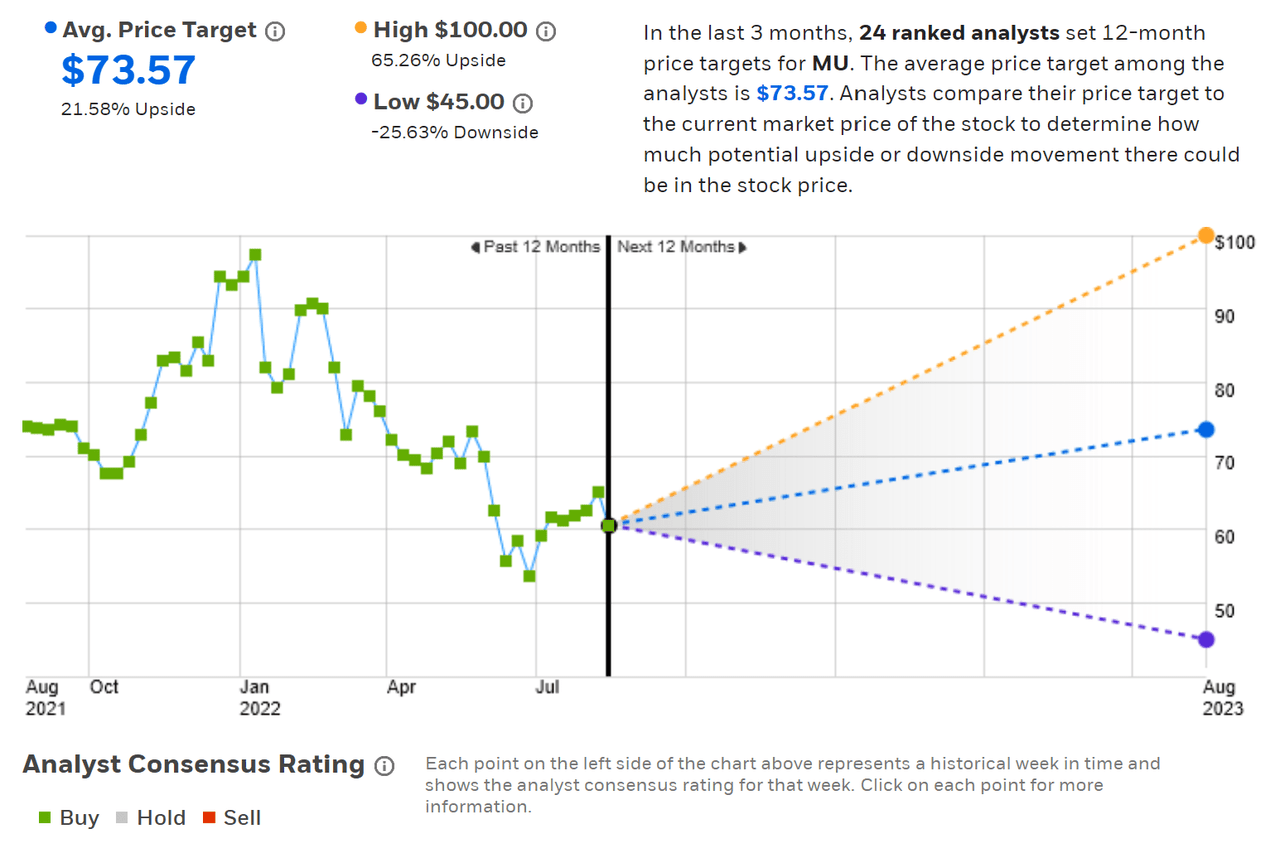
Wall Street analyst consensus rating and 12-month price target for MU (Source: ETrade)
Seeking Alpha’s version of the Wall Street consensus outlook is calculated using price targets and ratings from 35 analysts who have published views over the past 90 days. The consensus rating is bullish / buy, and it has been either a buy or a strong buy for all of the past 3 years. The consensus 12-month price target is 25.3% above the current share price. The highest and lowest individual price targets are the same as in ETrade’s smaller sample, so the ratio of the highest and lowest price targets is 2.2. Back in October of 2021, Seeking Alpha’s calculation of the 12-month consensus price target was $96.57.
Seeking Alpha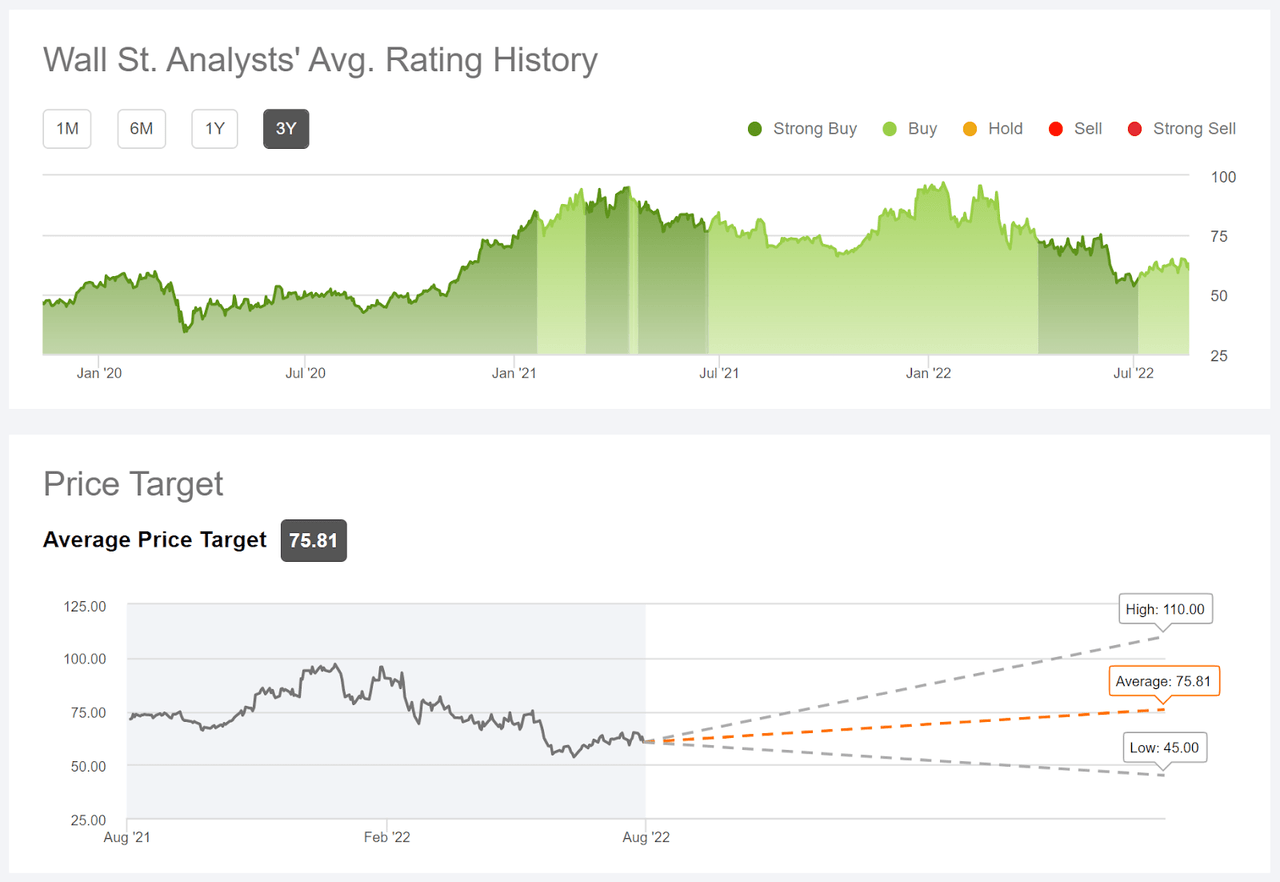
Wall Street analyst consensus rating and 12-month price target for MU (Source: Seeking Alpha)
The ETrade and Seeking Alpha versions of the Wall Street consensus outlook continue to assign a buy / bullish rating on MU and the average of the two consensus price targets is 23.4% above the current share price. There are two reasons to discount this bullish view, however. First, the Wall Street consensus has been continuously bullish over the past 3 years, a period over which MU has substantially underperformed its industry. Second, the large spread in the individual price targets makes the consensus value questionable. In fact, when there is a large dispersion among the individual price targets, one study found that there is a negative correlation between the return implied by the consensus and the subsequent realized return. In other words, a consensus price target that is substantially higher than the current share price may actually be a bearish indicator when there is a large spread in the price targets.
Market-Implied Outlook for MU
I have calculated the market-implied outlook for MU for the 5-month period from now until January 20, 2023 and for the 9.8-month period from now until June 16, 2023, using the prices of call and put options that expire on each of these dates. I selected these two specific expiration dates to provide a view through the end of 2022 and to the middle of 2023. In addition, the options that expire in January and June tend to have high open interest and trading volume, adding confidence in the representativeness of the consensus.
The standard presentation of the market-implied outlook is a probability distribution of price return, with probability on the vertical axis and return on the horizontal.
Geoff Considine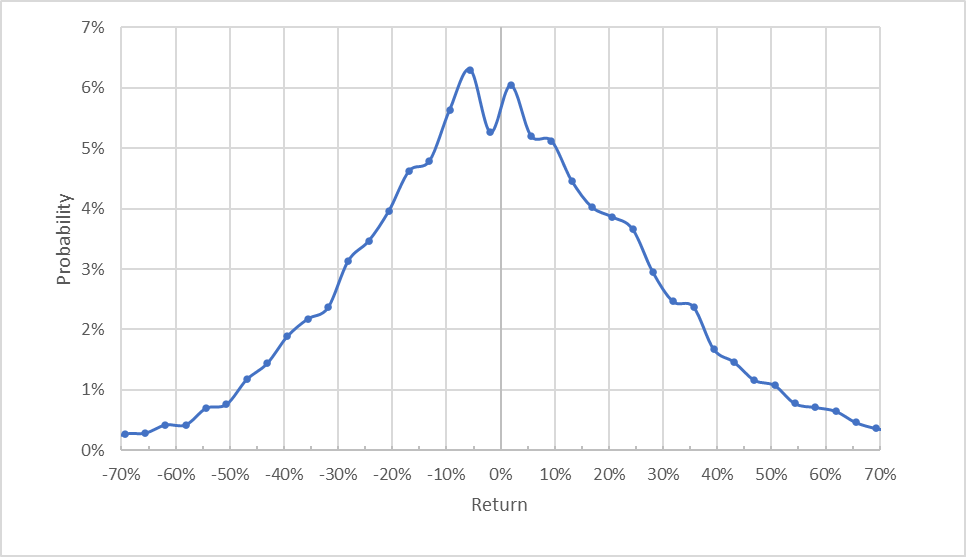
Market-implied price return probabilities for MU for the 5-month period from now until January 20, 2023 (Source: Author’s calculations using options quotes from ETrade)
The probability distribution is quite symmetric, with comparable probabilities of positive and negative outcomes. The expected volatility calculated from this outlook is 45.5% (annualized), which is somewhat higher than expected volatility calculated in my October post, 36.6%.
To make it easier to compare the relative probabilities of positive and negative returns, I rotate the negative return side of the distribution about the vertical axis (see chart below).
Geoff Considine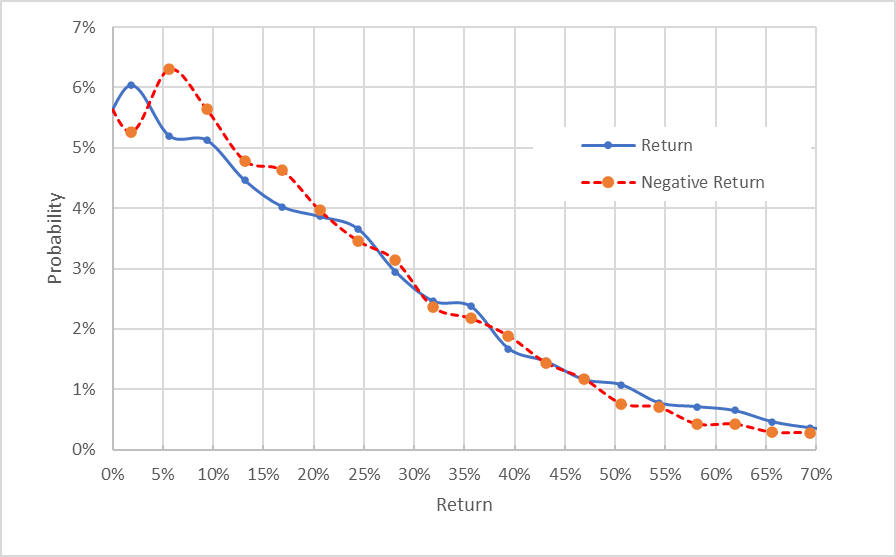
Market-implied price return probabilities for MU for the 5-month period from now until January 20, 2023. The negative return side of the distribution has been rotated about the vertical axis (Source: Author’s calculations using options quotes from ETrade)
This view shows just how closely the probabilities of positive and negative returns match up (the solid blue line is very close to the dashed red line over most of the chart above). There is, however, a range of the most-probable returns for which the probabilities of negative returns are somewhat elevated (where the red dashed line is above the solid blue line over much of the left third of the chart above). This tilt to favor negative returns is slightly bearish, although there is no tilt to favor either positive or negative returns for large-magnitude outcomes (the right ⅔ of the chart).
Theory indicates that the market-implied outlook is expected to have a negative bias because investors, in aggregate, are risk averse and thus tend to pay more than fair value for downside protection. There is no way to measure the magnitude of this bias, or whether it is even present, however. Considering this potential bias, I interpret the market-implied outlook for the next 5 months to be neutral, perhaps with a slightly bullish tilt.
Looking out over the 9.8-month period from now until June 16, 2023, the market-implied outlook shifts to a more bearish orientation. There is a marked elevation in the probabilities of negative returns across a wide range of the most-probable outcomes (the dashed red line is consistently above the solid blue line over the left ½ of the chart below). The maximum probability corresponds to a price return of -13% over this period. I interpret this outlook to be moderately bearish. The expected volatility over this period is 50.0% (annualized).
Geoff Considine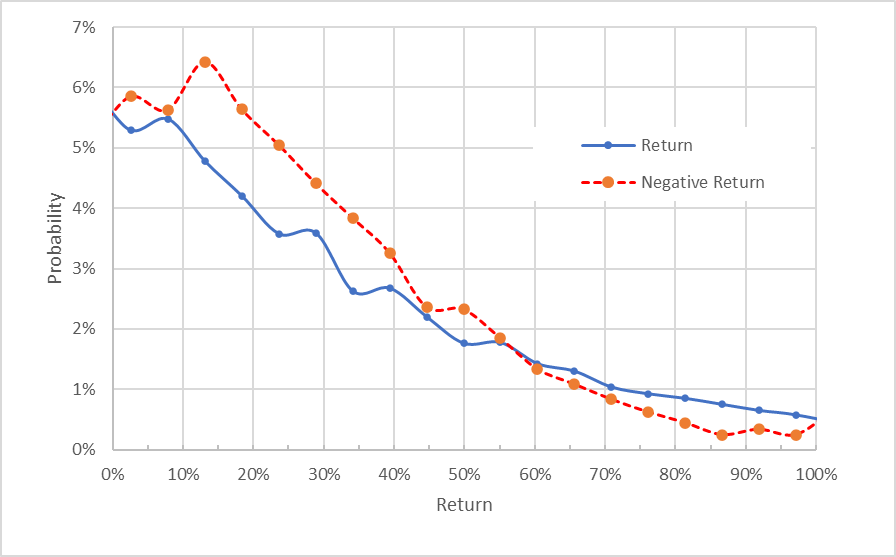
Market-implied price return probabilities for MU for the 9.8-month period from now until June 16, 2023. The negative return side of the distribution has been rotated about the vertical axis (Source: Author’s calculations using options quotes from ETrade)
The current market-implied outlooks for MU are neutral, with perhaps a slight bullish tilt, for the next 5 months but moderately bearish to the middle of 2023. The expected volatility is quite high, shifting from 45% (annualized) to 50% by the middle of next year. These two outlooks are qualitatively quite similar to the 2.8- and 7.7-month outlooks from my analysis in October.
Summary
Timing the cycle in memory chip manufacturers is tough. Morgan Stanley was a bit early when they predicted the downswing last August. When I analyzed MU in October, the prevailing view among Wall Street analysts was bullish, with substantial gains implied from the consensus price target. By contrast, the options market had a bearish view (the market-implied outlook) to the middle of 2022. While MU’s recent earnings have been quite high, beating expectations, the concern is that earnings will drop substantially as part of the broader market cycle. The current Wall Street consensus rating is a buy, as it has been for years, but the consensus 12-month price target has fallen considerably and there is a high level of dispersion among the individual analyst price targets. The consensus 12-month price target is 23.4% above the current share price, implying a total return of 24.1% over the next year (including the dividend). As a rule of thumb for a buy rating, I want to see an expected total return that is at least ½ the expected volatility (50% out to the middle of next year). Even taking the consensus price target at face value, MU falls just below this threshold. Because of the large spread in analyst opinions, however, I don’t have confidence in the consensus as a predictor. The market-implied outlook is neutral with a slight bullish tilt to January of 2023, but the view is moderately bearish out to the middle of 2023. Considering the bullish, albeit low confidence, Wall Street consensus outlook and the bearish market-implied outlook to the middle of 2023, I am maintaining my neutral rating on MU, although the near-term market-implied outlook suggests the potential for some near-term gains.
Be the first to comment