

ra2studio/iStock via Getty Images
Investment Thesis
Micron Technology, Inc. (NASDAQ:MU) has proven to be capable for its FQ3’22 execution, given the improving financial performance thus far. This is attributed to the robust growth in its data center, auto, and industrial segments. Nonetheless, given the obvious softening demand for the PC and smartphone segments, as previously reported by analysts covering Intel (INTC), Qualcomm (QCOM), and AMD (AMD), we applaud MU’s quick response to its supply chain reduction moving forward. Thereby, highlighting the company’s highly competent management team in preserving its margins and profitability ahead. Moving forward, given the drastic moderation in its revenues due to the slowing demand, we expect the MU stock to continue underperforming in the intermediate term.
In contrast, those looking for a quick lift may be happy to see the MU stock performing well, due to the impending passing of the Chips for America Act. We expect to see a trickling down effect over the next few years, potentially aiding the industry to improve the US production capacity over time. Nonetheless, since the Chips Act could possibly be only a one-time investment from the US government, it truly remains to be seen if the semiconductors industry as a whole could grow meaningfully for this and the next decade, to compete with China’s existing production prowess.
We shall see, since MU has yet to formally announce the expansion of its US manufacturing as well, unlike INTC and TSMC (TSM). Therefore, speculatively indicating a short-term stock lift, before possibly digested by the rising inflation and potential recession.
Micron Performed Beautifully In FQ3’22, Despite The Gloomy Guidance
S&P Capital IQ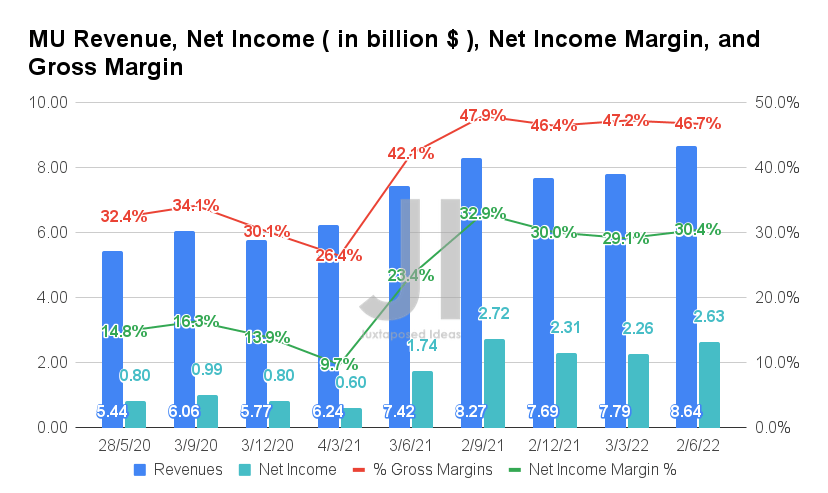
For its latest quarter, MU has performed relatively well, with revenues of $8.64B and gross margins of 46.7%, indicating a YoY increase of 16.4% and 4.6 percentage points, respectively. Its profitability improved as well, with net incomes of $2.63B and net income margins of 30.4%, representing YoY growth of 51.1% and 7 percentage points, respectively.
S&P Capital IQ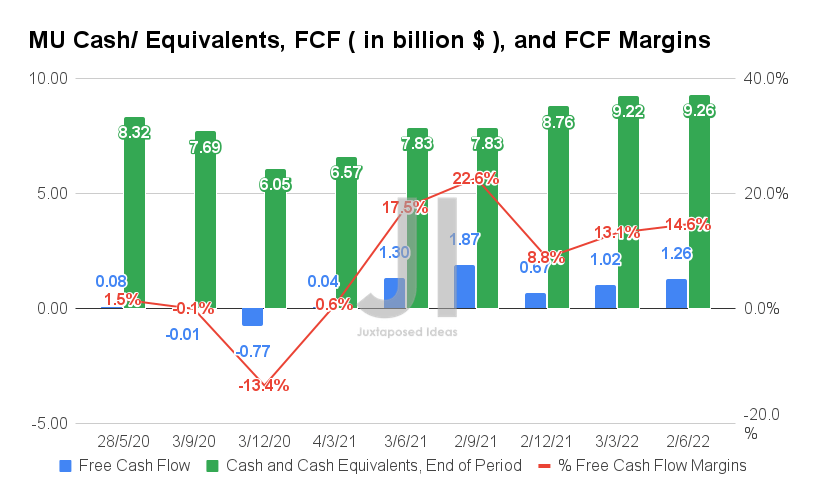
Therefore, it is no wonder that MU reported excellent Free Cash Flow (FCF) generation in FQ3’22 as well, with an FCF of $1.26B and an FCF margin of 14.6%. Thereby, contributing to the company’s growing cash and equivalents on its balance sheet to $9.26B at the same time. Exemplary execution, despite the ongoing supply chain issues and rising inflation.
S&P Capital IQ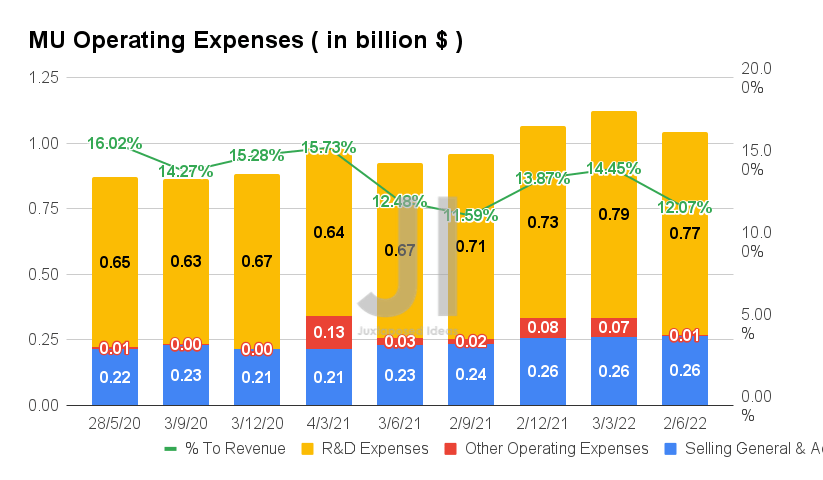
In addition, MU continued to be prudent with its operating expenses, with a total of $1.04B reported in FQ2’22, representing an increase of 11.8% YoY. Nonetheless, as the ratio to its growing revenue remains sequentially lower at 12.07% for FQ3’22, we are not overly concerned at the moment, since MU continues to invest a good $0.77B in its R&D efforts then. In addition to ensuring the company’s competitiveness in the future, the investment would eventually be accretive to the company’s top and bottom lines.
S&P Capital IQ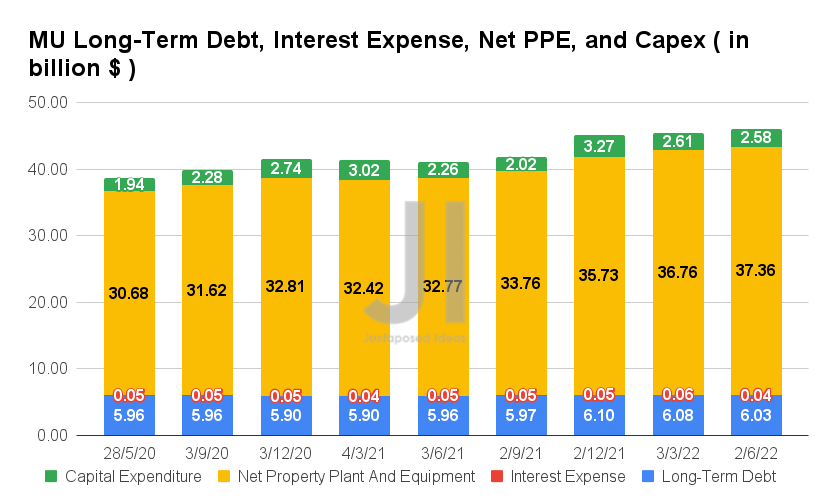
In addition, MU kept its reliance on long-term debts relatively steady with $6.03B reported in FQ3’22, in line with historical levels, despite its growing net PPE assets of $37.36B and capital expenditure of $2.58B at the same time. Therefore, indicating the company’s competent capital management thus far. In addition, with MU management dialing down their expenses for the next five quarters, we still expect to see a decent net income and FCF profitability ahead.
S&P Capital IQ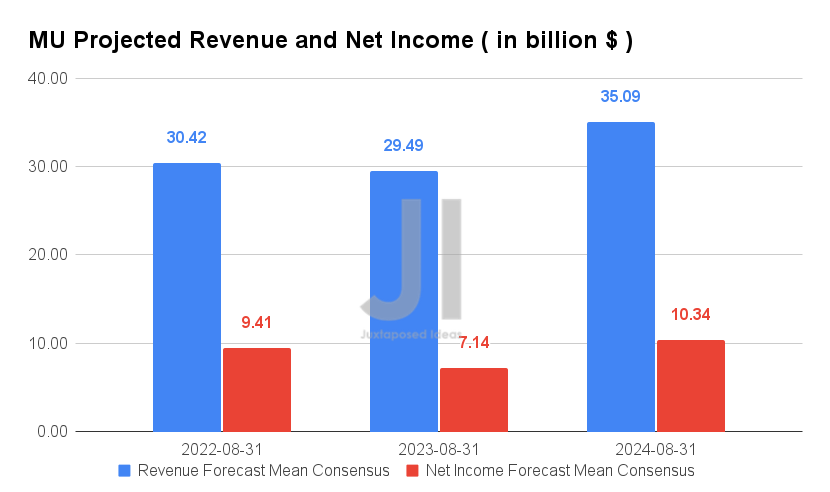
Since our previous analysis, MU’s projected revenue and net income profitability have unfortunately been massively downgraded, which seems rather alarming for its future stock performance. For FY2022, its revenue and net income profitability are estimated to come at $30.42B and $9.41B, indicating a moderation of -9.4% and -13.3% since previous estimates in June 2022, respectively.
In addition, consensus estimates expect FY2023 revenues and net incomes to be $29.49B and $7.14B, instead of the previous June estimates of $39.96B and $14.19B, representing a massive headwind worth $10.47B and $7.05B. It is a wonder that the stock had not tanked, as witnessed by Nvidia (NVDA) with a -15.1% stock decline in the days after its FQ2’23 earnings call.
In the meantime, we encourage you to read our previous article on MU, which would help you better understand its position and market opportunities.
- Micron Stock: Impending Rollercoaster Ride
- Micron Stock: Undervalued With Massive Potential – Here’s Why
So, Is MU Stock A Buy, Sell, or Hold?
MU 5Y EV/Revenue and P/E Valuations
S&P Capital IQ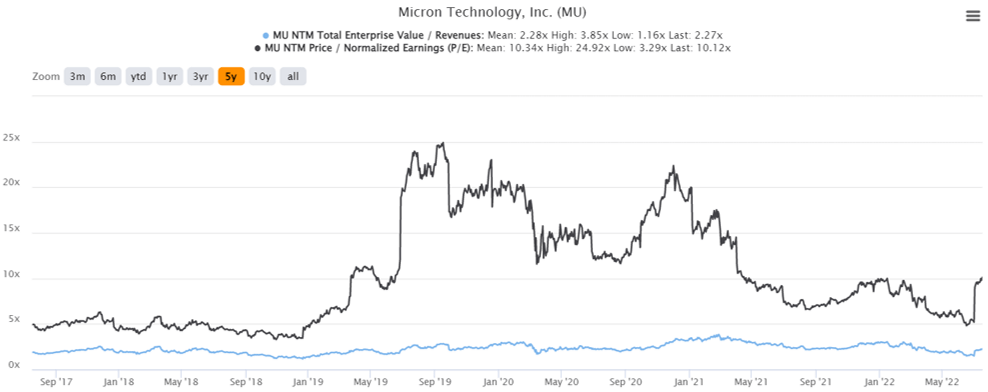
MU is currently trading at an EV/NTM Revenue of 2.27x and NTM P/E of 10.12x, in line with its 5Y mean of 2.28x and 10.34x, respectively. The stock is also trading at $62.40, down 36.6% from its 52-week high of $98.45, though at a premium of 21.4% from its 52-week low of $51.40. Based on the price action since its FQ2’22 earnings call, it could seem that the MU stock is showing signs of recovery, mainly attributed to the Chips for America Act, instead of its fundamental execution and future performance.
MU 5Y Stock Price
Seeking Alpha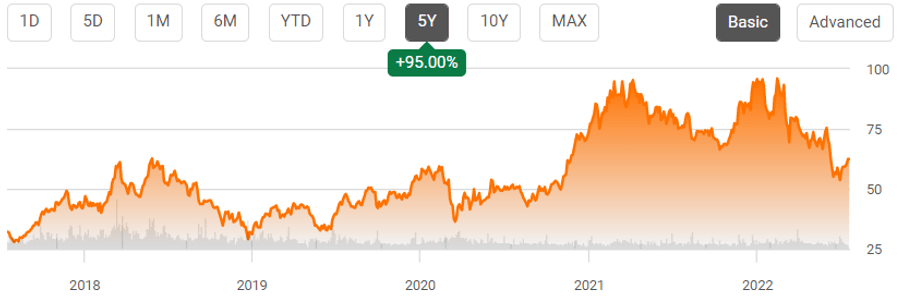
Given the softer guidance for the FQ4’22 and the eventual decline in consensus revenue estimates for FY2023, we are not convinced of the eventual price target of $82.72 and 32.56% upside. In the short term, we may see the stock rally to favorable levels since the Chips Act would be highly beneficial for US-based foundries, such as MU and INTC. Nonetheless, we are uncertain if the rally is sustainable, given the reduced revenue outlook for the next five quarters. It is likely that the gain will be digested shortly and soon re-test MU’s $50s support level over the next few months.
Investors looking to trade may consider entering at current levels, given the relatively attractive risk/ reward ratio over the next few weeks. However, long-term investors looking to add may have to hold on a little longer, before getting in at a comfortable $40s level. We encourage investors to be patient first and let the market run its course for now.
Therefore, we rate MU stock as a Hold.
Be the first to comment