

emptyclouds
Earnings of Metropolitan Bank Holding Corp. (NYSE: NYSE:MCB) will most probably continue to surge in future quarters thanks to moderate margin expansion amid a rising rate environment. Further, impressive loan growth will likely support the bottom line. Overall, I’m expecting Metropolitan Bank to report earnings of $8.12 per share for 2022 and $9.13 per share for 2023. Compared to my last report on the company, I’ve reduced my earnings estimates for both years as I have revised downwards the non-interest income estimates and increased my non-interest expense estimates. Next year’s target price suggests a high upside from the current market price. Therefore, I’m maintaining a buy rating on Metropolitan Bank Holding Corporation.
Margin Expansion to Slow Down Following Cash Normalization
Metropolitan Bank’s net interest margin has surged by a massive 114 basis points in the last two-quarters thanks to the rising rate environment. This growth far exceeds the estimates I gave in my last report on the company. It also far exceeds the results of the management’s interest rate sensitivity model. According to the results of the model given in the earnings presentation, a 200-basis points hike in interest rates can boost the net interest income by 5.06% over twelve months.
Some of the surge in the margin in the last two quarters was attributable to the deployment of excess liquidity into higher-yielding assets. As shown below, Metropolitan Bank’s cash position relative to total assets is back to normal. Therefore, this factor is unlikely to act as a catalyst for the margin in the coming quarters.
SEC Filings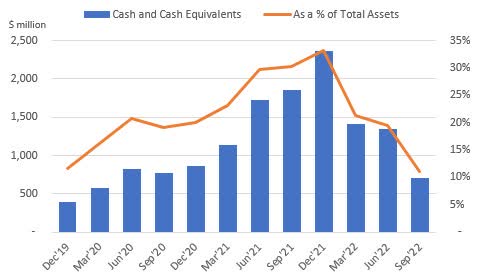
On the other hand, the margin will receive some support from the ongoing up-rate cycle. Metropolitan Bank’s deposit cost is quite sticky as non-interest-bearing demand deposits make up 53% of total deposits, as mentioned in the presentation. Unfortunately, the asset side is also not very rate sensitive. Fixed-rate loans make up 59% of total loans. Further, 79% of floating-rate loans have floors. The weighted average floor rate for these loans is quite high at 4.8%, as mentioned in the earnings presentation.
Considering these factors, I’m expecting the margin to grow by 20 basis points in the last quarter of 2022 and 20 basis points in 2023.
Loan Growth to Remain at a High Level Despite Slowdown
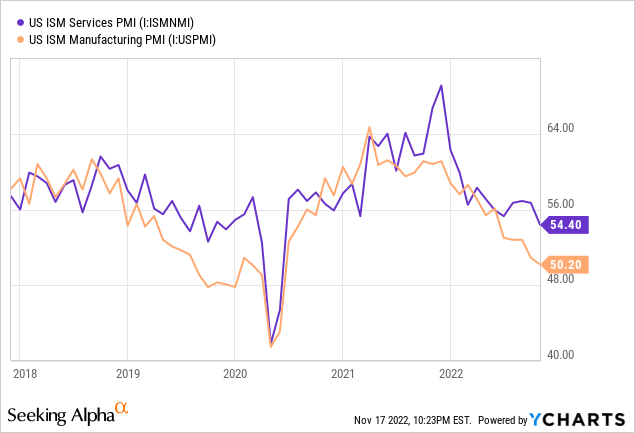
Metropolitan Bank’s loan book continued to grow at a remarkable rate in the third quarter of 2022. The portfolio expanded by 5.5%, leading to 9-month growth of 24%, or 32% annualized. The company focuses on commercial real estate and commercial and industrial loans. Therefore, the purchasing manager’s index (“PMI”) is a good gauge of credit demand. Despite the recent downtrend, PMI indices are still in expansionary territory (i.e. above 50).
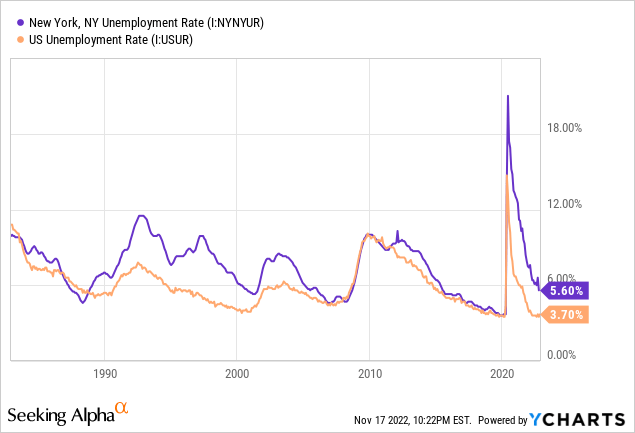
Metropolitan Bank mostly operates in the New York metropolitan area, with limited presence in other regions of the country, including Florida and New Jersey. New York’s unemployment rate is currently higher than the national average. Nevertheless, it is doing quite well from a historical perspective.
Based on the factors given above, I’m expecting loan growth to be below the historical average in 2023 but remain at an impressive double-digit rate. I’m expecting the loan portfolio to grow by 4% in the last quarter of the year, leading to full-year loan growth of 28.7%. For 2023, I’m expecting the loan portfolio to grow by 17.0%.
Meanwhile, deposit growth will likely trail loan growth. Metropolitan Bank has some crypto-related deposits which underwent an outflow of $468 million during the last quarter, as mentioned in the conference call. According to details given in the earnings presentation, digital currency deposits made up around 13% of total deposits at the end of September 2022, which isn’t too high. Therefore, I expect the persistent rout in cryptocurrencies to have only a small impact on Metropolitan Bank’s deposits. (Side note: the company doesn’t have any crypto-related assets. It isn’t involved with lending against digital assets or stable coin issuance.)
The following table shows my balance sheet estimates.
| Financial Position | FY18 | FY19 | FY20 | FY21 | FY22E | FY23E |
| Net Loans | 1,846 | 2,647 | 3,102 | 3,697 | 4,758 | 5,566 |
| Growth of Net Loans | 31.4% | 43.4% | 17.2% | 19.2% | 28.7% | 17.0% |
| Other Earning Assets | 283 | 643 | 1,138 | 3,293 | 1,660 | 1,728 |
| Deposits | 1,661 | 2,791 | 3,830 | 6,436 | 5,903 | 6,644 |
| Borrowings and Sub-Debt | 230 | 232 | 82 | 114 | 99 | 101 |
| Common equity | 265 | 299 | 341 | 557 | 606 | 708 |
| Book Value Per Share ($) | 31.9 | 35.9 | 40.6 | 60.1 | 54.2 | 63.3 |
| Tangible BVPS ($) | 30.7 | 34.7 | 39.4 | 59.0 | 53.3 | 62.5 |
| Source: SEC Filings, Earnings Releases, Author’s Estimates(In USD million unless otherwise specified) | ||||||
Reducing the Earnings Estimates
Metropolitan Bank’s non-interest income fell by more than I anticipated in the third quarter partly due to lower digital currency (crypto) transactions. Given the performance of cryptocurrencies so far this quarter, fees earned will likely be even lower in the fourth quarter. As a result, I’ve decided to revise downwards my non-interest income estimates for both 2022 and 2023.
I’ve also decided to revise upwards my non-interest expense estimates because of persistently high inflation that has beaten my previous expectations. The non-interest expense surged by 18.7% in the third quarter, which far exceeded my previous estimates given in my last report on the company.
Considering the outlook on loans, margin, non-interest income, and non-interest expenses, I’m expecting earnings to grow by 26% this year to $8.12 per share. For 2023, I’m expecting earnings to grow by 13% to $9.13 per share. The following table shows my income statement estimates.
| Income Statement | FY18 | FY19 | FY20 | FY21 | FY22E | FY23E |
| Net interest income | 71 | 98 | 125 | 157 | 231 | 289 |
| Provision for loan losses | 3 | 4 | 9 | 4 | 11 | 14 |
| Non-interest income | 12 | 11 | 17 | 24 | 26 | 24 |
| Non-interest expense | 43 | 60 | 75 | 87 | 115 | 148 |
| Net income – Common Sh. | 25 | 30 | 39 | 60 | 91 | 102 |
| EPS – Diluted ($) | 3.06 | 3.56 | 4.66 | 6.45 | 8.12 | 9.13 |
| Source: SEC Filings, Earnings Releases, Author’s Estimates(In USD million unless otherwise specified) | ||||||
In my last report on Metropolitan Bank, I estimated earnings of $8.56 per share for 2022 and $10.15 per share for 2023. I’ve reduced my earnings estimates for both years as I’ve reduced my non-interest income estimates and raised my non-interest expense estimates.
My estimates are based on certain macroeconomic assumptions that may not come to pass. Therefore, actual earnings can differ materially from my estimates.
High Price Upside Calls for a Buy Rating
I’m using the historical price-to-tangible book (“P/TB”) and price-to-earnings (“P/E”) multiples to value Metropolitan Bank. The stock has traded at an average P/TB ratio of 1.15 in the past, as shown below.
| FY18 | FY19 | FY20 | FY21 | Average | |
| T. Book Value per Share ($) | 30.7 | 34.7 | 39.4 | 59.0 | |
| Average Market Price ($) | 44.3 | 40.0 | 32.6 | 68.9 | |
| Historical P/TB | 1.44x | 1.15x | 0.83x | 1.17x | 1.15x |
| Source: Company Financials, Yahoo Finance, Author’s Estimates | |||||
Multiplying the average P/TB multiple with the forecast tangible book value per share of $62.5 gives a target price of $71.7 for the end of 2023. This price target implies a 4.0% upside from the November 17 closing price. The following table shows the sensitivity of the target price to the P/TB ratio.
| P/TB Multiple | 0.95x | 1.05x | 1.15x | 1.25x | 1.35x |
| TBVPS – Dec 2023 ($) | 62.5 | 62.5 | 62.5 | 62.5 | 62.5 |
| Target Price ($) | 59.2 | 65.4 | 71.7 | 77.9 | 84.2 |
| Market Price ($) | 69.0 | 69.0 | 69.0 | 69.0 | 69.0 |
| Upside/(Downside) | (14.1)% | (5.1)% | 4.0% | 13.0% | 22.1% |
| Source: Author’s Estimates |
The stock has traded at an average P/E ratio of around 10.8x in the past, as shown below.
| FY18 | FY19 | FY20 | FY21 | Average | |
| Earnings per Share ($) | 3.06 | 3.56 | 4.66 | 6.45 | |
| Average Market Price ($) | 44.3 | 40.0 | 32.6 | 68.9 | |
| Historical P/E | 14.5x | 11.2x | 7.0x | 10.7x | 10.8x |
| Source: Company Financials, Yahoo Finance, Author’s Estimates | |||||
Multiplying the average P/E multiple with the forecast earnings per share of $9.13 gives a target price of $99.1 for the end of 2023. This price target implies a 43.7% upside from the November 17 closing price. The following table shows the sensitivity of the target price to the P/E ratio.
| P/E Multiple | 8.8x | 9.8x | 10.8x | 11.8x | 12.8x |
| EPS 2023 ($) | 9.13 | 9.13 | 9.13 | 9.13 | 9.13 |
| Target Price ($) | 80.8 | 89.9 | 99.1 | 108.2 | 117.3 |
| Market Price ($) | 69.0 | 69.0 | 69.0 | 69.0 | 69.0 |
| Upside/(Downside) | 17.2% | 30.5% | 43.7% | 56.9% | 70.2% |
| Source: Author’s Estimates |
Equally weighting the target prices from the two valuation methods gives a combined target price of $85.4, which implies a 23.8% upside from the current market price. Hence, I’m maintaining a buy rating on Metropolitan Bank Holding Corp.
Be the first to comment