B4LLS/iStock via Getty Images
Hanesbrands Inc. (NYSE:HBI) is looking for a way to express its full potential through its main brand – Champion – and repositioning the Innerwear segment towards a younger clientele. Customer-oriented and product simplification are the other keys considered essential for success. The current market environment is particularly challenging for the apparel and consumer discretionary sector and the company is experiencing some significant headwinds.
Among the most impactful, I underline the growth of the inventory such as causing a negative Operating Cash Flow of $395.6M which heavily affects the company’s financial stability, the dividend, and also the operating margins. On the other hand, the operating margin is also suffering due to the increase in raw material and distribution costs, but also due to the need to urgently restock inventories.
The company has also undertaken an operational restructuring plan aimed at cost-cutting necessary to finance the investments necessary for growth. Long-term fundamentals are good with revenue, EBIT, and ROCE able to sustain the company even in difficult times. Good operational flexibility fueled by the direct management of the production factories represents another positive aspect of the company.
Looking for improvements in inventory management and direct cost efficiencies (which, in my opinion, represents the success keys for the required turnaround) I decide to do nothing and wait. My rating is on Hold.
General overview
Hanesbrands Inc. is a manufacturer in two main basic apparel sectors: innerwear and activewear. The company sells its products on several continents: America, Europe, Asia, and Australia. The products are sold through various sales channels ranging from the mass market to the department or specialty store and also through e-commerce. The two main marketed brands are Hanes and Champion.
Hanesbrands produces more than 65% of clothing directly through its factories and this represents a differentiating element compared to many competitors.
In 2021 the Company decided to exit the European Innerwear business as a consequence of a strategic plan. In the same year, Hanesbrands decided also to divest the Sheer Hosiery business in the US and is expected to complete the business sale as soon as possible.
Financial & Highlights
Revenue and Profitability
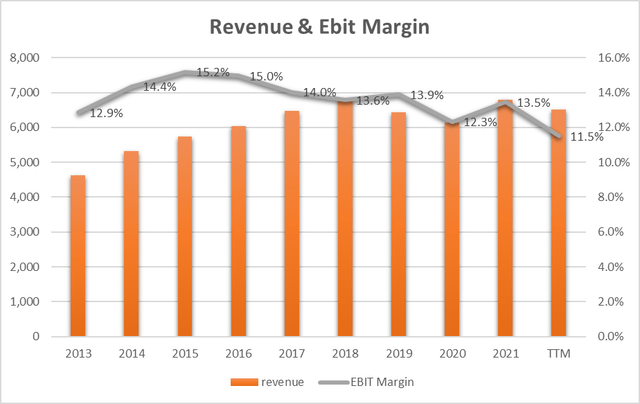
Revenue went from $4.62B (2013) to $6.51B (2022) with annual growth (CAGR) of 3.9% and with a fairly constant growing trend. The EBIT margin is however recording a slightly downward trend in the long term going from 12.9% in 2013 to 11.5% in 2022. We must also note that in 2021 there was a first attempt to reverse the trend which, unfortunately, has stopped this year also due to contingent events. The data is not bad (also in 2022) and photographs a revenue-growing reality with a fair profitability ratio.
The decline of the EBIT margin in 2022 (from 13.5 to 11.5%) mainly occurred in Q3 and is largely due to a higher incidence of direct production costs. The same trend is also expected for Q4 and more specifically as we can hear from the last earnings call:
At the midpoint of our guidance range, we expect fourth quarter sales to decline approximately 19% as compared to last year. We expect gross margin to decline about 400 basis points versus prior year. Our outlook reflects an approximately 400 basis point headwind from commodity and freight inflation as well as an approximate 200 basis point headwind from time-out costs related to our inventory reduction initiative. These headwinds will offset the positive contributions from price increases and cost savings were generating from our Full Potential initiatives.
The management is also confident about a recovery in the gross margin shortly because of…
…lower commodity and freight costs moving through our manufacturing network, and we don’t expect time-out costs to continue longer-term once our inventory is aligned with demand
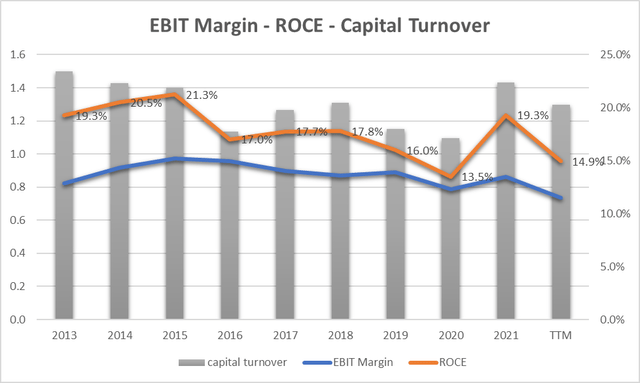
Return on Capital Employed (ROCE – orange line) follows the EBIT (blue line) trend but is higher following a good Capital Turnover ratio (grey bars) which is always greater than 1 (= every $1 employed in the company produces more than $1 in revenue). In particular, this last ratio is a virtuous element that distinguishes a good company’s ability to use capital. The latest ROCE figure of 14.9% (2022) is also good in absolute terms.
Free Cash Flow, Dividend, and CapEx
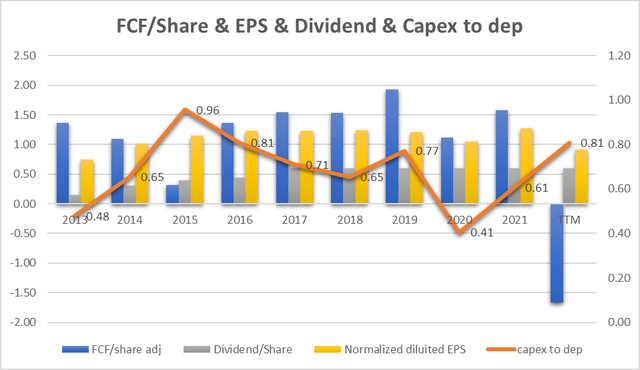
The yellow bars represent the earnings per share and we can see that in the long term the earnings are stable and since 2013 they have achieved an annual growth (CAGR) of 2.3%. Until 2021, earnings were transformed in a virtuous way into free cash flow (blue bars) which follows the trend of earnings very closely.
Only in 2022 did the free cash flow become negative or the earnings were unable to generate cash. And the question that arises is: what could this be due to? The main reason is the growth of inventory.
In fact, during the last two quarters, the condition in which production could not keep up with demand was completely reversed and today demand has become so weak that stocks have accumulated in the retailer warehouses and also in the Hanesbrands warehouses. The problem is so serious and important that it has generated (to date) a negative operating cash flow of $395.6M and this is the first time this has happened in 10 years.
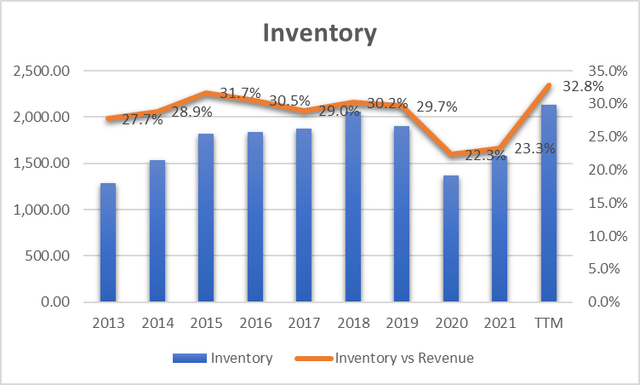
The graph shows the trend of the inventory and the orange line shows the relationship between the revenue. The figure for 2022 (32.8%) has never been so high and if we look at the figure every quarter, unfortunately, the trend is constantly growing. It, therefore, seems that the slowdown in sales has taken company management by surprise, which has not managed to slow down production in time in order not to accumulate so much capital in the warehouse. But what is the company doing?
We continue to reduce our overall SKU count even as we have launched new product and innovation. Since our peak, we have lowered our net SKU count by over 40% and we have 22% fewer SKUs running through our supply chain… We are also building digital on-shelf analytics tools.
As we can understand by listening to the latest earnings call, a large reduction in the stock of goods at an operational level is underway in this last quarter. The management is also very confident that the stock can be sold quickly as it’s made mainly of commodity products with a high turnover on the market. The ultimate goal is to bring the inventory back to a level equal to or lower than that recorded in 2021.
Returning to the previous graph, we can see the trend of the gray bars that represent the dividend. The dividend has always been covered by yellow and blue bars and this is a sign of long-term stability and sustainability. The exception is 2022 where, for reasons discussed in the previous paragraph, it is clear that the dividend is also a risk element as there is a lack of financial sustainability.
Also in the previous graph, the orange line indicates the ratio between CapEx and depreciation. The trend is fragmented but always less than 1. This indicates that the company may not invest enough in maintaining its assets or even in future developments. This can be a further element of risk in the long run.
Valuation
Earnings Power Value Model
Assuming that the cash profit remains constant over the long term, I use the EPV (earnings power value) method to calculate the share price
The method starts with EBIT. The second step is to add depreciation and amortization and then subtract stay-in-business CAPEX.
The result is the Cash Trading Profit
I then subtract the taxes by calculating the amount using the actual tax rate that the company pays.
The result is the After-Tax Cash Trading Profit
At least to calculate the total company enterprise value I divide the After-Tax Cash Profit by the interest Rate I define as fine for this kind of Company (HBI is a high-risk company so I decided to use 15%)
The result is the Total Company Earnings Power Value. Dividing the result by the total number of shares we find the value per single share.
The table below shows the calculation for HBI
| EBIT | 749.60 |
| Dep & amort | 105.00 |
| CAPEX | -84.90 |
| Cash Trading Profit | 769.70 |
| TAX | 15.20% |
| TAX | -116.994 |
| After TAX cash profit | 652.71 |
| Interest Rate | 15% |
| EPV | 4351.371 |
| share in issue | 348.9 |
| EPV per share | 12.5 |
$12.5 represents the share price valuation using the EPV method. If we compare the data with the current market price ($5.9) we see that the current price could be seen as cheap.
EPS Growth Model
Since the company is showing growth in terms of Revenue and EPS, I decided to use the EPS growth parameter over the last 10 years as an estimate of future growth. 2.3% is the growth rate (CAGR) of EPS from 2013 ($0.75) to 2022 ($0.92).
The Formula is (by popular investor Benjamin Graham):
Intrinsic value per share = EPS x (8.5 + 2 g)
Where
EPS = earning per share
g = EPS growth rate = 2.3%
Example of calculation for 2023:
Intrinsic value per share = EPS x (8.5 + 2 g) = 0.94x(8.5+2×2.3) = $12.32
The last intrinsic value of $13.8 for 2028 underlines an annualized return (CAGR) of 15.2% as the current share price is $5.9.
15.2% is the annualized expected return for the investment in HBI. It’s not a bad figure in absolute value and it requires confidence that the EPS growth rate can remain at 2.3% for the next 7 years this represents an element of risk especially if we look at the EBIT margin growth trend.
Peer Comparison
To compare HBI with similar companies in terms of market capitalization in the Top Apparel, Accessories, and Luxury Goods Stocks Industry I have defined the following peers:
- Canada Goose Holdings Inc. (GOOS)
- Kontoor Brands, Inc. (KTB)
- Oxford Industries, Inc. (OXM)
- Carter’s, Inc. (CRI)
- Levi Strauss & Co. (LEVI)
Using Seeking Alpha’s Quant Ratings we have a ‘Sell’ verdict related to the ‘Hold’ rating of the others company.
Analyzing the factor grades we can see how HBI is preferable in terms of Valuation as also defined in the previous paragraph in terms of price share valuation we have seen as the price could be seen as cheap.
The company is the worst in terms of Growth and Profitability and we have seen how growth reversed in 2022 while as far as profitability is concerned, the main issue is linked to the time-out costs related to the need to replenish the warehouse.
The above also carries the worst evaluation in terms of Momentum and EPS Revision. The general picture is highly regressive and it seems that the company has made a big mistake in forecasting and managing inventories. Much more than peers have done. Looking at it also from another point of view, this could be an excellent time (the share price valuation is very advantageous) to buy if you are highly confident that the company can recover 2023 the damages done this year.
Risks
Inventory drags down Operating Cash Flow
We positioned ourselves to return to more normal levels of cash flow next year by taking more aggressive actions this year to reduce inventory. And we’re realizing cost savings from our Full Potential initiatives, which should drive higher EBITDA as the inflation headwinds ease.
This is what we can hear from the latest earnings call. If this scenario does not materialize in the next quarters, the company could enter an involutionary cycle capable of dragging down revenues, margins, and the capital available for future growth.
Gross and EBIT Margin
Margins compressed mainly due to the increase in the costs of raw materials, and distribution and also due to the need to urgently reduce the level of inventories. On the other hand, the company is pursuing cost-saving initiatives and efficiency improvements in operations to recover this loss of profitability. If these initiatives do not produce the desired effects in 2023, margins will likely remain contracted and this represents a high risk in the long run.
Conclusion
Hanesbrands identifies globally recognized brands. Revenue has grown (albeit slowly) over the past 10 years. EPS also grew and until 2021 they were transformed into cash flow that managed to ensure a good distribution of dividends. CapEx seems underestimated and could generate the need for future additional investments. But the most serious and critical issue is, in 2022, that relating to the large increase in inventory caused by declining demand. This factor has led to a largely negative cash flow (an event that has never been seen in the last 10 years). The share price evaluation is very interesting but carries within it a large risk of business continuity. In my opinion, the company has good fundamentals and deserves a period to reverse course. My rating is Hold.




Be the first to comment