

reddroomstudios/iStock via Getty Images
Introduction
On May 13, 2022, the Vancouver, British Columbia-based Canadian Metalla Royalty & Streaming Ltd. (NYSE: NYSE:MTA) announced its operating and financial results for the third quarter of 2022.
Note: This article is an update of my article published on July 21, 2022. I have followed MTA on Seeking Alpha since December 2020.
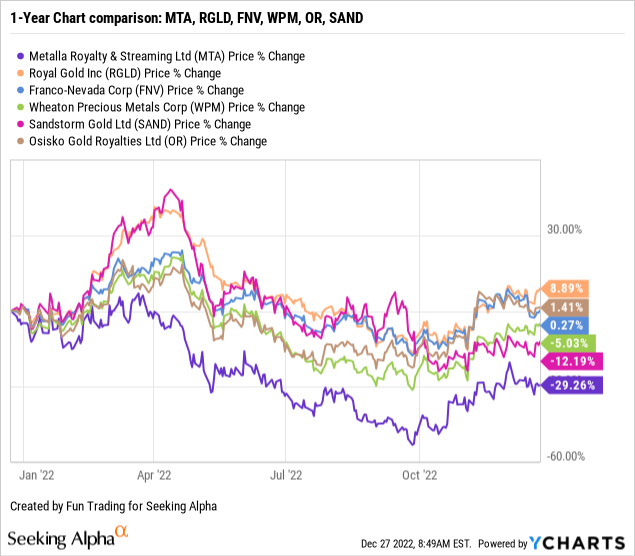
1 – Stock performance
MTA tumbled 29% on a one-year basis and remained the worst performer in the group. The company has used its stock to finance its expansion, significantly diluting shareholders. However, MTA has not used the ATM tool in 3Q22.
2 – Investment thesis
The investment thesis is quite simple regarding a small Streaming and Royalties company. MTA remains in the development stage with 70 assets, and the risk of dilution for shareholders is high.
MTA is not generating sufficient free cash flow and needs financing to expand its assets, implying share dilution. It is a sensitive issue for investors investing in a company in an early stage of development.
MTA Map Assets (MTA Presentation)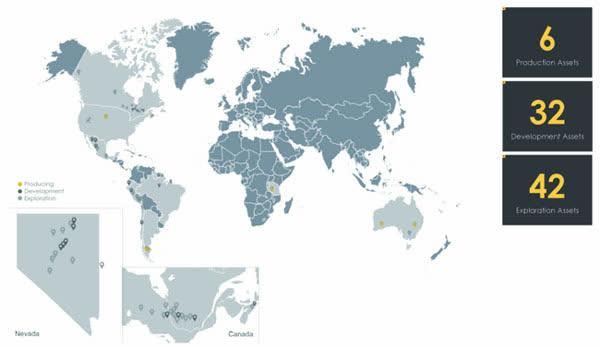
Thus, the best way to profit from such a volatile market is to trade short-term LIFO of about 65%-75% of your total position and use your short-term gain to increase your core long-term position for a much higher target when the market decides to turn bullish on gold again. The company has started to slow down its investment requirements.
One final word. I believe Metalla will ultimately merge with another gold and silver royalties company like Osisko Gold Royalties (OR) or eventually a bigger fish like Franco-Nevada (FNV). If this hypothesis comes true, accumulating a small to medium long-term MTA position seems even more appealing.
Metalla Royalty & Streaming Ltd.: 3Q22 Financial Snapshot History – The Raw Numbers
Note: The numbers are indicated in $US.
| Metalla Royalty | 2Q21 | 3Q21 | 4Q21 | 1Q22 | 2Q22 | 3Q22 |
| Total Revenues in $ Million | 0.70 | 0.79 | 0.81 | 0.67 | 0.46 | 0.66 |
| Net Income in $ Million | -2.73 | -2.19 | -3.13 | -2.23 | -1.37 | -2.54 |
| EBITDA $ Million | -2.10 | -1.48 | -2.06 | -1.29 | -0.74 | -1.65 |
| EPS diluted in $/share | -0.06 | -0.05 | -0.07 | -0.05 | -0.03 | -0.06 |
| Operating Cash Flow in $ Million | 0.39 | 0.43 | -0.58 | -0.29 | 0.12 | 0.32 |
| Capital Expenditure in $ Million | 10.58 | 0.04 | 11.17 | 1.00 | 0.00 | 0.12 |
| Free Cash Flow in $ Million | -10.20 | 0.39 | -11.74 | -1.29 | 0.12 | 0.20 |
| Total Cash $ Million | 3.45 | 9.98 | 2.34 | 3.27 | 3.37 | 3.30 |
| Total Long-Term Debt in $ Million | 3.31 | 3.32 | 10.52 | 10.77 | 10.81 | 11.10 |
| Shares Outstanding (diluted) in Million | 42.28 | 43.29 | 43.97 | 44.27 | 44.58 | 44.83 |
| Producing assets | 2Q21 | 3Q21 | 4Q21 | 1Q22 | 2Q22 | 3Q22 |
| Gold in GEOs | 646 | 766 | 772 | 724 | 560 | 714 |
| GoldCashivalent price realized | 1,778 | 1,733 | 1,718 | 1,835 | 1,844 | 1,714 |
Data Source: The company’s financial report
Gold Production and Balance Sheet Details
1 – Revenues were $0.66 million for the third quarter of 2022
MTA Quarterly Revenues History (Fun Trading)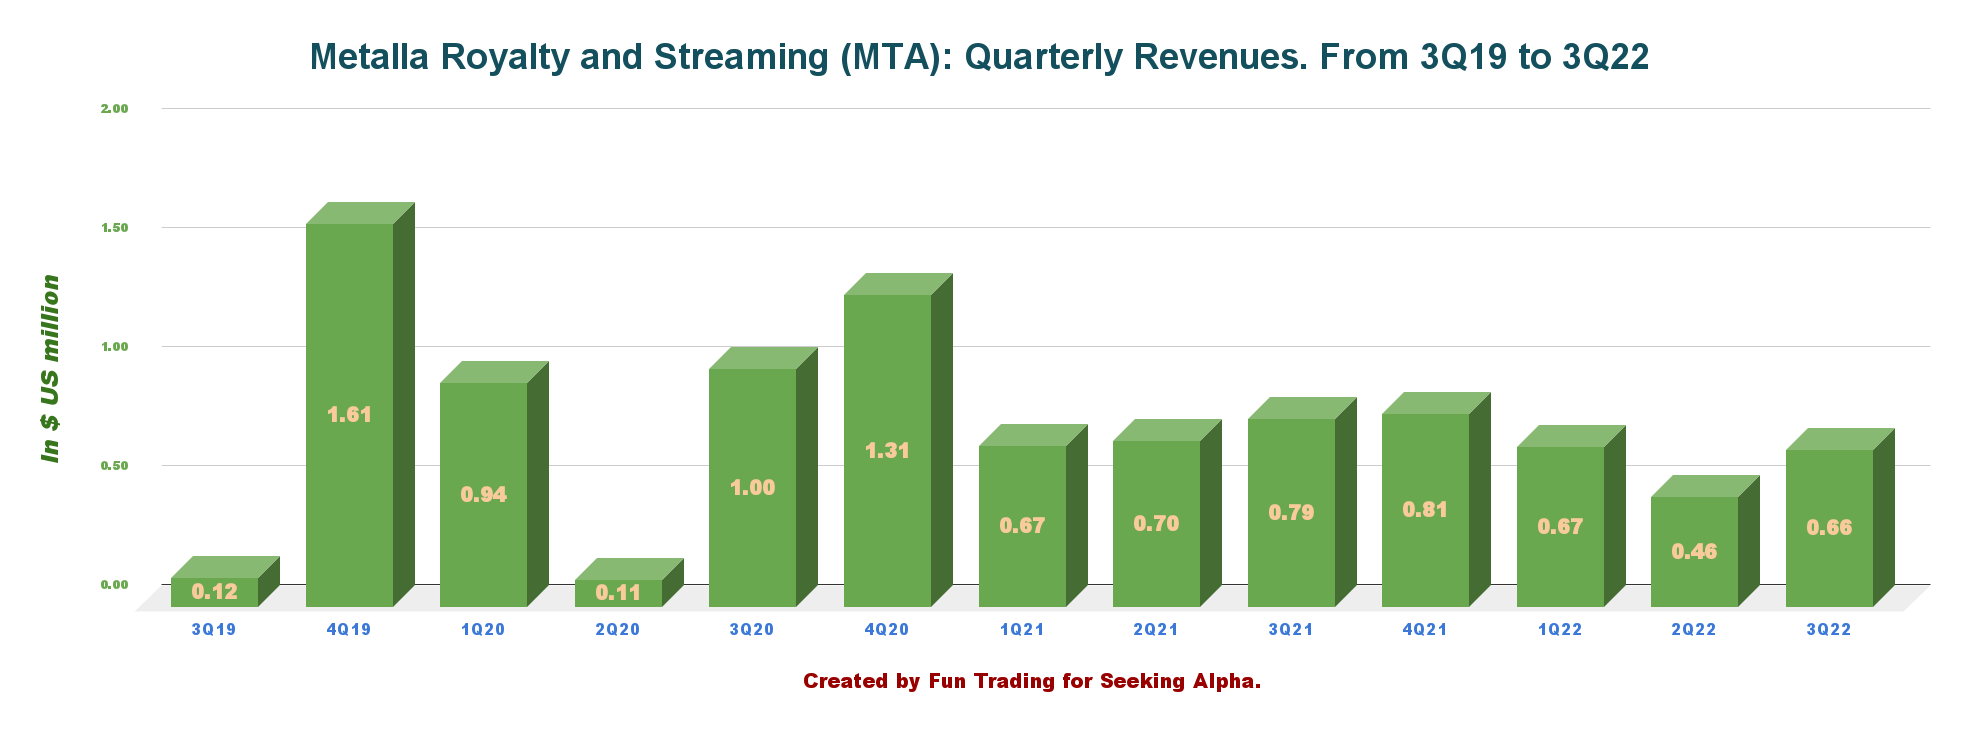
Revenues for the third quarter of 2022 were $0.66 million, down from $0.79 million in the same quarter a year ago and up from $0.46 million in 2Q22. Net loss was $2.54 million in 3Q22.
The three months ended September 30, 2022, and generated an operating cash margin of $1,707 per attributable GEO.
2 – Free cash flow was a loss estimated at $0.20 million for 3Q22
MTA Quarterly Free cash flow history (Fun Trading)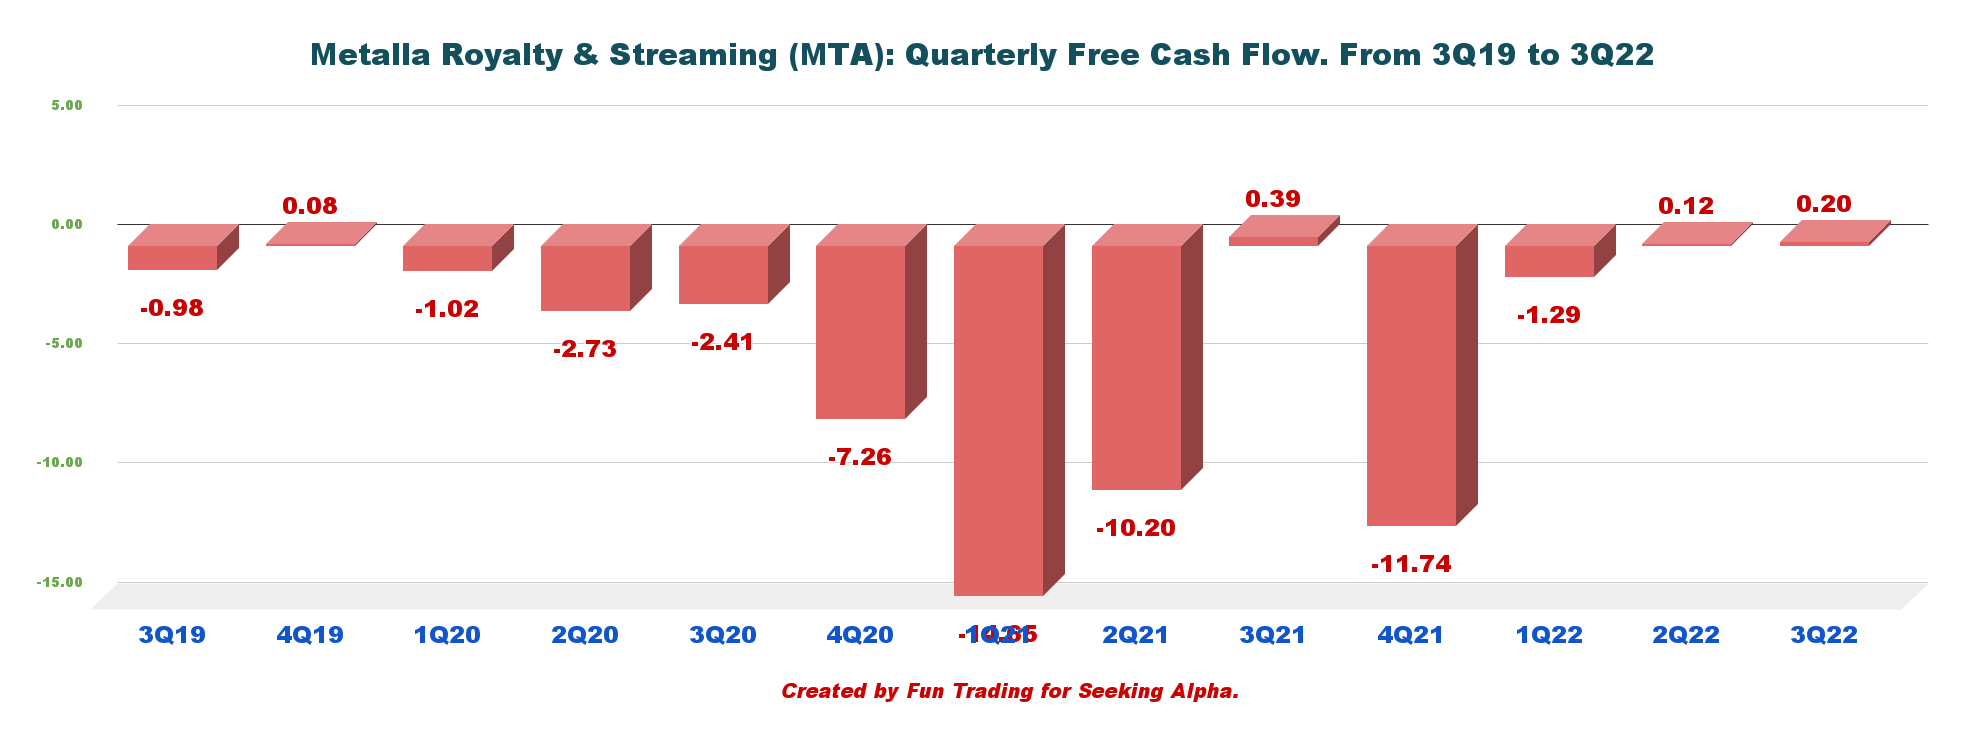
Note: Generic free cash flow is the cash from operations minus CapEx.
In my preceding article, I explained that Metalla is in the expansion phase. Thus, the company is not generating free cash flow on a one-year basis. We should expect little to no free cash flow in 2023.
During the quarter ending September 30, 2022, free cash flow was a loss of $1.29 million. Trailing 12-month free cash flow is now a loss of $12.71 million.
3 – Gold equivalent production details. Total production was 714 GEOs in 3Q22.
MTA Quarterly Gold Equivalent production history (Fun Trading)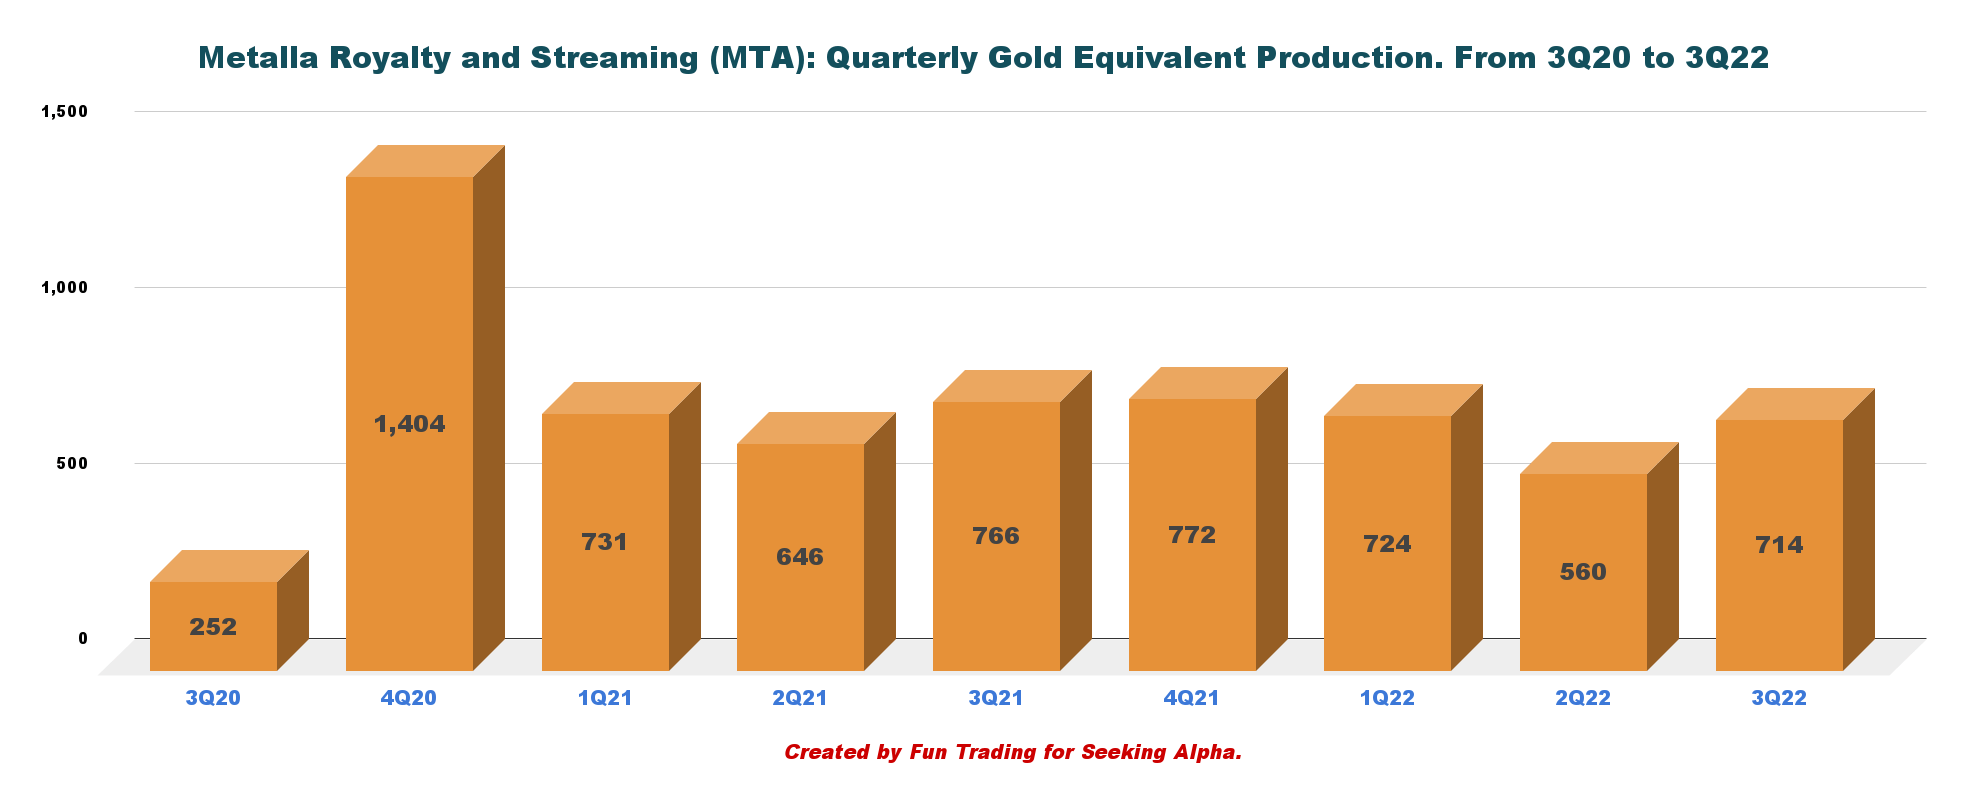
In line with expectations, revenue was $0.66 million, with gold equivalent production of 714 GEOs. For the nine months ended September 30, 2022, MTA received or accrued payments on 1,998 attributable GEOs at an average realized price of $1,794 and an average cash cost of $7 per attributable GEO.
The company increased its royalties and streams portfolio to 80 precious metal assets at the end of September 2022.
MTA Assets (MTA Presentation)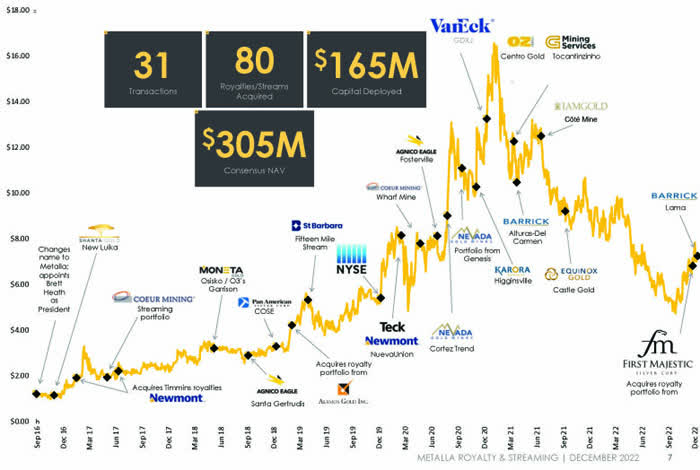
The last noticeable royalty acquisition for MTA was the LAMA gold and silver Royalty from Barrick Gold in Argentina/Peru.
MTA the Pasqua Lama Royalty acquisition (MTA Presentation)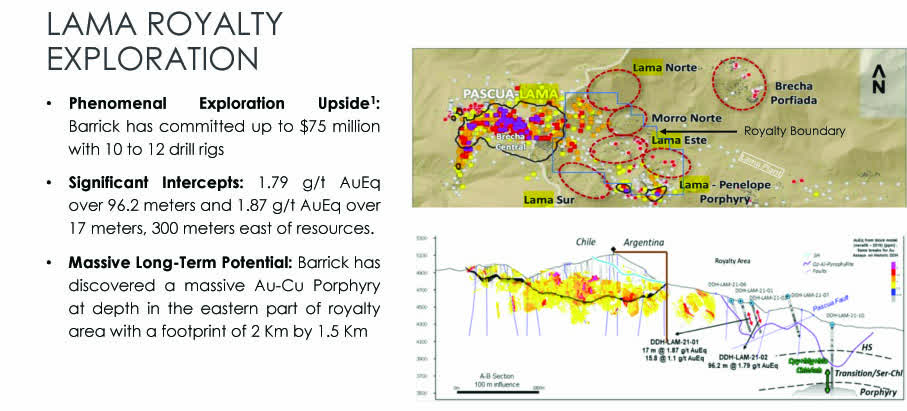
Gold was sold at $1,714 per ounce in 3Q22.
MTA Gold price history (Fun Trading)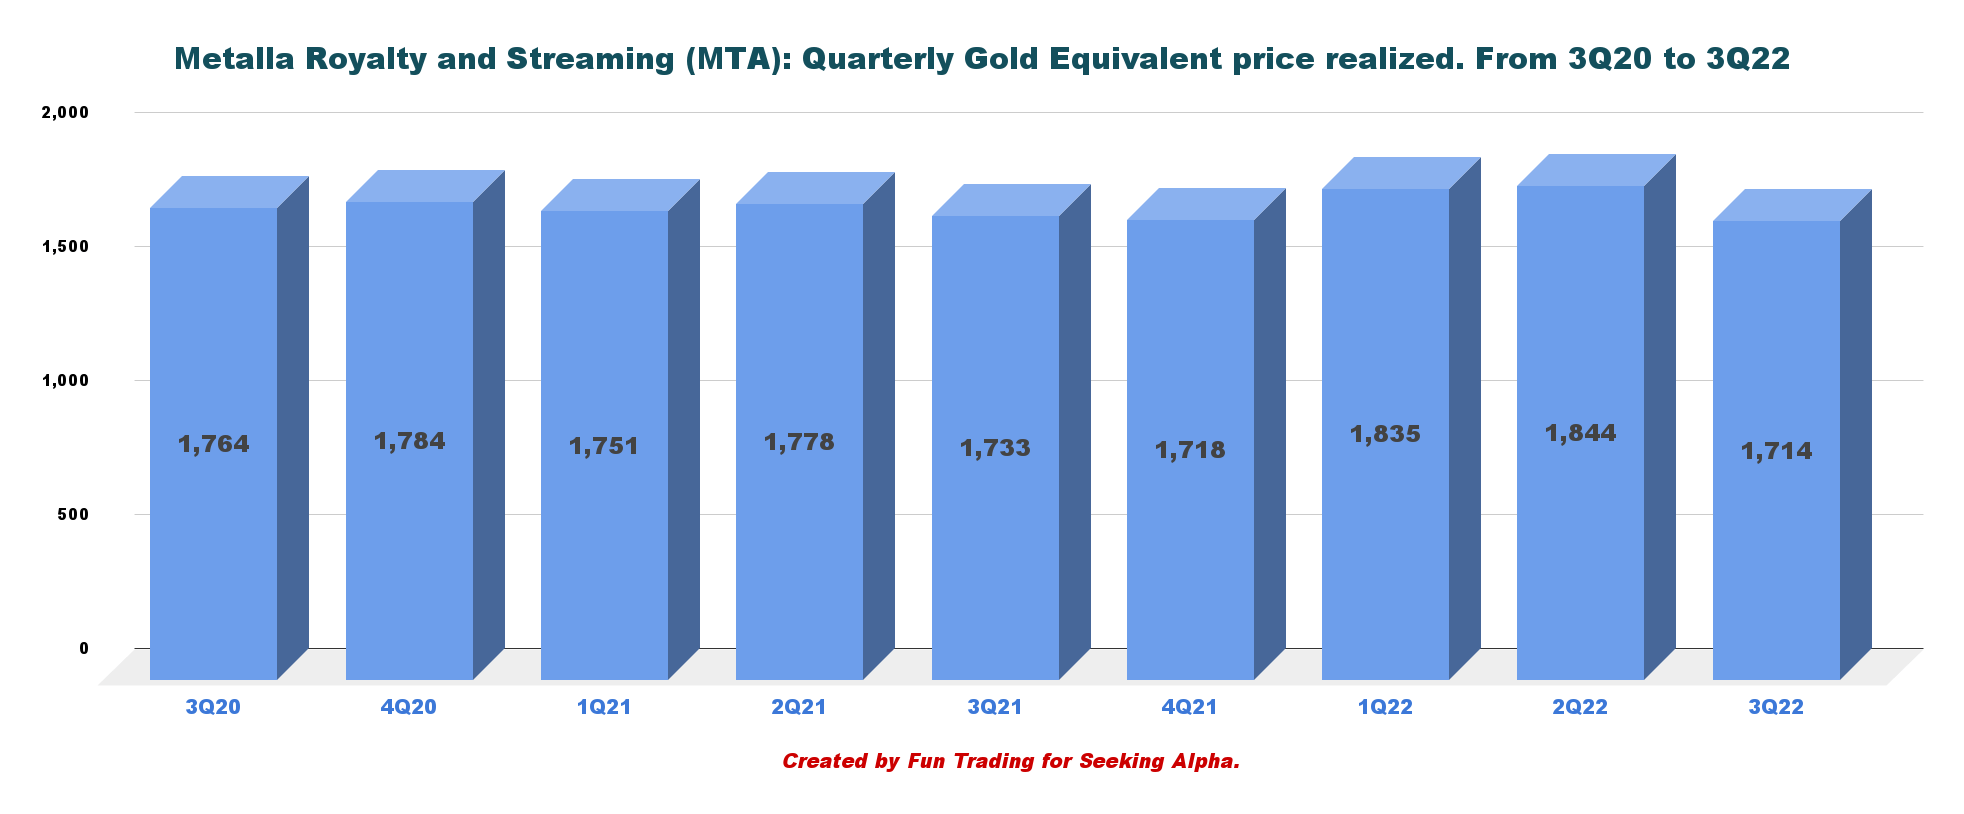
4 – Cash and debt
MTA Quarterly Cash versus debt history (Fun Trading)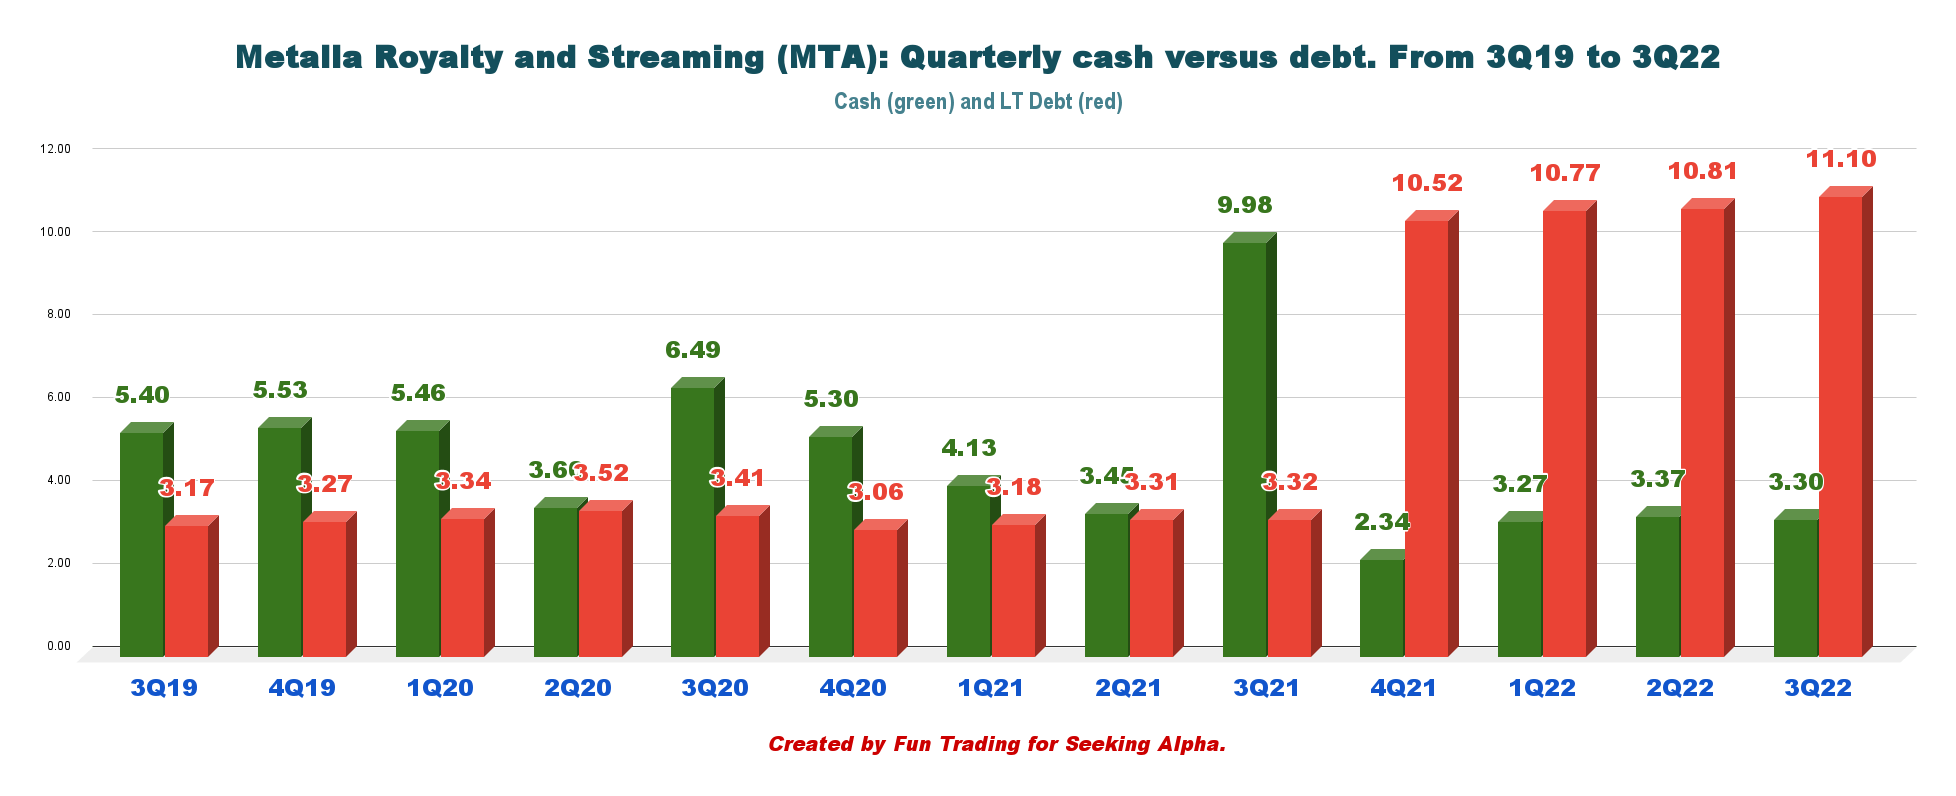
Cash on hand is $3.30 million, and long-term debt was $11.10 million at the end of September 2022.
On May 27, 2022, the Company announced that it had entered into a new equity distribution agreement with a syndicate of agents to establish an ATM equity program under which the Company may distribute up to $50.0 million in common shares of the Company. From inception to the date of this press release, the Company distributed 98,871 common shares under the 2022 ATM Program at an average price of $4.76 per share for gross proceeds of $0.5 million, of which no common shares were sold during the three months ended September 30, 2022.
Technical Analysis (Short Term) and Commentary
MTA TA Chart short-term (Fun Trading StockCharts)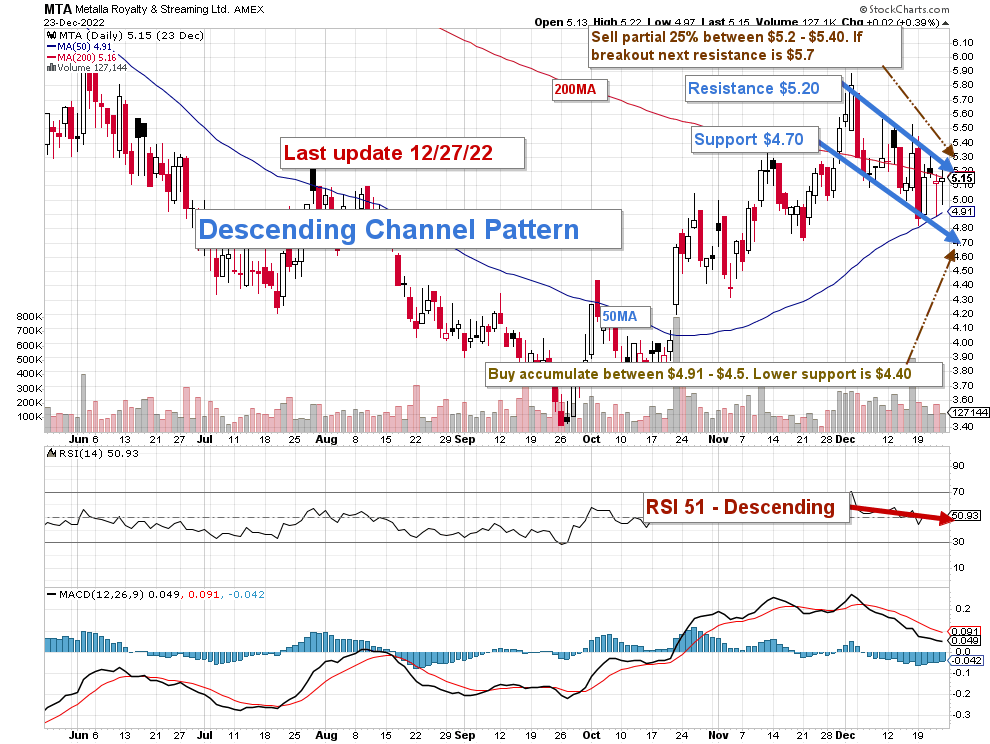
MTA forms a descending channel pattern with resistance at $5.20 and support at $4.70.
Descending channel patterns are short-term bearish in that a stock moves lower within a descending channel. Still, these patterns often form within longer-term uptrends as continuation patterns, which means that ultimately the end of the pattern will produce a positive breakout.
The overall basic strategy that I usually encourage in my marketplace, “The Gold and Oil Corner,” is to keep a small core long-term position and use about 65%-75% to trade LIFO while waiting for a higher final price target to sell your core position.
I recommend selling a part of your position at $5.20 to $5.40, with a potential higher target at $5.70. I believe it is reasonable to buy between $4.91 and $4.50, with possible lower support at $4.40.
The bullish potential is possible only if the Fed is less hawkish in 2023, which I think is already factored into the gold price. However, even if the FED decided to hike by 50 points on December 14, Jerome Powell hinted that more rate hikes are in store for 2023, tampering with recent enthusiasm.
The Bottom line is about the inflation rate in 2023, and despite some encouraging signs, the battle to cool it down is far from over.
Watch gold like a hawk.
Warning: The TA chart must be updated frequently to be relevant. It is what I am doing in my stock tracker. The chart above has a possible validity of about a week. Remember, the TA chart is a tool only to help you adopt the right strategy. It is not a way to foresee the future. No one and nothing can.
Author’s note: If you find value in this article and would like to encourage such continued efforts, please click the “Like” button below to vote for support. Thanks.
Be the first to comment