

vitranc/E+ via Getty Images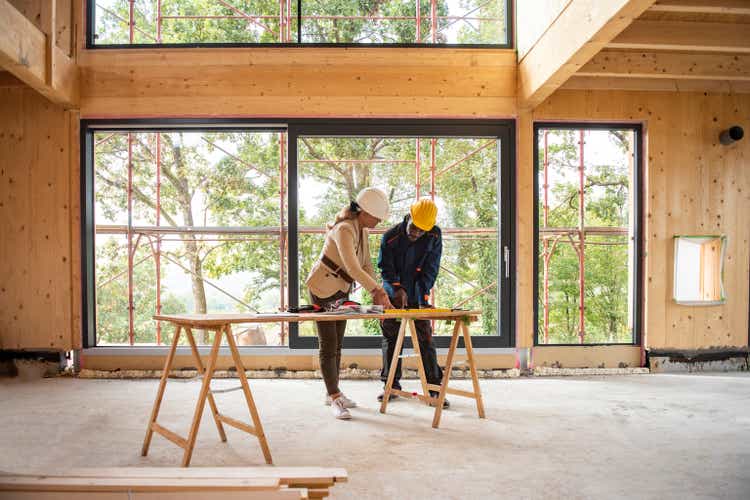
Investment Thesis
I am looking at this top pair trade from the fundamental perspective. I looked at 2 factors – business fundamentals and margin of safety. I am hunting for a pair trade from the homebuilding sector so that all the companies face the same economic situation.
The long position is the homebuilder with the best combination of good fundamentals and the best margin of safety. The short position is the home builder with the worst fundamentals and no margin of safety.
The results of such analysis show that you should buy Meritage Homes Corporation (NYSE:MTH) and short KB Home (NYSE:KBH). The rationale is that the price of MTH would go up as value investors pile in. Given the current economic situation and the news about the possible recession, investors in KBH would seek to get out.
Identifying the pair
I hunted for the pair among those homebuilders with about 10,000 or more homes delivered in 2021, as reported in their respective Form 10ks. Eleven companies met this criterion.
For each of the 11 companies, I determine the respective fundamental performance as well as the margin of safety.
- The fundamental performances were assessed based on 5 metrics.
- The margins of safety were computed by comparing the market price as of 23 June 2022 with the respective Earnings Power Value (EPV).
I then plotted the results on a scatter-gram. Imagine a matrix where the business fundamentals are plotted on the x-axis and the margins of safety are plotted on the y-axis. For the x-axis, the worst fundamental is on the left-hand side with the best on the right-hand side. For the y-axis, the worst margin of safety is on the bottom while the best is on the top.
The long idea is to be found in the top right corner of the matrix ie a combination of the best fundamentals and best margin of safety. The short idea is on the bottom left corner of the matrix ie the combination of worst fundamentals and worst margin of safety.
Chart 1 shows the scatter-gram of the 11 companies. I have identified MTH as the one with the best combination of fundamentals and margin of safety. I propose that you buy this. The one with the worst combination of fundamentals and margin of safety is KBH. I propose that you short this stock.
Chart 1: Scatter-gram of Fundamentals vs Margin of Safety (Author)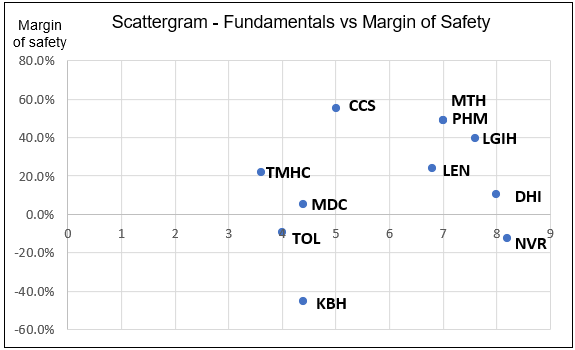
Note to Chart 1: MTH and Pulte were represented by the same point in the chart. They have the same fundamentals score and their margins of safety were very close.
No-growth Cyclical sector
The homebuilding sector is a cyclical one, as illustrated by the long-term Housing Starts chart.
Chart 2: US Housing Starts (Trading Economics)
Apart from being cyclical, you can see that there was no growth in the long-term average annual Housing Starts of 1.5 million units. If you want further details of my analysis of the homebuilding sector, refer to “Evidence Doesn’t Suggest That D.R. Horton Is A Growth Stock. Don’t Value It As Such.”
The homebuilding sector is a cyclical one, and as such any fundamental analysis should be based on the performance over the cycle. At the same time, there is no growth in the long-term average annual Housing Starts. As such, any valuation should be pegged to this long-term average level. Given the no-growth situation, I computed the margin of safety by comparing the market price with the EPV.
Fundamentals
I used the following metrics to determine the fundamental performance.
- Average gross profitability. Gross profitability = gross profit/total assets. According to Professor Novy-Marx, this has the same power as Price Book in explaining returns.
- Average ROE.
- 2021 Debt Equity ratio
- CAGR in revenue from 2011 to 2021.
- Average Cash flow from Operations. I then scaled this by the respective number of shares outstanding in 2021.
To determine the performance over the cycle, I computed the average based on the respective data from 2011 to 2021. I could not start from an earlier year as two of the panel companies had Form 10k data only from 2011. The year 2011 also represented the trough to the current Housing Starts cycle as per Chart 1 while 2021 is at about the peak.
The results are summarized in Table 1.
Table 1: Performance of the panel companies (Author)
Note to Table 1:
a) The average ROE was computed from 2012 as one of the panel companies did not have the 2011 data.
b) Data for the analysis were extracted from TIKR.com.
c) The Housing Starts grew at a CAGR of 10 % from 2011 to 2021. So achieving 13% to 16 % CAGR in revenue is not something exceptional.
To determine the overall performance, I used a simple scoring scheme as follows:
- For each metric, I ranked the performance of the 11 companies.
- The best-ranked company was given a score of 11. The next best rank had a score of 10. This the worst-ranked had a score of 1.
- The overall performance was the average score of the 5 metrics.
- Note that for the Debt-Equity ratio, the best performance was the company with the lower value. But for the other metrics, the best was the company with the higher value.
The results are summarized in Table 2.
Table 2. Performance ranking (Author)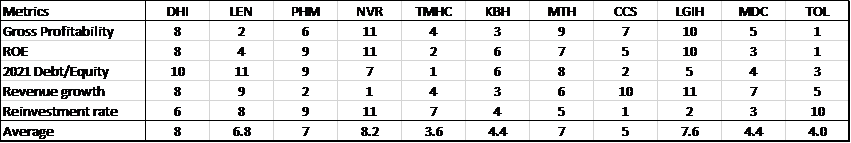
Note to Table 2: The number of homes delivered as per Table 1 was only for identifying the panel companies and was not used in computing the overall performance.
Valuation
I determined the EPV using the Free Cash Flow to the Firm (FCFF) model. I then derived the equity value by deducting the Minority Interests, Debt and adding back Cash based on the LTM values.
EPV = FCFF / WACC
Where:
FCFF = EBIT (1-Tax)
EBIT = GP – SGA
GP = Revenue X GP margin
SGA = Revenue X SGA margin
Revenue = Long-term average revenue based on 1.5 million Housing Starts. I computed this by taking the respective 2021 revenue and scaling it by (1.5/1.6) where 1.6 represented the 2021 Housing Starts.
GP margin and SGA margin = average 2011 to 2021 values, i.e., the performance over the cycle.
Tax = assumed nominal tax rate of 21%.
WACC = Based on CAPM where the Risk-free rate (3.0%), Beta (1.01), and Equity risk premium (4.51) were based on the average values for 2005, 2009, and 2021. This was to reflect the average long-term perspective. Data for these were extracted from Damodaran’s dataset.
I computed the respective margins of safety by comparing the EPV with the market price as of 23 June 2022. The results of the analysis are shown in Table 3.
Table 3 Margin of safety (Author)
I then plotted the scatter-gram of the average fundamental score and margin of safety as shown in Chart 1.
Choosing the pair
As can be seen from the scatter-gram as per Chart 1, the worst stock in terms of fundamentals and negative margin of safety was KBH.
But when it came to the best fundamentals and best margins of safety, there were 3 companies in the top right-hand corner of the scatter-gram. These were MTH, PHM, and LGIH.
To select among these 3, I considered the following additional metrics.
Table 4: Additional metrics (Author)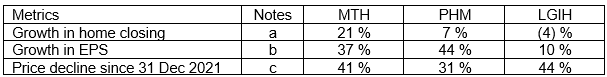
Notes to Table 4:
a) 2022 guidance c/w 2021
b) 2022 estimates as per Yahoo Finance c/w 2021
c) Current market price c/w price at 31 Dec 2021
Based on Table 4, I selected MTH as the stock to go long as this has the better growth prospects and the highest price decline. I am assuming that the price increase potential is equal to the price decline.
Risks
In addition to the risk of shoring a stock, there are 3 other risks to consider: investment horizon; market behavior; and analytical risks.
According to Investopedia, “Trading on fundamentals is more closely associated with a buy-and-hold strategy rather than short-term trading.” Thus, this recommended pair is not meant for day trading. The investment period is probably going to be longer than several weeks. The risk is then associated with holding the short position for months. The holding period for the long position could even be longer given the current market situation.
Secondly, the investment thesis assumes a certain market behavior. I assumed that the market would be able to discern the undervalued stocks from the overvalued ones and re-rate them accordingly. I am suggesting that there are sufficient fundamental investors to counteract the impact of those that trade based on sentiments. In mitigation, the prices of the homebuilders have dropped by more than 30% over the past 6 months. As such, I think that most of the sentiments investors have exited the market. So, the risk may not be so great.
When it comes to the analytical risks, there are 3 aspects:
- The conventional fundamental analysis covers both qualitative and quantitative analysis. However, for the pair trading, I am looking at only the quantitative analysis.
- I am assuming that the 5 metrics selected are good enough to differentiate the performance of the 11 companies.
- I am assuming that my scoring scheme is good enough to differentiate the performance of the companies.
As can be seen from Chart 1, there are 3 companies in the top right-hand corner of the matrix. I have chosen MTH. The choice may be different if a different set of metrics or scoring scheme was used. The good thing is that the stock to short is clear as I see shorting as a bigger financial risk.
As for the shorting risk, the concern is whether the price of KBH rise after declining by about 36 % since end Dec 2021? Given the current news about high inflation and the strong prospects of a recession, there are not that many positive news to drive price higher. So shorting KBH may not be as risky as during “normal” times especially given that its poor fundamentals.
Conclusion
The most common way to trade is to base it on some technical indicators. I have chosen not to follow this approach as I believe that for an investor to make money, you have to think differently. I have thus selected a fundamental way to identify the trading pair.
I have chosen the homebuilding sector as the market prices of this sector have declined by more than 30% over the past couple of months. There are thus opportunities to have positive margins of safety based on the EPV.
To determine the pair, I have used a combination of fundamentals and margin of safety. In line with the fundamental approach, the long stock is one with the best combination of fundamentals and margin of safety. The one to short is the one with the worst fundamentals and negative margin of safety.
As the homebuilding sector is a cyclical one, looking at the current performance will be misleading. As such, I have analyzed and valued the stocks based on the performance the key over the cyclical.
I am a value investor and I am very confident that you can make money buying long on MTH. The challenge is whether you can make money from shorting KBH. The price of KBH has dropped by 36% since end Dec 2021? Can it drop further?
I am confident it will, as the market has overpriced KGB even in December 2021. This is because of its poor fundamentals over the cycle. As the number of Housing Starts begin to decline, KBH’s poor financial results will be more apparent. KBH aptly fits what Warren Buffett said: “Only when the tide goes out do you discover who’s been swimming naked.” But we may have to wait till the end of the year for the first sign of this.
Be the first to comment