

ipopba/iStock via Getty Images
Investment Summary
In our last publication on Merit Medical Systems, Inc (NASDAQ:NASDAQ:MMSI) we were on the cusp of re-rating the stock but needed further evidence to do so. We’d set a price target of $57, when the stock was trading at $61. Fast forward to the present day and MMSI has rallied 18%, primarily from a far better-than-expected set of results in Q3. Hence, after extensive review and consultation amongst our team, we’re back here today to re-rate our position on MMSI to a buy. For reference, here’s our last 3 publications on MMSI, which you can read by clicking here, and here, and here.
In saying that, there’s been several changes to our observations, which include the following:
- Continued growth in return on employed and invested capital, now diverging away from free cash inflows as the company makes new investments.
- Guidance revised from the top-bottom line, with the company now calling for 120% EPS upside from the FY21 result.
- Technicals overwhelmingly bullish with multiple studies corroborating upside targets to ~$85.
- Strong demand across the product portfolio, with double-digit growth in key cardiovascular segments.
- Improving broad market fundamentals, with S&P 500 futures up 400bps in the past month of trade.
Consequently, we now see a bullish tilt to the risk/reward calculus, with an asymmetric upside reward now on offer. We rate the stock a buy and are seeking upside targets to $85, then to $126.
Q3 financial results ahead of internal, consensus expectations
Last time, we mentioned several levers that were set to potentially benefit the company downstream. Chief among those was clinical trial momentum and the SCOUT mini reflector launch.
Turning to MMSI’s Q3 results, we’d note it was the financial results that’s stretched the share price performance since our last coverage. MMSI secured upsides versus consensus at the top and bottom line.
Total revenue growth of 750bps YoY pulled in to $287mm for the quarter, underscored by strengths in the company’s US and ex-US markets, up 860bps and 610bps YoY respectively.
We should also note it wasn’t immune to foreign exchange (“FX”) headwinds from the USD strength this quarter, with a 3 percentage point headwind to top-line growth. Still, it pulled this down to core EBITDA of ~$40mm, around 600bps above the same time last year.
It’s also worth noting MMSI recognized a 17% YoY gain in operating income and corresponding 130bps gain in operating margin. We opine this to be a strongpoint in the MMSI investment debate, seeing as OpEx only climbed 100bps YoY, helped by reduced R&D investment. From the call, we saw the wind-back in R&D stemmed from less expenditure to travel and other inflation-sensitive inputs across its core portfolio.
Speaking of the divisional highlights, we noted several takeouts from the quarter. To name a few:
- Overall revenue growth was underpinned by 10% YoY upside in the cardiovascular (“CV”) segment and 14% growth in the endoscopy business. Within the former, peripheral intervention (“PI”) products stretched up by 12%, with strong demand in the embolics and access products line, up 18% and 24% respectively.
- We also saw the cardiac intervention arm expand 12% YoY, underlined by strong demand across the portfolio. Noteworthy, intervention sales lifted 26% YoY. Being the largest division of the PI business, it was important for MMSI to realize growth here to bulk up revenue volume for the broad segment.
- Turning to electrophysiology and cardiac rhythm management (“EP & CRM”) sales we observed another strong 25% YoY lift. In our opinion, this represents a normalization of global patient trends back towards pre-pandemic ranges, and is therefore a great sign for MMSI’s revenue clip in this division.
- Finally, our key takeout was the growth in MMSI’s original equipment manufacturer (“OEM”) division. We saw 23% YoY growth in the OEM segment, which we believe was driven by strong reordering rates from large customers, plus some uptick in order rates from specific categories such as access coatings and fluid management.
You can see a look-back of MMSI’s quarterly operating numbers in Exhibit 1, with particular attention to the cyclical growth in core EBITDA and trailing FCF yield at 2.14%. We’d note, as in our last MMSI note, that in light of the recent share price gains, this appears to be a solid number in our opinion.
Exhibit 1. MMSI Operating walk-thru, FY16–date, with revenue, core EBITDA and trailing FCF yield.
Data: HBI, Refinitiv Eikon, Koyfin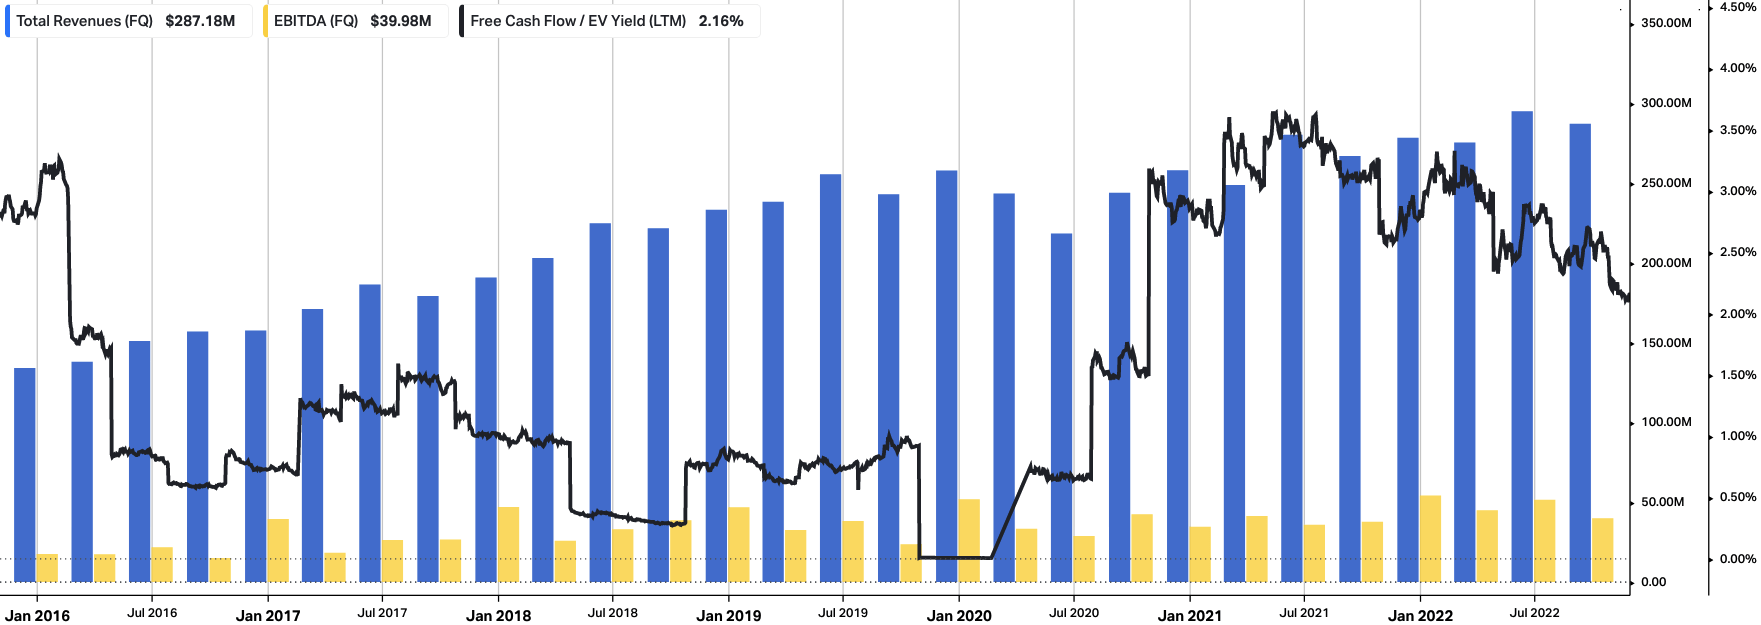
As such, we observed similar strengths in profitability this quarter from MMSI. Last time, we noted this to be a key upside driver for the company looking ahead, especially with its upcoming product launches and R&D involved with the same.
Despite the growth in free cash inflows reverting down, at the same time, we observe a corresponding uptick in trailing return on capital employed [Exhibit 2]. This is an analysis we perform on just about all companies to gauge management’s capital budgeting abilities.
We’d advise the coupling between FCF and return on capital is a positive setup for MMSI, because it shows that, as cumulative free cash flows are tightening, the cash is being invested prudently and generating a substantial uplift in return on capital since FY20.
To us, this is sound capital budgeting and demonstrates management’s grip on working capital and invested capital. As the cost of capital increases, we need to see this number continuing to stretch higher, above the current WACC hurdle of 9% [annualized].
Exhibit 2. FCF and return on capital employed coupling demonstrating proficiency in capital budgeting.
Data: HBI, Refinitiv Eikon, Koyfin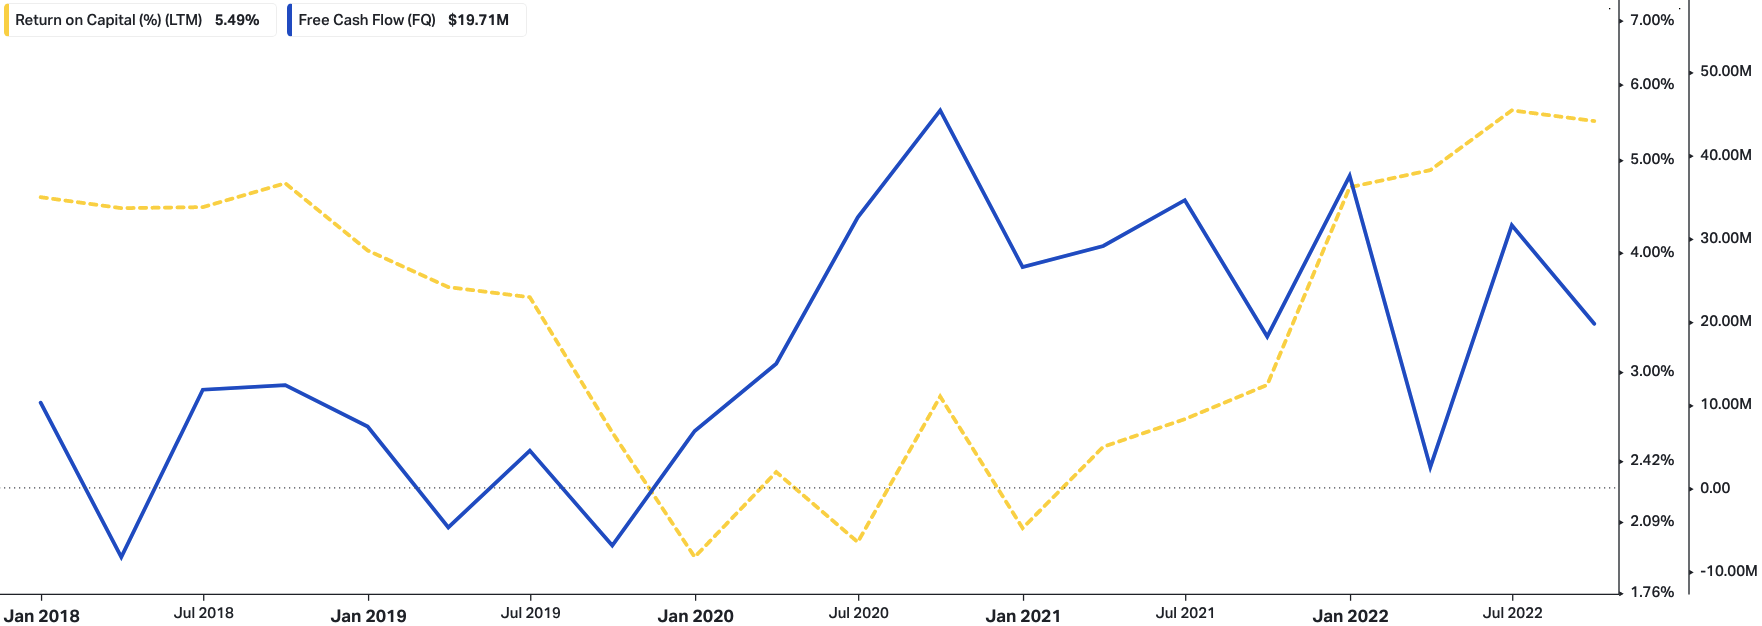
MMSI technicals supportive of further upside capture
Unlike in previous analyses, where the stock had struggled to break out about the ~$63 mark on 2-3x occasions in 2022, MMSI has broken out to the upside above its previous highs.
You can see the corresponding price action below, which we’ll dictate to you. Entering into H2 FY22, MMSI re-rated heavily to the downside and bottomed at 52-week lows in July.
Well before this, in 2021, the 50DMA and 250DMA crossed to the downside, such that the stock has faced heavy resistance at the 50DMA line since then until October.
The broad market rally in October helped the stock lift from its 3rd test at the flat base shown below, then again with the Q3 earnings print, where it eventually broke above the 50DMA neckline.
Since, it has punched above the 250DMA, having closed up for the past 10 weeks straight. At the same time, the volume trend had been supportive, with a breakout and reversal pushing into the latest upside move.
Tracing the fibs’ down from the April 2022 high, we can see the stock has retraced 100% of the entire move, and we now have our next objective to $89, or ~162% of the entire move.
Exhibit 3. MMSI weekly price evolution and fibonacci retracement, next objective to $89 with stock now above 50DMA and 250DMA, strong accumulation via volume trend.
Data: Updata
What about the ‘validity’ of the move? In the sense, where can we expect the trend to head next? Looking at the 6-month daily cloud chart below, you’ll see that MMSI is now trading well above the cloud with the lag line in hot pursuit. As a result, we’ve got on balance volume and momentum trend indicators each pointing to accumulation and hence further upside. Looking at the cloud itself, it’s in the blue and widening in area, again, another bullish tilt to the risk/reward calculus.
Exhibit 4. Trading above cloud support with further evidence of accumulation in on balance volume, momentum
Data: HBI, Updata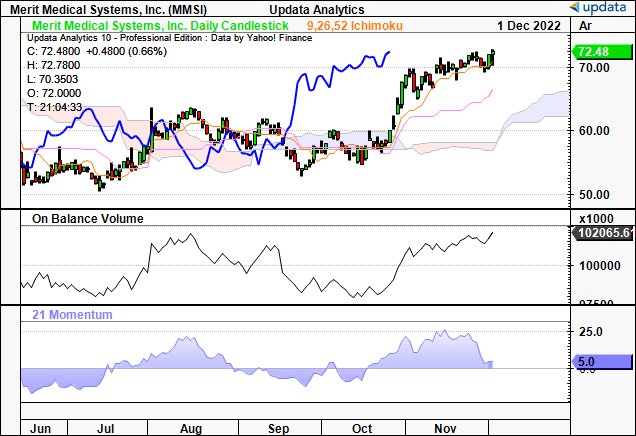
As such, we’ve got technical targets shooting off in a range of $72–$86.5. Note, these have served us well to date, and the $72 target that was set off in September has now been met, giving further confidence of the $86 target. This is also remarkably close to the fibonacci indicated target listed above.
Exhibit 5. Upside targets to $86.5, corroborative of findings above.
Data: Updata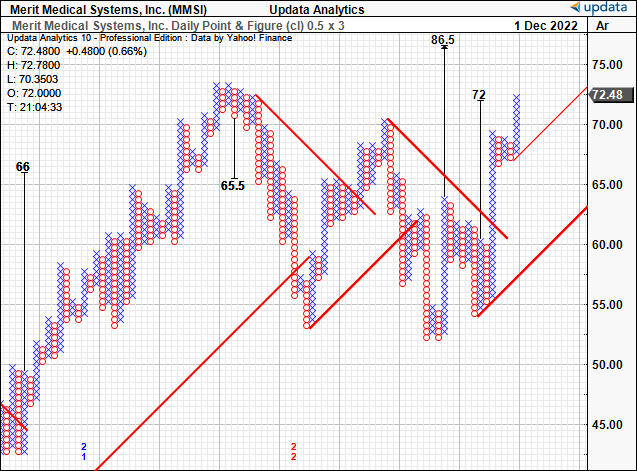
Valuation and conclusion
We should first advise that management updated FY22 guidance on the call. It now projects revenue growth of 650–710bps for the year, calling for $1.15Bn at the upper end of range. This bakes in a negative $23.7mm FX headwind.
On this, it forecasts CapEx and invested capital in a range of $55–$60mm, with a free cash inflow of $75mm. Driving these growth estimates is MMSI’s single-digit growth forecast across the entire portfolio. It hopes to bring this down to earnings of $1.13–$1.90, well up from the previous range of $1.08–$1.18. On a non-GAAP basis, it sees $2.55–$2.61.
We are aligned with management’s forecasts and had arrived at the $1.90 EPS number in our base case, with non-GAAP EPS of $2.57 [Exhibit 6]. In that vein, we project 37%–47.5% YoY EPS growth for MMSI into FY24′.
Exhibit 6. MMSI growth assumptions [internal estimates] – note, only non-GAAP/adjusted EPS estimates are charted.
Data: HBI Estimates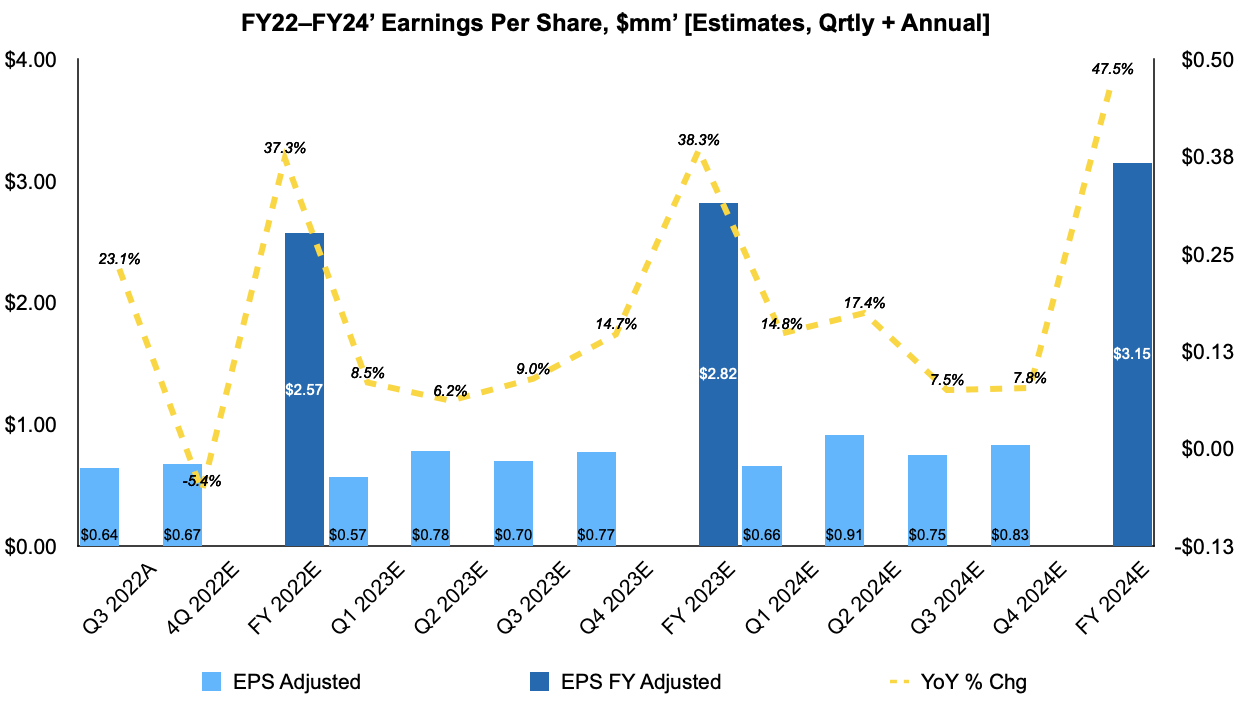
Consensus also values the stock at 64.8x forward earnings, and we’d suggest this is a fair and reasonable estimate. We are above consensus in that our calculations lead us to a 66.5x forward P/E multiple, further intensifying our alpha opportunity.
Rolling our FY22 EPS estimates forward [note, we’ve used GAAP EPS] to the 66.5x multiple derives a price target of $126.30, or 74% upside potential. This confirms our bullish thesis, and we now have price objectives of c.$85 then ~$126 in this name.
Exhibit 7. Fair P/E est. of 66.5x FY22 EPS Est. = $126
Note: Fair forward price-earnings multiple calculated as 1/fair cost of equity. This is known as the ‘steady state’ P/E. For more and literature see: [M. Mauboussin, D. Callahan, (2014): What Does a Price-Earnings Multiple Mean?; An Analytical Bridge between P/Es and Solid Economics, Credit Suisse Global Financial Strategies, January 29 2014]. (Data: HBI Estimates)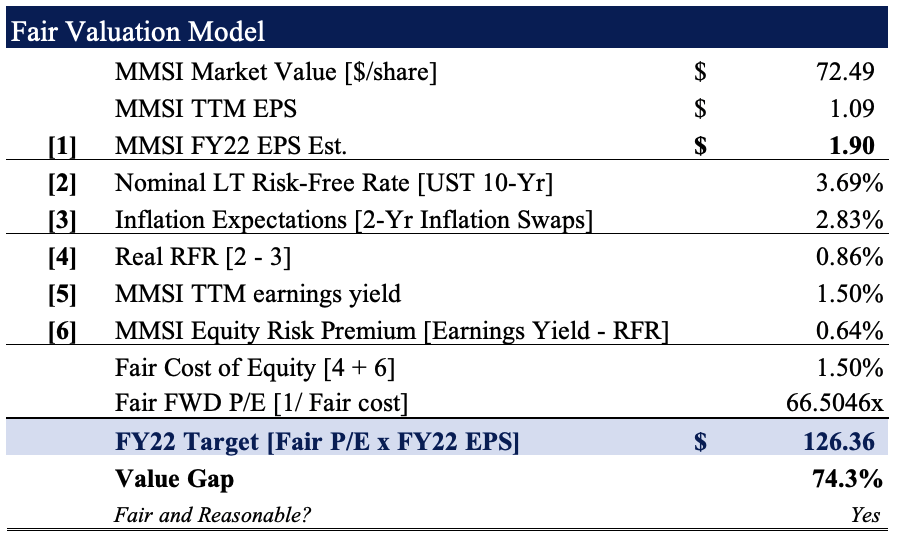
Net-net, we revise our position on MMSI to a buy, on factors of valuation, forward EPS upside and recent fundamental momentum. We are seeking price objectives of ~$85 then to $126 in this name.
Be the first to comment