

ipopba/iStock via Getty Images
|
Merion Road Small Cap Fund |
IWM (Russell 2000) |
Barclay Hedge Fund Index |
MRCM Long Only Large Cap |
SPY (S&P 500) |
||
|
Annualized Since Inception |
17.4% |
8.0% |
4.9% |
Annualized Since Inception |
7.2% |
9.0% |
|
Q4 2022 |
(3.5%) |
6.2% |
3.2% |
Q4 2022 |
(6.4%) |
(4.9%) |
|
2022 YTD |
(16.9%) |
(20.4%) |
(8.5%) |
2022 YTD |
(34.9%) |
(18.2%) |
|
2021 |
42.5% |
14.5% |
10.0% |
2021 |
20.4% |
28.7% |
|
2020 |
29.5% |
20.0% |
11.0% |
2020 |
54.3% |
18.3% |
|
2019 |
17.9% |
25.4% |
10.6% |
2019 |
25.2% |
31.2% |
|
2018 |
15.7% |
(11.1%) |
(5.2%) |
2018 |
(6.0%) |
(4.6%) |
|
2017 |
35.7% |
14.6% |
10.3% |
Dec 18 – Dec 31 |
0.1% |
(0.5%) |
|
2016 (Jul-Dec) |
1.3% |
18.7% |
5.4% |
|
Note: All returns are net of management and performance fees. Past performance is not indicative of future results. Returns for the Merion Road Small Cap Fund for the period prior to fund launch (01/13/22) reflect a basket of SMAs. |
While some degree of self-flagellation after a year like 2022 is deserved, let’s skip the foreplay and dig right into position commentary.
The long only portfolio ended the year down 35%. Our largest holdings remain Ferguson (FERG), Google (GOOG, GOOGL) , and Copart (CPRT) which I have discussed in detail over the past few years.
Ferguson
Increasing risks for a slow-down in new residential construction have yet to appear in the company earnings as they grew revenue and EBITDA by 23% and 22% respectively over the trailing 12 months. There is little doubt that the pull-back is coming given what we have seen in new permits and residential construction starts. Remember that only half of FERG’s business serves the residential market and 60% of their business is used for repair, maintenance, and improvement. FERG has historically grown a few percentage points in excess of the market and has a strong balance sheet to capitalize on others’ weakness. Assuming revenue falls 12% (15% organic offset by acquisitions) and EBITDA margins drop from almost 11% to 9%, the company would still generate over $7 a share in cash. Importantly I can see earnings recovering to $10 a share in the next couple years. FERG fell 29% to end the year at $127, implying just 18x/13x depressed/normalized earnings.
Alphabet / Google
While concern regarding the advertising market and negative sentiment towards the FANG names hung over GOOG’s head for most of the year, a new risk arose in November: ChatGPT. Associated with Microsoft, ChatGPT is an AI based chatbot that can answer user questions with a seemingly human response. While the ChatGPT product is in no ways perfect and GOOG has a similar product, the writing is on the wall – AI will disrupt a myriad of industries. Is this the boogeyman to take down GOOG’s monopoly on search? I don’t think so. When a company becomes a verb, it is hard to replace it from consumer mindshare. If you are looking for the best taco shop in your neighborhood, do you say “I am going to internet search it” or “let’s Bing the best one”? Assuming the products are roughly comparable, routine matters. Additionally, the use case for AI differs widely from most of GOOG’s queries and given the cost difference between running either search, it may not make sense for the majority of operations.
Meanwhile the company has been increasing share repurchases and there are some green shoots that GOOG might become more serious on cost controls. GOOG fell 39% to end the year at $88, has $8 a share in cash and should generate around $5 and share in free cash flow implying a 16x multiple.
Copart
CPRT is like a steam roller crushing over any barriers in its path. If used auto prices are up, CPRT benefits from higher pricing on lower volumes; when prices are down, they make less per car but volumes increase. All the while the company continues to increase their ancillary offerings, grow the industry domestically, penetrate new geographies, and steal market share. While this may seem effortless from the outside, internally they have an intense focus on improving their product and satisfying their customer. Not much has changed with CPRT during the year. Revenue and EBITDA increased 23% and 12% over the past twelve months. CPRT fell 20% and ended 2022 at $60, had $3 of net cash on their balance sheet and is poised to generate $2.50 in free cash flow implying a 23x multiple.
During the quarter I built a new position in Mueller Water Products (MWA). They are a 165-year-old manufacturer of products used in the transmission, distribution, and measurement of water in North America. Their end markets are relatively stable and growing with 60-65% serving repair and replacement of municipal water systems, 10% natural gas utilities, and the remaining residential construction. They are either a leading player in key categories like fire hydrants (#1), iron gate valves (#1), butterfly valves (#1), and brass products (#2). Given MWA’s established brands and installed base, and considering their end customer of US governmental entities, it is not surprising that market share shifts are rare. As such, revenue has historically grown low single digits. This should continue and perhaps accelerate over time given the woeful state of our water infrastructure. At the end of 2021 the US passed a new infrastructure bill that allocated $55bn to water, the highest level on an inflation adjusted basis since the mid 1970’s.
While that background sounds positive, it has not been smooth sailing for MWA. Over the past few years EBITDA margins have contracted from 19% to 15% and pre-tax tangible ROICs have fallen from 35% to 20%. The company has been reorganizing and modernizing their operations in recent years. They expanded their large valve manufacturing in Chattanooga TN and built a new facility nearby in Kimball TN to capitalize on growing product demand. In the process they consolidated several facilities into Kimball for improved efficiency and to accommodate built-in-America preferences. MWA is also in the process of constructing a new brass foundry in Decatur IL to be completed in 2024. While these initiatives have the potential to streamline operations and increase capacity, they have been capital intensive and led to short term pain such as machine downtime and outsourcing.
This past October MWA announced that it reached a cooperation agreement with activist fund Ancora. MWA appointed 2 Ancora nominees to the board of directors, agreed to a longer-term board refresh, and immediately formed a capital allocation and operations committee. While it is too early to see tangible results, it is encouraging to have a vested owner looking out for shareholders’ interests. Valuation is attractive at just 8x 2024 consensus EBITDA, especially when considering that water peers trade at ~12x.
The Small Cap Fund lost 17% in 2022. Our largest positions are Westwood Holdings (WHG), Mastech Digital (MHH), and America’s Carmart (CPRT).
Westwood Holdings
WHG closed on the acquisition of Salient in November, increasing their assets under management from $12.3bn to $16.3bn. At these levels the company should generate about $90-$95mm in revenue, $12mm in EBITDA, and $1 per share in free cash flow. While AUM is dependent upon how the equity markets perform, I view this earnings level as a somewhat depressed figure. The Russell 2000 (they are primarily a small cap manager) fell 20% last year and, on a multi-year horizon, small caps have noticeably underperformed their counterparts. Furthermore, my analysis assumes a 13% EBITDA margin which is well below peers who operate in the 25-40% range. The primary reason for this difference is their asset per employee metric which sits at $130mm vs. industry norms of $200-$250mm. The industry is consolidating given these scale benefits. The stock ended the year at $11 and is trading at 7.5x free cash flow net of cash on the balance sheet.
Mastech Digital
The big news out of MHH came in Q3 when they announced disappointing results in the Data & Analytics (“D&A”) segment and the abrupt termination of the divisions’ relatively new CEO. You may recall that MHH was originally a staffing company that built the D&A segment through two acquisitions: Infotrellis and Amberleaf. Under their ownership MHH has focused on expanding the D&A service capabilities beyond master data management and into high growth areas like data modernization and analytics. These growth investments have yet to bear fruit as segment EBITDA margins have deteriorated from >20% to ~10%. MHH was quick to hire a new division head, Michael Fleishman. Michael has a strong background in IT leadership and sales and I found him convincing when I had a chance to speak with him. While the potential for a new acquisition is likely pushed out a few quarters, MHH should be able to organically reaccelerate revenue growth and improve margins. MHH ended the year at $11, has a small net cash position, and is currently generating ~$1.15 in free cash flow.
America’s Carmart
CRMT. Given that CRMT was a relatively recent addition to the portfolio that I discussed in my Q3 letter, not much has changed. CRMT ended the year at $72 which equates to 93% of book value.
During the quarter I built a position in United Bancorporation of Alabama (OTCQX:UBAB). This is my jockey in the Emergency Capital Investment Program (“ECIP”) trade. For those of you who are unfamiliar with it, the ECIP was established in 2021 to encourage lending into disadvantaged communities. Organizations certified as Community Development Financial Institutions or Minority Depository Institutions were eligible to receive funding in the form of nonvoting, perpetual preferred equity. The cost of the preferred equity is zero for the first two years and will thereafter range between 0.5% and 2.0%. While the goal of the program is to increase lending, receiving institutions can effectively use the capital how they please (there are some limitations around capital distributions that exceed net income).
Assuming the most conservative action, a receiving institution can park the ECIP money into treasuries and net the spread between say 3.5% and the maximum funding cost of 2.0%. And given the size of the ECIP capital relative to their market cap, this could be meaningful. For instance, UBAB received $124mm of ECIP capital vs its current market cap of $130mm. A 1.5% spread on the new $124m equates to an additional $1.5mm of essentially risk-free net income (i.e. earnings yield increases by 1 percentage point annually).
Taken to the other extreme, a bank could use the ECIP capital to support more deposits and lending activity. At 8x assets/equity the new capital would allow UBAB to write another $1.0bn of loans. Assuming a 3.5% spread (in-line with historical levels) and a 50% efficiency ratio on the incremental capital, this would imply $13.5mm of additional net income (i.e. earnings yield off the ECIP money alone would provide a 10% annual return to shareholders).
UBAB has historically grown its deposits in the mid-single digits, experienced low loan losses, and operated with an attractive efficiency ratio in the mid 40% range. With regards to their efficiency ratio, the company benefits from owning all of its real estate and has had a focus on cost control. Additionally, they have been active in other stimulus programs geared to CDFIs like New Markets Tax Credits. This is a capital efficient earnings stream whereby UBAB sells tax credits to a larger lender to fund a development project.
As you may imagine, these are desirable assets and it was difficult for UBAB to break-in (the government does not want to allocate tax credits to an institution that cannot find attractive projects). While UBAB applied and lost for several years, they eventually got their foot in the door and have been active ever since. This past November they received an additional $45mm allocation.
Last year UBAB initiated a repurchase program for 5% of the outstanding shares and quickly acted upon it. Going forward I anticipate they will continue repurchasing shares (within the ECIP limitations), execute on acquisitions (they completed one small acquisition in 2021 but are actively looking), and grow organically. The company ended the year at $35 or 7.7x earnings / 1.7x book value. Of note, UBAB has already marked down its available for sale securities portfolio by $46mm or 16% given the mark-to-market moves in fixed income; importantly they have not shifted any of their designated AFS securities into held to maturity to avoid these mark-to-market losses. If they were to adjust the designation (given that these securities are typically held to maturity), I would imagine the losses would be reversed.
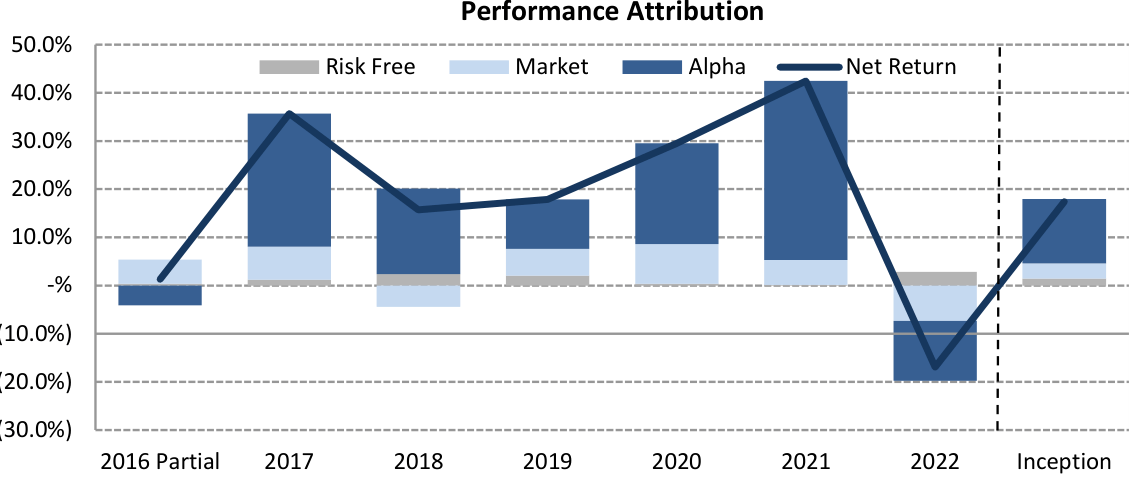
The chart below provides performance attribution of the portfolio. Over the past 6.5 years we have gained nearly 17.4% per year. 1.4% has come from the risk-free rate and 3.2% from the market (the Russell is up 8.0% during this period but our portfolio has had a beta of 0.40). The remaining 13.3% of returns have come from good stock picking.
Performance Attribution
I hope everyone has a healthy and successful 2023.
Sincerely,
Aaron Sallen
|
General Disclaimer This material does not constitute an offer or the solicitation of an offer to purchase an interest in Merion Road Small Cap Fund, LP (the “Fund”), which such offer will only be made via a confidential private placement memorandum (the “Memorandum”). An investment in the Fund is speculative and is subject to a risk of loss, including a risk of loss of principal. There is no secondary market for interests in the Fund and none is expected to develop. No assurance can be given that the Fund will achieve its objective or that an investor will receive a return of all or part of its investment. All statements herein are qualified in their entirety by reference to the Memorandum, and to the extent that this document contradicts the Memorandum, the Memorandum shall govern in all respects. This material is confidential and may not be distributed or reproduced in whole or in part without the express written consent of Merion Road Capital Management, LLC (the “Investment Manager”). The information and opinions contained in this document are for background purposes only and do not purport to be full or complete. Unless otherwise stated, the information in this document is not personalized investment advice or an investment recommendation on the part of the Investment Manager. The performance data discussed herein do not represent the performance of the Fund, but rather, represent the unaudited performance of a basket of separately managed accounts managed by the Investment Manager pursuant to the same strategy expected to be implemented for the Fund. Results generated in the Fund once outside capital is admitted could be materially different than those results shown. The results shown reflect the deduction of: (i) an annual asset management fee of 1.5%, charged quarterly; (ii) a performance allocation of 15%, taken annually, subject to a “high water mark;” and (iii) transaction fees and other expenses actually incurred. The management fee and performance allocation were applied retroactively and do not reflect actual fees charged. None of the results shown reflect the deduction of certain organizational and operating expenses common to investment funds, which would serve to decrease profits or otherwise increase losses. Results were achieved using the investment strategies described in the Memorandum. Results are compared to the performance of the Russell 2000 Index, the Russell Micro-cap Index, and the Barclay HF Index (collectively, the “Comparative Indexes”) for informational purposes only. The Fund’s investment program does not mirror any of the Comparative Indexes and the volatility of the Fund’s investment program may be materially different from the volatility of the Comparative Indexes. The securities included in the Comparative Indexes are not necessarily included in the Fund’s investment program and criteria for inclusion in the Comparative Indexes are different than criteria for investment by the Fund. The performance of the Comparative Indexes reflects the reinvestment of dividends, as appropriate. This material contains certain forward-looking statements and projections regarding market trends, investment strategy, and the future asset allocation of the Fund, including indicative guidelines regarding position limits, exposures, position sizing, diversification, and other indications regarding the Fund’s strategy. These projections and guidelines are included for illustrative purposes only, are inherently predictive, speculative, and involve risk and uncertainty because they relate to events and depend on circumstances that will occur in the future. The guidelines included herein do not reflect strict rules or limitations on the Fund’s investment program and the Fund may deviate from the guidelines described herein. There are a number of factors that could cause actual events and developments to differ materially from those expressed or implied by these forward-looking statements, projections, and guidelines, and no assurances can be given that the forward-looking statements in this document will be realized or followed, as described. These forward-looking statements will not necessarily be updated in the future. PAST PERFORMANCE IS NOT NECESSARILY INDICATIVE OF FUTURE RESULTS. |
Editor’s Note: The summary bullets for this article were chosen by Seeking Alpha editors.
Editor’s Note: This article discusses one or more securities that do not trade on a major U.S. exchange. Please be aware of the risks associated with these stocks.
Be the first to comment