


AdShooter/E+ via Getty Images
Introduction And Overview
MEG Energy (OTCPK:MEGEF) is 100% bitumen weighted oil sands producer with the entirety of its operations coming from its Christina Lake in-situ SAGD project. MEG has been known for its industry leadership in the in-situ oil sands space since its operations started in 2008 at Christina Lake. Its operations are some of the best in class when it comes to Steam-to-Oil-Ratio, GHG emission intensity, and annual decline. In the assessment below we will deconstruct MEG within two main contexts and prove why this is one of our favorite picks:
- Operational Assessment: A best in class operator with record iSOR, minimal decline, meaningful reserves and industry leading GHG track record.
- Economic Assessment: A diligent management and field team posting best-in-class OPEX, high field netbacks and poised to generate meaningful free cash flow.
MEG is a top performing Canadian oil sands operator and a clear sector outperformer. As such, we maintain a bullish outlook and recommend a strong buy.
Macro Energy Backdrop
We have previously deconstructed the case for a continuing strong crude oil market (CL1:COM) and reaffirm the strong market backdrop partly due to the evolving Russian-Ukrainian conflict.
Inflation continues to rise, and figures are now between 10%-20% YoY as reported by many of the Canadian E&P during Q1 earnings. Rising costs and inflation will continue to wear away at profits for all producers, and it will sting particularly acutely as it affects both income margin and capital costs. This in combination can have a meaningful impact to free cash flows. Most producers appear to have adjusted full year guidance to account for roughly 10% inflation for H2 2022.
What has become topical is the importance of low decline rates, established inventory and deductible tax pools. With rapidly increasing capital and labor costs, operators will likely struggle to grow production and continue to realize high profit margins. As a result, top quartile operators will be differentiated by having low decline rates and meaningful PDP reserves. Moreover, as free cash flow yields continue to soar tax considerations will become increasingly important.
MEG is incredibly well positioned given its low 12-15% decline rates, high wellhead realization and field netbacks, meaningful reserve volumes (221 MMbbl PDP, 6.5 PDP reserve life index) and US$4.2 billion in immediately deductible tax pools (US$5.4 billion total).
Given its operational leadership and current oil market backdrop, MEG is poised to standout as one of the industry’s outperformed in the coming year.
Operational Assessment
MEG Energy has long been respected as one of the top performing oil sands operators in Canada. In addition to its top-quartile operatorship, measured by its competitively low Steam-to-Oil-Ratio and illustrated below, MEG also retains the highest well head netback of any in-situ operator, a low royalty rate, meaningful 1P reserves and reserve life index, low declines and considerable tax pools. This is by no means an exhaustive list, and in the assessment below we will unpack why MEG is likely to be the top performing oil sands operator.
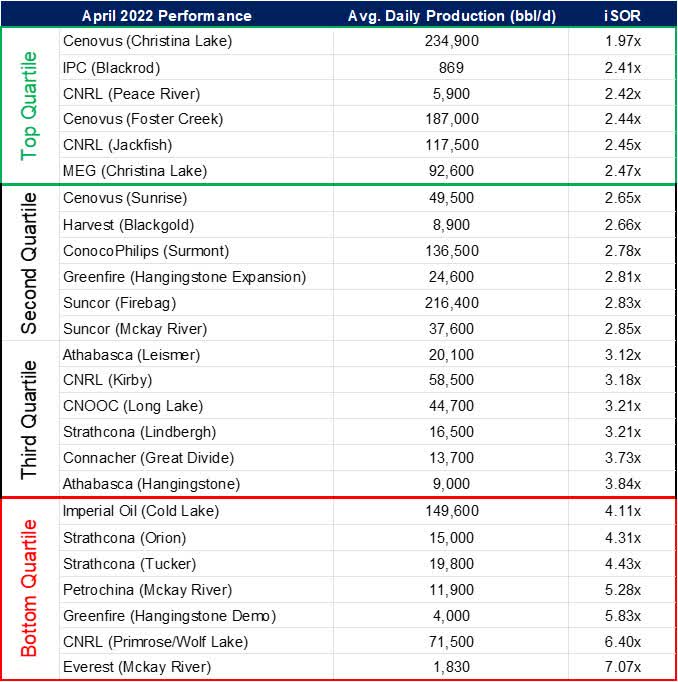
Figure 1: Summary of In-Situ Oil Sands Operator (Ranked by lowest iSOR) (Source: Oil Sands Database, AER, formatted and filtered by CER)
Production Efficiency And Optimization
MEG is currently implementing its patented eMSAGP technology and is currently testing its eMVAPEX pilot. Once a third of the oil from a well has been recovered and the reservoir has been heated to mobilization temperatures, non-condensable gas is re-injected to maintain high reservoir pressures. This has resulted in a 25% reduction in SOR from eMSAGP. In doing so, MEG has been able to establishing itself as the industry leader in terms of GHG reduction, with a 30% reduction in emissions since 2013 and ~20% below in-situ industry average. MEG is also an industry leader in its freshwater consumption intensity and NOx emission intensity. Moreover, in 2021 MEG also joined the Pathway to Net Zero initiative and is committed to net zero GHG emissions by 2050.
MEG is an industry leader in the Canadian oil sands, it has one of the lowest Steam-to-Oil-Ratio in the industry (at just 2.47x in April 2022) and has also been able to translate this operational supremacy into meaningful OPEX reductions for the business. This is partly due to its cogeneration facility on site, which now serves the dual service of not only providing power to the SAGD operations but also insulate MEG operations from increasing and volatile electricity pricing.
MEG’s operations are best in class and serve to support a strong buy recommendation.
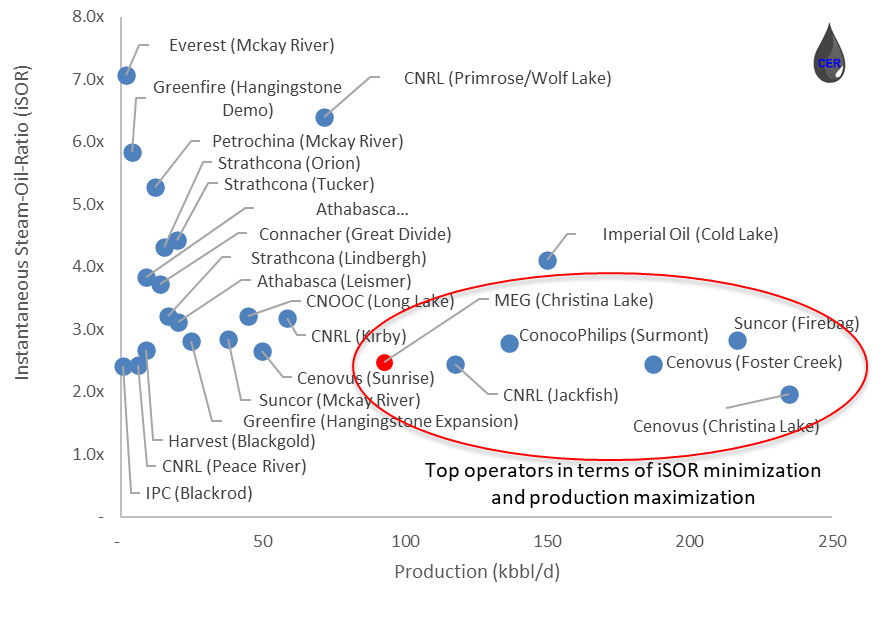
Figure 2: In-Situ Oil Sands Operator iSOR (y-axis) and Production (x-axis) (Source: Oil Sands Database, AER, formatted and filtered by CER)
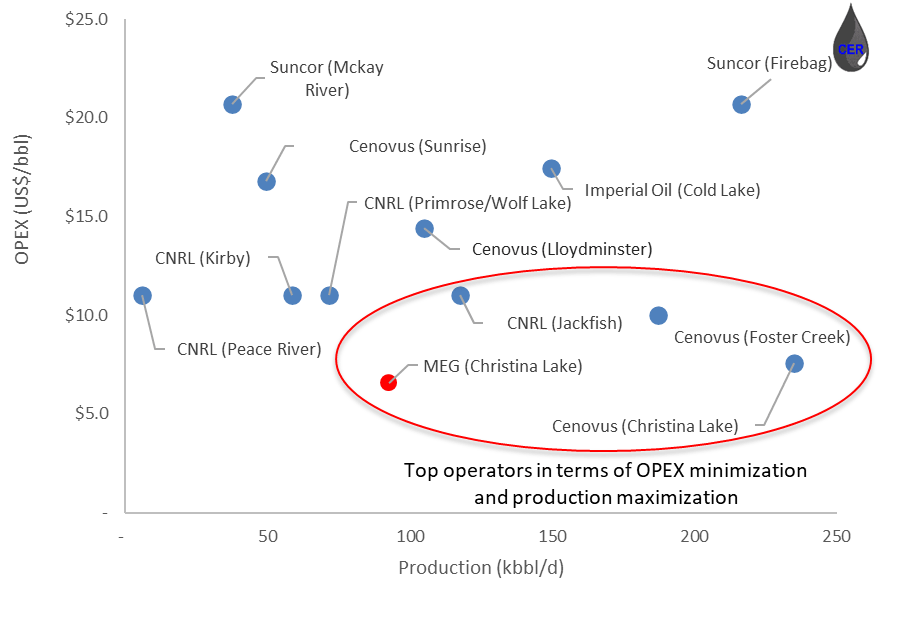
Figure 3: In-Situ Oil Sands Operator 1Q22 OPEX (y-axis) and Production (x-axis) (Source: Oil Sands Database, AER, corporate disclosure, formatted and filtered by CER)
Capital Considerations
MEG reaffirmed its 2022 guidance towards a capital program of C$375MM (US$300MM). Like its peers, MEG is not immune to inflationary pressures and is expecting labor, fuel, and chemical costs to increase 10% YoY in 2022. A critical consideration for MEG, is that its core operations at Christina Lake are pre-payout. In Alberta, royalty rates are lower for oil sands project that have not recovered their original capital investment. Royalty rates are captured on a sliding scale as illustrated in the graphs below and will increase up to 9% for project in a pre-payout phase like Christina Lake. This is meaningfully lower than other peers, such as the Cenovus’s (CVE) Foster Creek and Christina Lake projects who are both in post-payout and can be subject to royalty rates as high as 40%.
MEG is in one of the most favorable cash-retention position when it comes to a high commodity pricing environment. It remains subject to lower pre-payout royalty rates until likely 2023 and deploys a modest capital program relative to peers. This is another consideration that will manifest itself in attractive bottom-line free cash flow generation as illustrated below, and further supports a strong buy recommendation.
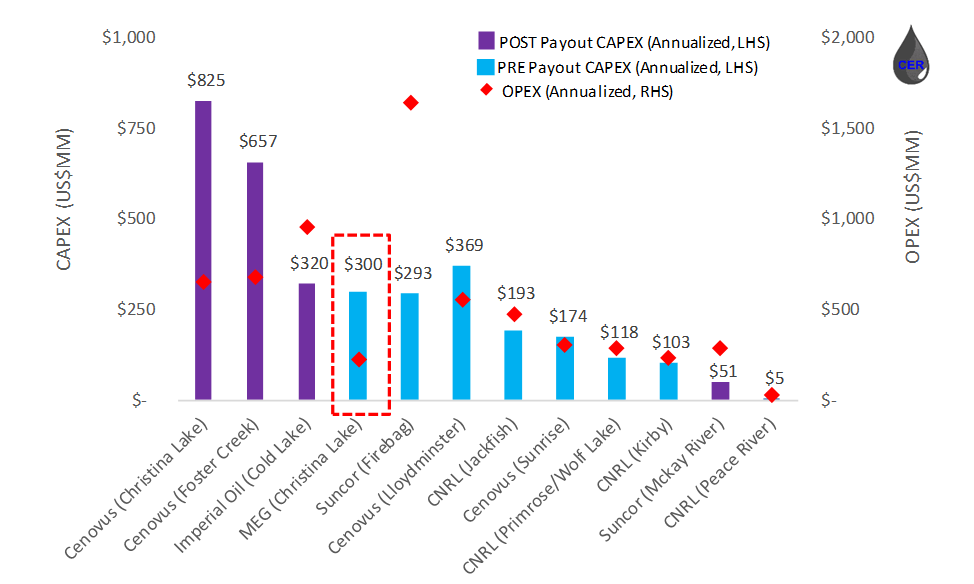
Figure 4: In-Situ Oil Sands Operator 1Q22 CAPEX (y-axis, LHS) and 1Q22 annualized OPEX (y-axis, RHS) (Source: Oil Sands Database, AER, corporate disclosure, formatted and filtered by CER)
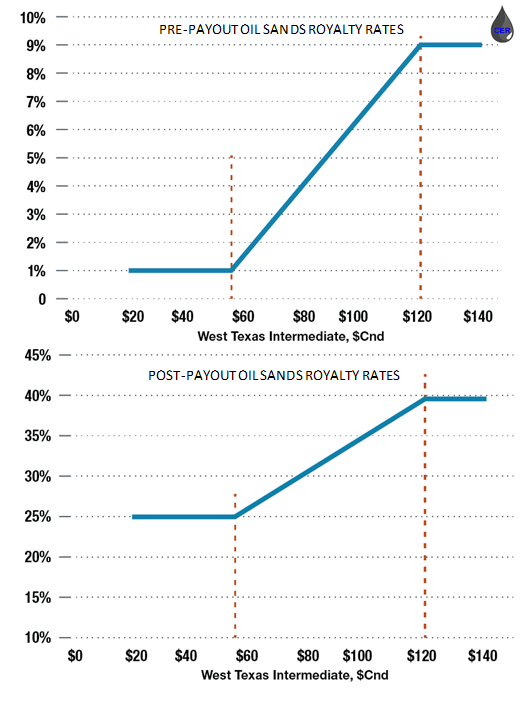
Figure 5: Alberta Oil Sands Royalty Rates (Source: Alberta Government)
Existing Activity
It is important not only to assess an operator’s current performance but its historical operations as well. MEG falls in line with peers when it comes to well utilization with roughly 16% of total wells being abandoned, shut-in, or suspended. This is a meaningful considerations as other peers such as Imperial Oil (IMO) Cold Lake, CNRL (CNQ) Primrose/Wolf Lake and Cenovus’s (CVE) Foster Creek have meaningfully lower well utilization. This will in turn translate to higher retirement obligations and operational costs for those operators.

Figure 6: In-Situ Oil Sands Well Count by Operator (Source: Oil Sands Database, AER, corporate disclosure, formatted and filtered by CER)
Reserves
Given the increasingly tighter labor, steel, and supply backdrop, operators are now faced with increasing production in an inflationary environment (and correspondingly compressing their profit margins) or allow their assets to decline and forego any potential pricing upside. It is an increasingly more difficult decision for management, but fortunately MEG is well positioned to endure supply chain and inflationary pressures. Its low decline and high wellhead realization operations will be some of the most meaningful factors differentiating MEG from its peers. More importantly, MEG also boasts impressive reserves with PDP reserves at 221 MMbbl (yielding a reserve life index of 6.5 years at current production) and 1P reserves at 970 MMbbl (yielding a reserve life index of 29 years at current production). Both in terms of its PDP and 1P RLI, MEG is one of the most attractive operators when compared to its in-situ peers. This is especially impressive, given that MEG is a company less than 15% the size of the second smallest oil sands peer, Imperial Oil (IMO), by market capitalization. A classic David and Goliath scenario, further supporting a strong buy recommendation.
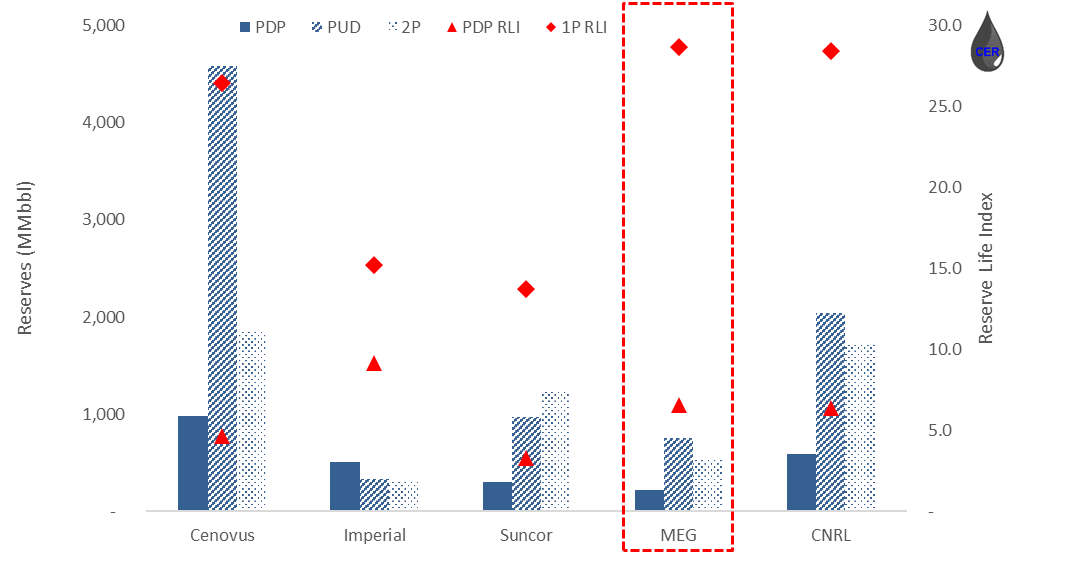
Figure 7: In-Situ Oil Sands Reserves by Operator (Source: Oil Sands Database, AER, corporate disclosure, formatted and filtered by CER)
Takeaways
MEG Energy posts top quartile operating performance as demonstrated by its incredibly low Steam-to-Oil-Ratio partly due to its implementation of its eMSAGP technology. This has translated to strong industry leadership when it comes to GHG performance and OPEX minimization for its Christina Lake asset. Moreover, MEG finds itself subject to relatively lower pre-payout royalty rates while also maintaining low decline rates and high well utilization. Finally, MEG maintains meaningful PDP and 1P reserves relative to its daily average production resulting in a high Reserve Life Index. All of which serve to support a strong buy recommendation.
Economic Assessment
In the following sections, we consider MEG’s latest earnings, breakdown its intrinsic valuation, and compare its various multiples to oil weighted peers.
Earning Results and Shareholder Returns
MEG’s achieved record production of 101,128 bbl/d in the first quarter, which translated to record free cash flow generation of US$400 million while also reducing net debt by US$175 million. The company updated 2022 guidance to target 95,500 bbl/d production and a US$300 million capital program. MEG shared its framework for capital return to shareholder including attributing 25% of free cash flow towards a share repurchase plan after achieving a net debt target of US$1.7 billion, increasing this attribution to 50% of free cash flow after achieving a net debt target of US$1.2 billion, and increasing this to 100% after achieving its net debt floor of US$600 million. In March, MEG was given approval to repurchase 27.2 million shares (~10% of public float) over a one-year period. At its current production and at WTI$100/bbl WCS diff. $14/bbl, and no WTI or WCS differential hedges in place for 2022, MEG is on track to generate US$1.6 billion. Given MEG’s priority is deleveraging its balance sheet, it is likely that MEG will repurchase between US$200 – US$300 million of its shares over the remainder of the year and achieve its debt floor target in Q1 2023. This is meaningful share appreciation for shareholders, with the potential of even further upside in 2023.
Realization
A key competitive advantage of MEG is its operating field netback compared to other in-situ oil sands operations. Although it does not realize the highest gross wellhead price as some of its peers like Cenovus’s (CVE) Sunrise and Christina Lake, or Suncor’s (SU) Firebag and McKay River operations it has the highest relative field netback of any operator. This is a testament to MEG’s operational prowess due to its eMSAGP technology, cogeneration facility, and low decline asset. Compared to other oil sands operators this manifests into MEG having the highest free cash flow of any peer as illustrated below.
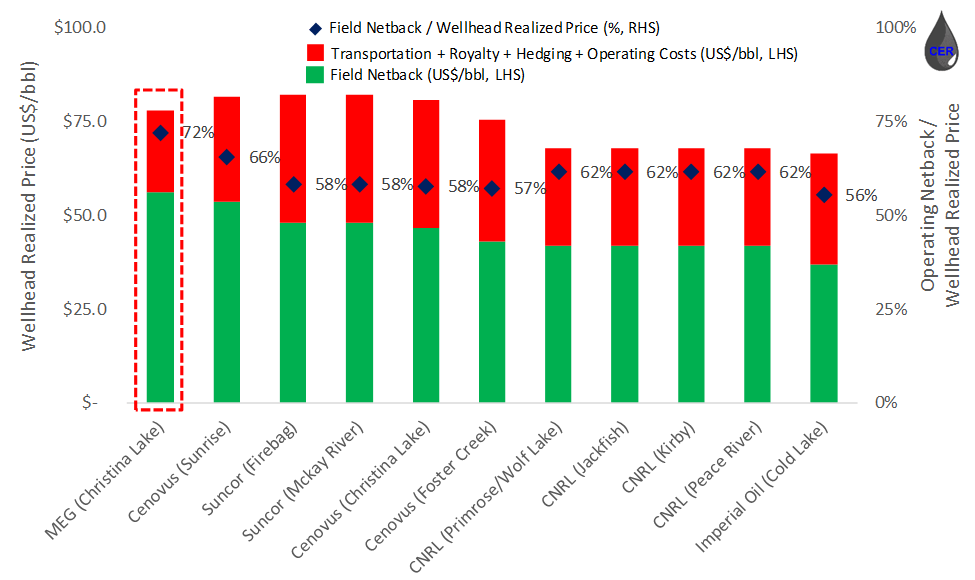
Figure 8: In-Situ Oil Sands Realizations by Operator (Source: Oil Sands Database, AER, corporate disclosure, formatted and filtered by CER)
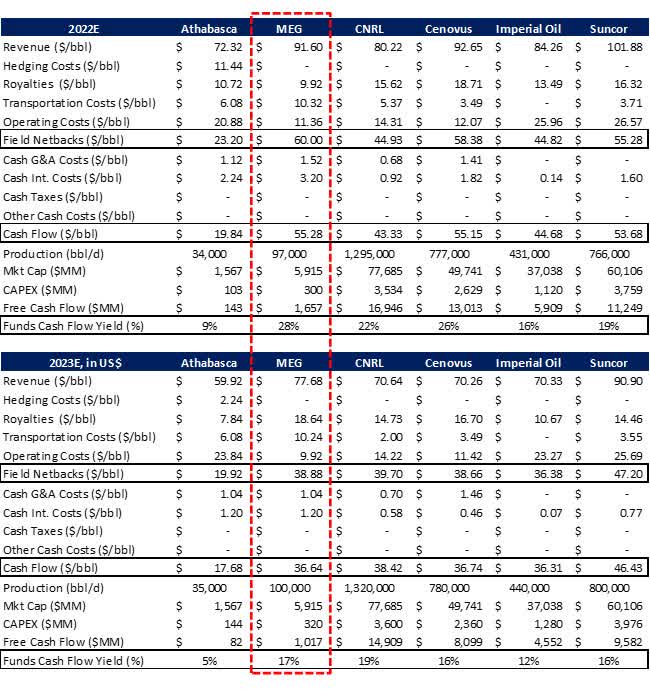
Figure 9: Free Cash Flow Yield for MEG Energy and Comparable Oil Sand In-Situ Operators (Source: Corporate disclosure, formatted and filtered by CER)
MEG transports and sells thermal oil known as the Access Western Blend “AWB” which is composed of bitumen produced at Christina Lake blended with purchased diluent. The bitumen realization per barrel fluctuates primarily based on WTI benchmark pricing and WCS differentials. In its Q1 2022 earnings report, MEG noted that gross (pre-payout) royalty rates have increased from 2% in 2021 to 7% in 2022, and as illustrated above can increase up to a maximum of 9% as long as the Christina Lake project remains categorized as Pre-Payout. The royalty rate will likely increase in 2023 as the project transitions to a Post-Payout status. We have assumed transportation costs to remain roughly in line with previous years but have added a 10% premium to operating costs compared to prior years to account for inflationary pressures. Another notable advantage is that MEG has no hedging in place, which would otherwise be a drag on the company’s bottom line. Discounting future free cash flow at a 10% discount rate yields an intrinsic value of C$24/share, implying a 20% upside from current prices.
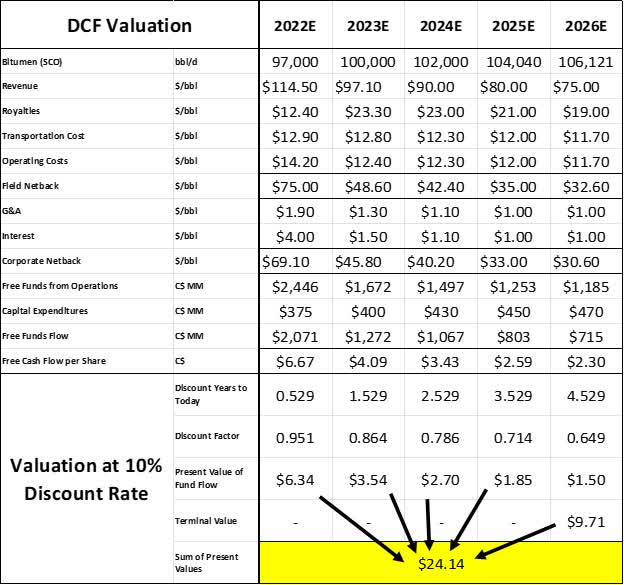
Figure 10: MEG Energy Intrinsic Valuation (Source: Corporate disclosure, formatted and filtered by CER)
Relative Valuation
Compared to other in-situ peers, MEG appears attractive on many relative valuation metrics. Some of the metrics that stick out are EV/EBITDA and Net Debt/EBITDA. Compared to peers, MEG has relatively higher leverage which partly why management is targeting debt reduction as its focus for 2022. In the current high pricing environment, however, this may be perceived as a positive as this will result in high cash flow torque relative to peers.
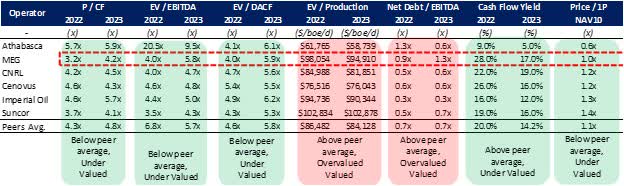
Figure 11: Valuation Multiples for MEG Energy and Comparable Oil Sand In-Situ Operators (Source: Corporate disclosure, formatted and filtered by CER)
Conclusion
MEG Energy is a clear outperformer compared to other oil and gas peers. MEG has proven its ability to remain a top quartile performer when it comes to iSOR and built on this to achieve industry leadership in terms of in-situ OPEX minimization, GHG and emissions performance, and field netback realizations. Given the high pricing environment, MEG is poised to generate meaningful free cash flow and deleverage its balance sheet and is unlikely to be as affected from inflationary pressures due to its low decline production and meaningful reserve volumes. In terms of intrinsic and relative valuations MEG appears incredibly attractive with an implied 20% upside from current pricing on top of management’s guidance of a 5-10% share value appreciation from its proposed buyback program. As a result we anticipate meaningful upside from MEG energy and recommend a strong buy.
Be the first to comment