

BrianAJackson
Thesis
If you are reading this, you must already know about the problems Medical Properties Trust (NYSE:MPW) is facing. Mostly, in addition to occupancy rates, staffing pressures, personnel costs, and disposal of assets, one of its tenants, Pipeline Health, also filed for chapter 11 bankruptcy a few days ago. The multitude of negative news triggered heavy selling as you can see from the following chart. To wit, the stock price plunged so much that now its dividend yield hovers close to 11%. It is not only the highest level in the past decade but also almost 2x higher than its long-term average of 6.24% as seen. When yields spike as rapidly as this, it usually means that the market expects a dividend cut imminently.
As the bottom panel of the chart shows, MPW’s cash payout ratios have been normal so far. Actually, it is near the safest level in a decade. Its current cash payout ratio is about 57%, compared to its long-term average of 119%. When compared to a similar peer, Omega Healthcare (NYSE:OHI), the dividend coverage is in even better shape. OHI’s current payout ratio is 119% and the long-term average is 142%.
So, the market must be expecting its future earnings to decline drastically (for example, due to the impact of the Pipeline Health bankruptcy and also its disposal of 3 hospitals) to a point that it cannot cover its dividend.
And this is what the remainder of this article will focus on. We will perform a holistic assessment of its pro forma dividend coverage with the above changes included. My results show that its current dividends are still quite safe. And you will further see the safety accentuated when compared to OHI.
Source: Seeking Alpha data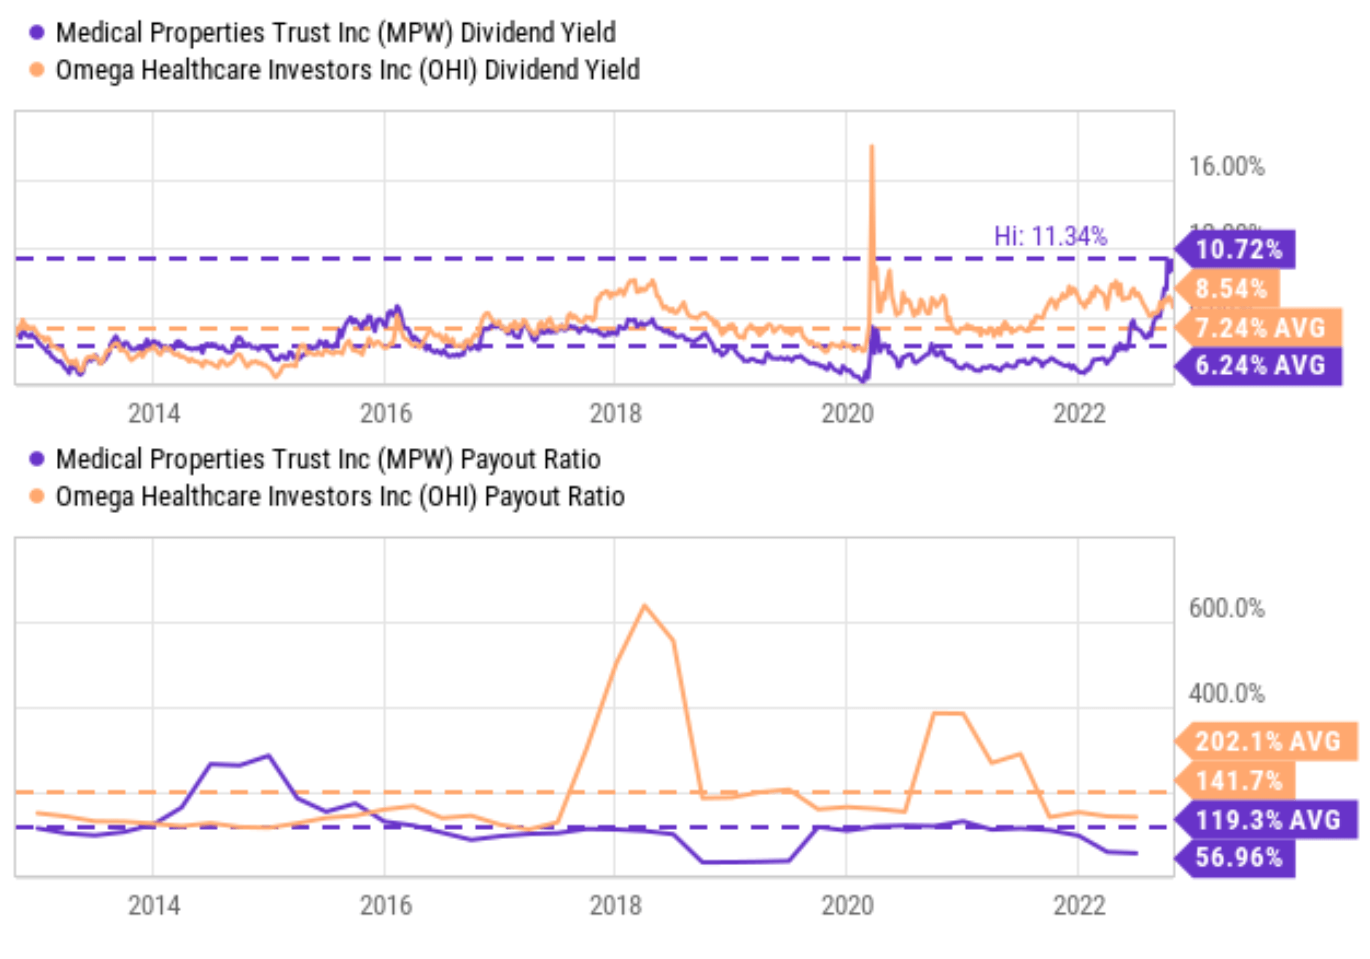
MPW vs OHI: Profitability and dividend safety
In my view, both MPW and OHI’s dividends are both supported by healthy profitability. And furthermore, as shown in the chart below, MPW enjoys even superior profitability over OHI the way I see it. MPW’s metrics are pretty superior across the board. Its gross margin of 97.29% is exactly 600 bps above OHI’s 91.29%, its EBIT margin is above OHI by about 16%, and its net income margin of 72.8% is 1.65x higher than OHI’s 44%.
Source: Seeking Alpha data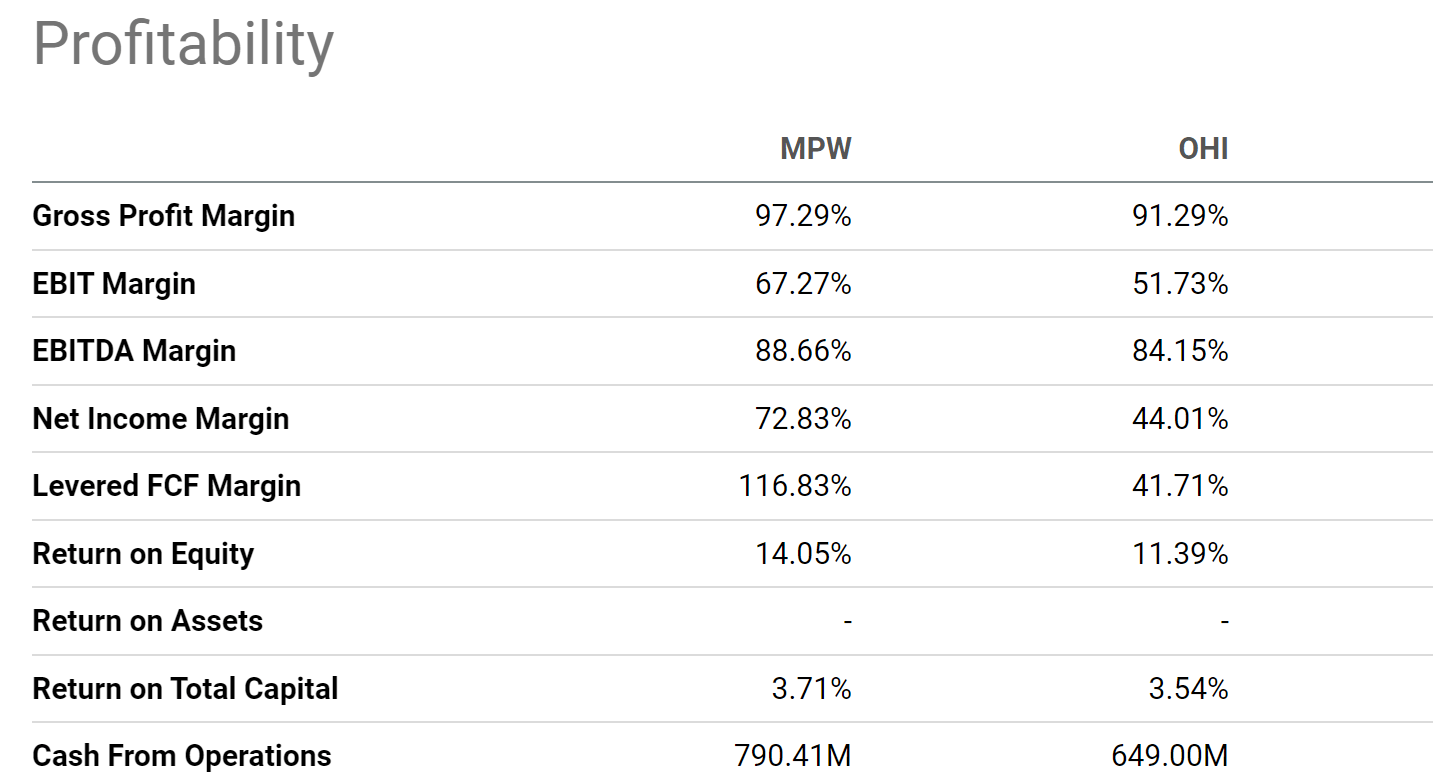
Besides the above snapshot, the next chart compares their return on equity (“ROE”) over the past 10 years to gain a broader historical perspective. As seen, the ROE for MPW is about 14% currently. Its ROE has fluctuated in the past 10 years between 4.5% and 10.0% most of the time, with an average of 9.36%. Therefore, its current ROE is not only far above its long-term average but also near a peak level in a decade. Similarly, OHI’s ROE has also fluctuated in the past 10 years between about 4.5% and 10.0% most of the time. And its average is 9.56%, essentially identical to MPW, another indicator of the comparability of these two stocks.
However, two observations are noteworthy:
- First, despite similar long-term averages, MPW’s current ROE compares favorably against OHI. As seen, the ROE for OHI is about 11.5% currently, lower than MPW by about 250 basis points.
- Second, the spread between dividend yield and ROE is wider for MPW than OHI, suggesting overall more conservative dividend management for MPW. More specifically, MPW’s average ROE of 9.36% is about 50% higher in relative terms than its average dividend yield of 6.24% if you recall from an earlier chart. And OHI’s average ROE of 9.56% is 32% higher than its average dividend yield of 7.24%, still a healthy spread, but not as thick as MPW.
Source: Author based on Seeking Alpha data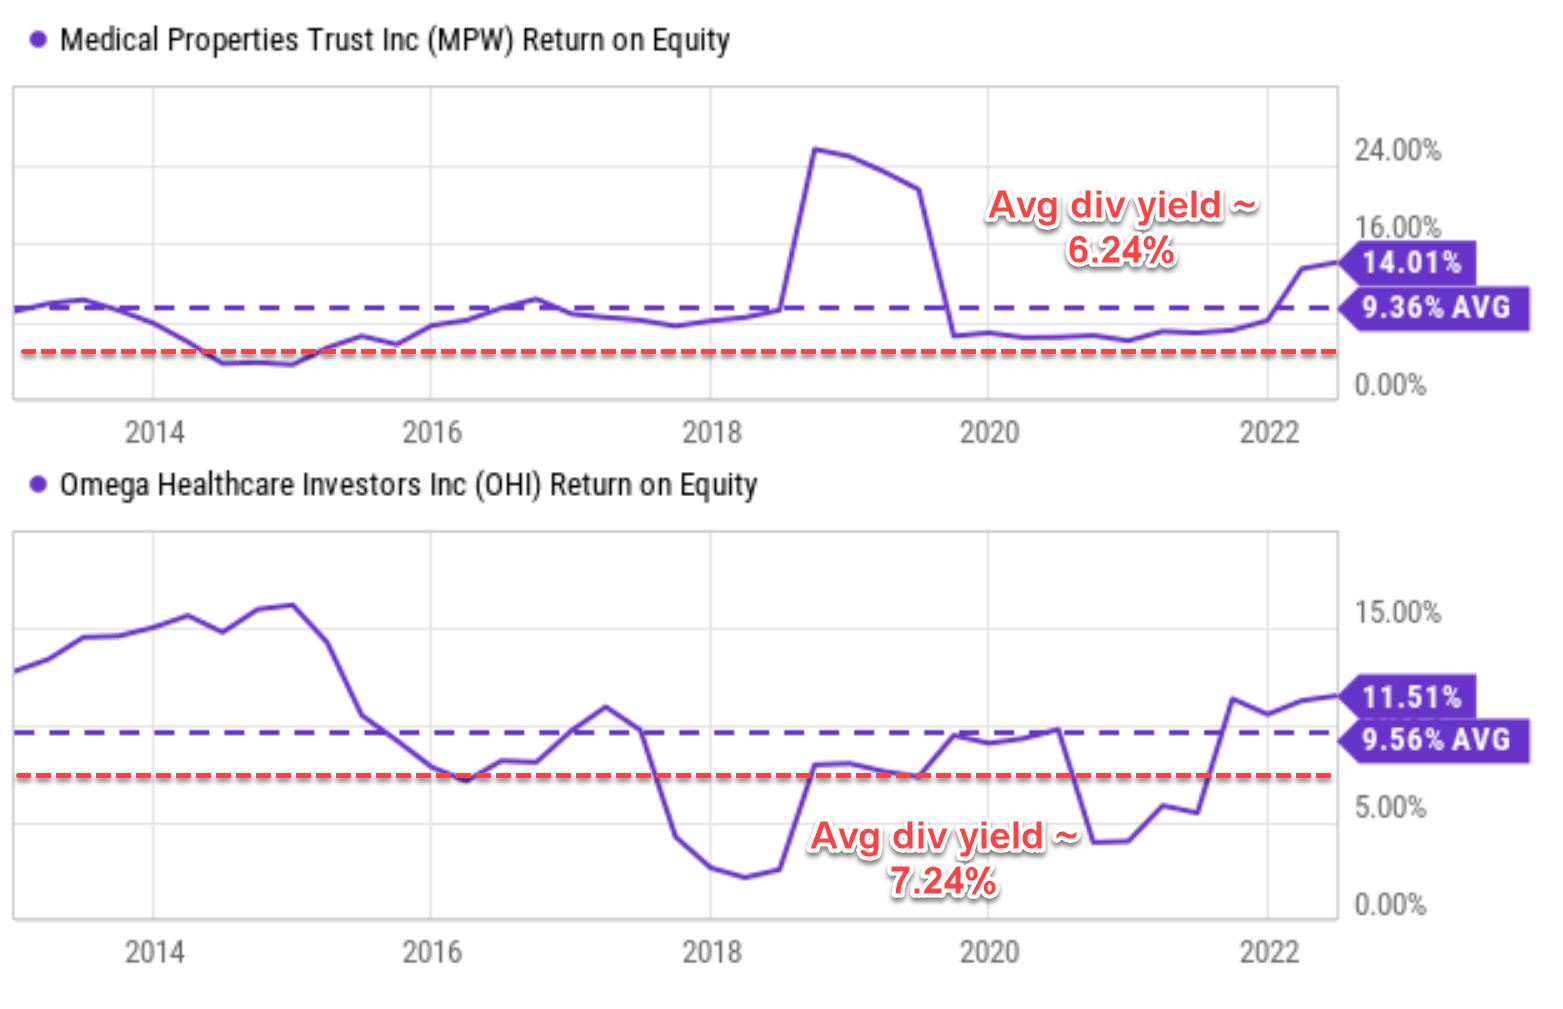
MPW vs OHI: Dividend cushion ratios
Next, let’s analyze the pro forma dividend coverage considering MPW’s ongoing uncertainties. Here I will go a step further for a more comprehensive assessment than the simple payout ratios quoted above. As detailed in my earlier article here, the simple payout ratios are limited in several ways:
- The simple payout ratio ignores the current asset. Obviously, for two firms otherwise identical, the one with more cash on its balance sheet should have a higher level of dividend safety.
- The simple payout ratio also ignores the upcoming financial obligations. Again, obviously, for two firms otherwise identical, the one with lower obligations (debt, CAPEX expenses, et al) should have a higher level of dividend safety.
We find the dividend cushion ratio an effective tool to address the above issues. A detailed description can be found in Brian M Nelson’s book entitled Value Trap. And a summary is quoted below:
The Dividend Cushion measure is a ratio that sums the existing net cash (total cash less total long-term debt) a company has on hand (on its balance sheet) plus its expected future free cash flows (cash from operations less all capital expenditures) over the next five years and divides that sum by future expected cash dividends (including expected growth in them, where applicable) over the same time period. If the ratio is significantly above 1, the company generally has sufficient financial capacity to pay out its expected future dividends, by our estimates. The higher the ratio, the better, all else equal.
We made one revision to the above method here. Instead of subtracting the total long-term debt, we subtracted the total interest expenses over a past five-year period. This revision is to adjust for the mature businesses like MPW and OHI. Such mature businesses probably will never have the need to repay all the debt at once. But it does need to service its debt.
With this background, the historical and pro forma dividend cushion ratios for MPW and OHI are calculated and shown below. MPW has been maintaining an average dividend cushion ratio of 1.79x in the past, significantly above OHI’s 1.02x (which is again, a healthy ratio by itself). Using their 2022 TTM financials, MPW’s cushion ratio currently stands at 1.54x and OHI at 0.95x. Admittedly, these cushion ratios are weaker than their historical averages, reflecting their recent troubles with occupancy rates, interest rate hikes, rising debt, staffing pressure, and cost control (and that is why I like the cushion ratio better – it captures their financials holistically). However, under the overall scheme of things, a cushion ratio of 1.54x and 0.95x are still healthy.
More importantly, the pro forma cushion ratio for MPW is projected to be 1.43x. It is lower than the current level of 1.54x because of the anticipated issues. But again, it is still at a quite healthy level. The pro forma analysis is based on the following assumptions:
- The proceeds from sales of the 3 hospitals (anticipated to be $457 million) will be used to pay down its standing debt.
- The disposal of these 3 hospitals will reduce its rent income by $35 million per year, consistent with the historical average. MPW purchased these properties about 3 years ago and has earned a total of ~$100 million of rent since then.
- The impact of the Pipeline Health bankruptcy is harder to pin down precisely, and a lot depends on how the bankruptcy process proceeds. Although on an overall level, I expect the impacts to be minimal, at least for the sake of dividend safety. Pipeline Health is not a large tenant for MPW to start with.
Source: Author based on Seeking Alpha data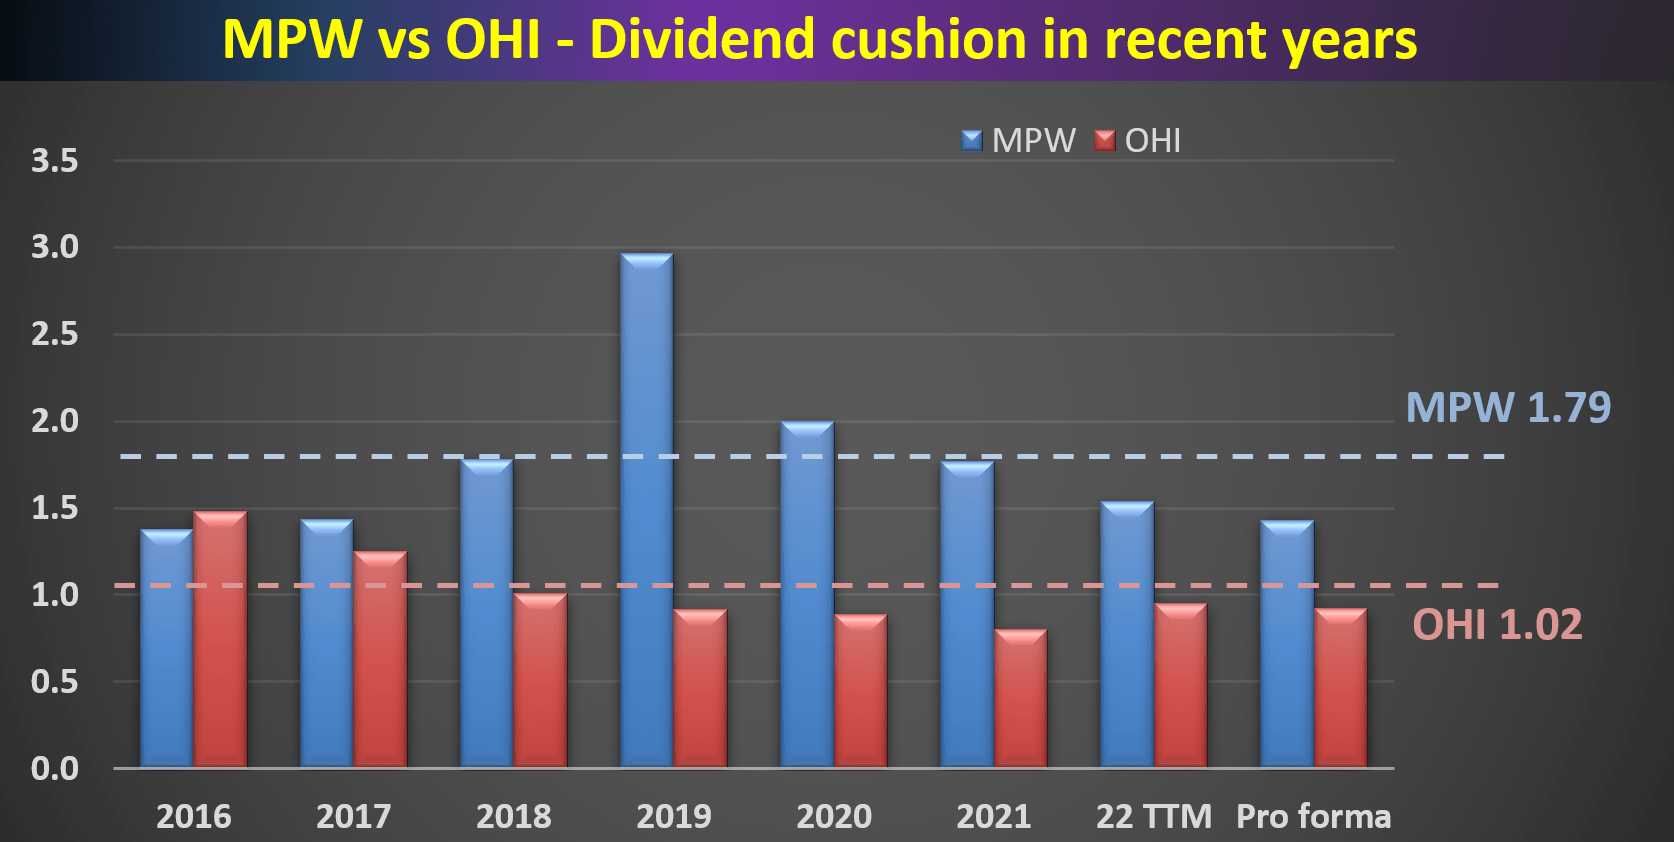
Risks and Conclusion
To recap, both OHI and MPW face many risks that are common to the medical REIT sector, such as occupancy rates, staffing pressures, personnel costs, and rising interest rates. On top of these risks, MPW also faces a few additional issues including the disposal of 3 of its hospital assets and the chapter 11 filing of one of its tenants (Pipeline Health).
However, my overall impression is that the risks are overblown, especially in the case of MPW. Both stocks are now at a heavy discount, both in relative and absolute terms. OHI is trading for only 11.2x TTM cash flow as you can see from the following chart. In terms of dividend yields, it’s currently yielding 8.54%, about 18% above its historical average, signaling a large discount. MPW is now priced at only 7.87x of its TTM cash flow, a whopping 30% discount from OHI. Admittedly, MPW is more highly leveraged and deserves some discount. However, when the leverage is adjusted, MPW’s EV/EBITDA multiple is about 10.9x (on an FW basis), still about 20% discounted from OHI’s 13.4x.
To conclude, I see a very low possibility for dividend cuts for either stock given their healthy cushion ratios. Especially for MPW, its dividend safety is even better than OHI. And I further see that the risks associated with MPW have been more than priced in already.
Source: Seeking Alpha data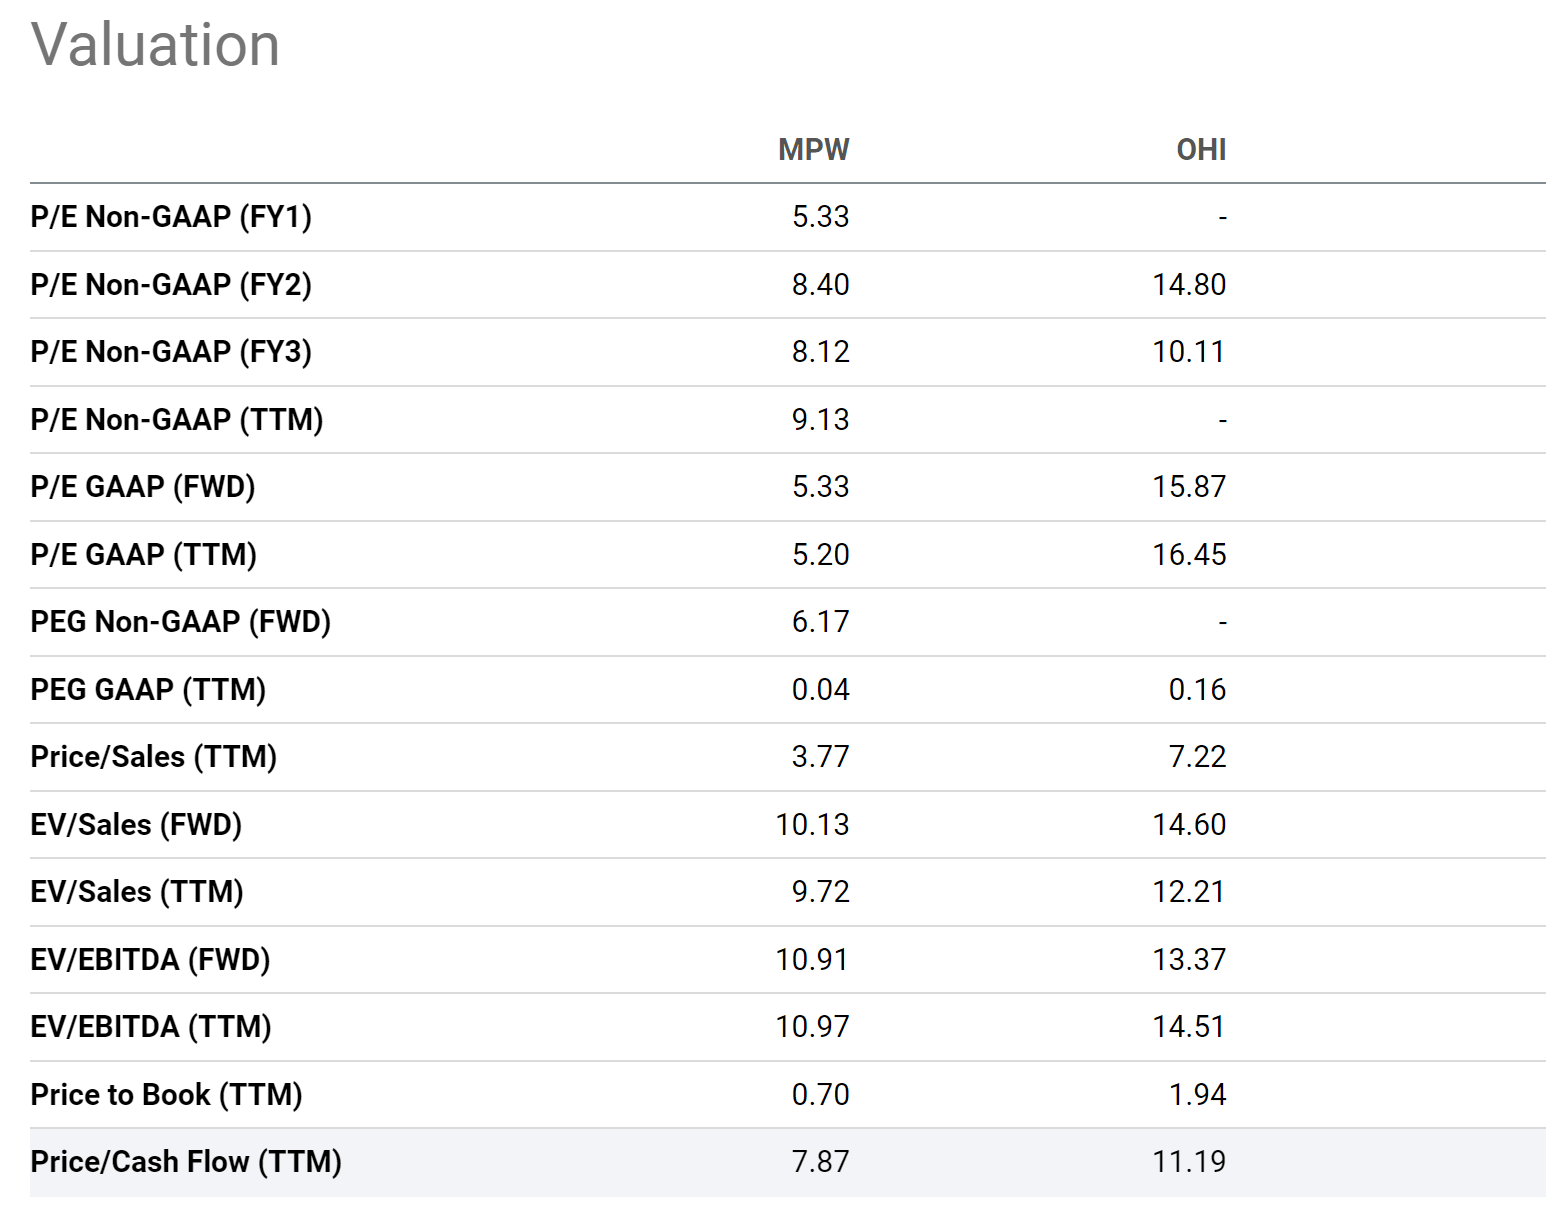
Be the first to comment