

Oat_Phawat
Introduction
The Toronto-based McEwen Mining (NYSE:MUX) released its first-quarter 2022 results on March 1, 2022. On March 10, 2022, the company provided 2022 guidance.
Note: This article is an update of my article published on March 31, 2022. I have followed MUC on Seeking Alpha since July 2021.
Also, I will be using the most recent presentation published in July 2022.
1 – 1Q22 Results Snapshot
McEwen Mining counts four producing mines and five development Projects.
MUX Assets location presentation (McEwen Mining)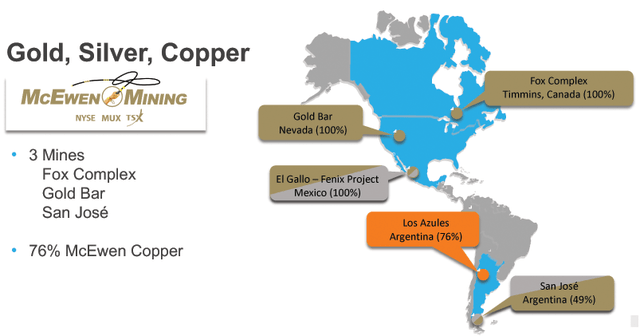
McEwen Mining came out with a first-quarter loss of $19.33 million or $0.04 per diluted share compared to a loss of $12.47 million 0r $0.03 per share in 1Q21. The net loss included $14.4 million invested in exploration and advancing the Los Azules project.
Revenues were $25.54 million, up from $23.74 million in 1Q21 but down 27% sequentially. However, generic free cash flow from operations was a loss of $19.67 million.
MUX Quarterly production comparison 1Q21 versus 1Q22 (Fun Trading)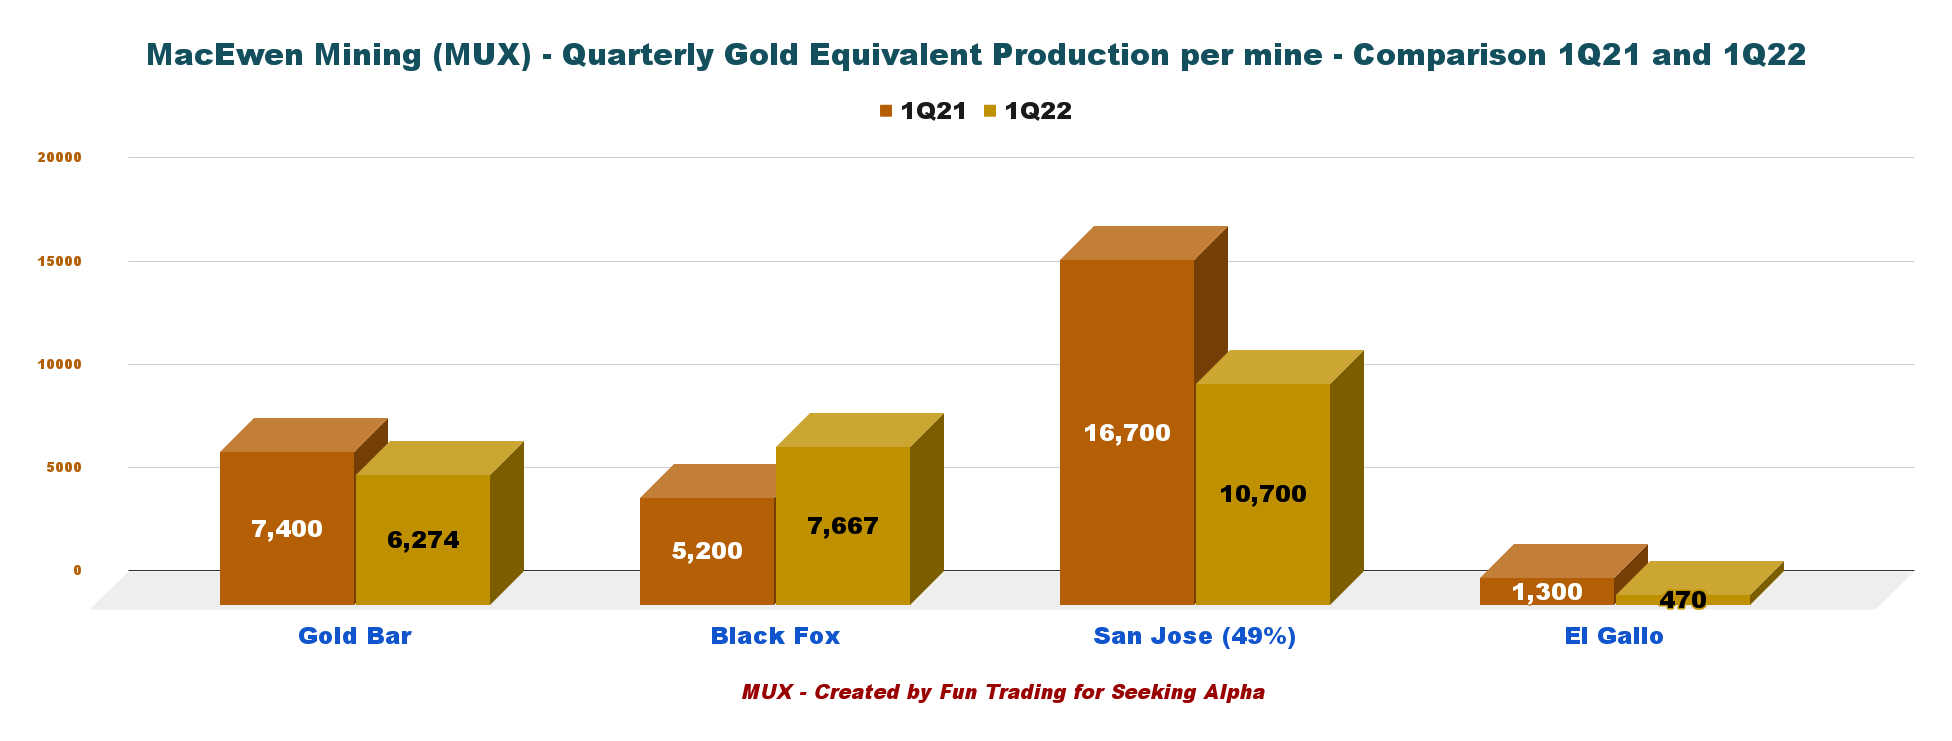
We encountered a cash squeeze during Q1 as a result of our revenue shortfall. Then, however, I feel confident enough that the future value — in the future value of the company to personally step up and provide the company with $15 million.
2 – Investment Thesis
McEwen Mining is struggling right now, and looking at the stock as a trading tool is essential. However, I see some great potential down the road, but the balance sheet is not encouraging, with a free cash flow recurring loss and dismal AISC.
CEO Rob McEwen admitted in the conference call that the company experienced a cash squeeze in the first quarter with a weak gold equivalent production.
However, one crucial issue is that the company has been forced to declare a 1 for 10 reverse split to stay listed on the NYSE. The reverse split 1:10 will be effective starting Tuesday, July 26, 2022.
Thus, It is prudent to trade short-term the stock here and keep only a tiny core position long-term.
3 – Stock Performance
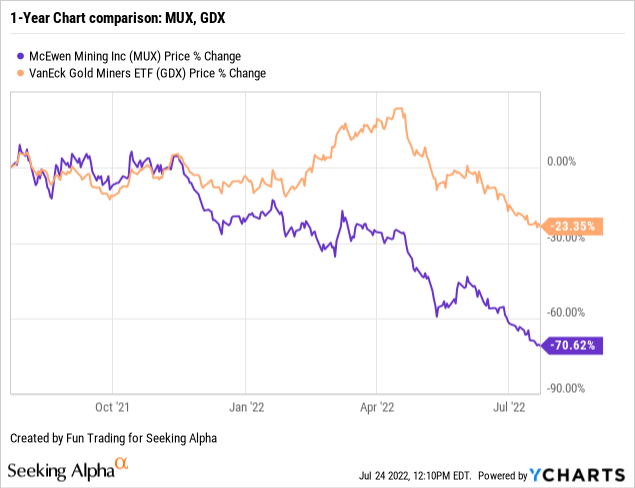
MUX is down 71% after a long slide that started around November 2021. MUX has significantly underperformed the VanEck Gold miners (GDX).
CEO Robert McEwen said in the conference call:
This year, our results have been mixed. The Fox Complex started strong and then was slowed down by manpower shortages induced by COVID and that was followed by an equipment failure in the mill. But despite these issues, Fox produced more gold at lower cost than it did in the first quarter of 2020.
MUX – Financial Snapshot 1Q22: The Raw Numbers
Note: Numbers are indicated in US$.
| MUX | 1Q21 | 2Q21 | 3Q21 | 4Q21 | 1Q22 |
| Total Revenues $ million | 23.74 | 40.71 | 37.13 | 34.97 | 25.54 |
| Quarterly Earnings $ million | -12.47 | -5.99 | -17.40 | -20.86 | -19.33 |
| EBITDA $ million | -9.31 | 0.19 | -10.77 | -12.56 | -16.63 |
| EPS (diluted) $ Per Share | -0.03 | -0.01 | -0.04 | -0.04 | -0.04 |
| Operating Cash Flow $ million | -10.14 | 2.07 | -11.00 | -1.15 | -15.62 |
| CapEx in $ | 10.09 | 10.29 | 8.11 | 6.41 | 4.05 |
| Free Cash Flow | -20.23 | -8.22 | -19.11 | -7.55 | -19.67 |
| Total Cash in $ million | 47.40 | 44.01 | 64.94 | 56.09 | 66.21 |
| Total LT Debt in $ million | 48.33 | 48.50 | 46.68 | 48.87 | 63.55 |
| Shares Outstanding (diluted) | 441cash | 459.19 | 459.19 | 459.24 | 464.02* |
| Gold and Silver Production | 1Q21 | 2Q21 | 3Q21 | 4Q21 | 1Q22 |
| Quarterly Gold Equivalent Oz GEOs | 30,600 | 40,800 | 42,860 | 40,150 | 25,170 |
| Quarterly Au Production Oz | 23,300 | 31,700 | 32,100 | 31,300 | 20,850 |
| Quarterly Silver production Oz | 493,200 | 611,800 | 792,000 | 682,700 | 336.500 |
Source: Company release 10Q filing
*Post split, the shares outstanding diluted will be 46.4 million shares.
McEwen Mining – Gold Production and Balance Sheet Details
1 – Revenues and Trends. Revenues were $25.54 million in 1Q22.
MUX Quarterly revenues history (Fun Trading) The first-quarter revenues were $25.54 million, up from $23.74 million in the same quarter a year ago. Net loss was $19.33 million or $0.04 per diluted share, of which $9.8 million was related to the Los Azules project expenditures and $3.8 million on the continued exploration at Canadian and US operating sites. Cash from operations was a loss of $15.62 million.
2 – Free cash flow was a loss of $19.67 million in 1Q22.
MUX Quarterly Free cash flow history (Fun Trading) Note: Generic free cash flow is the cash from operations minus CapEx. It may differ from the company calculation.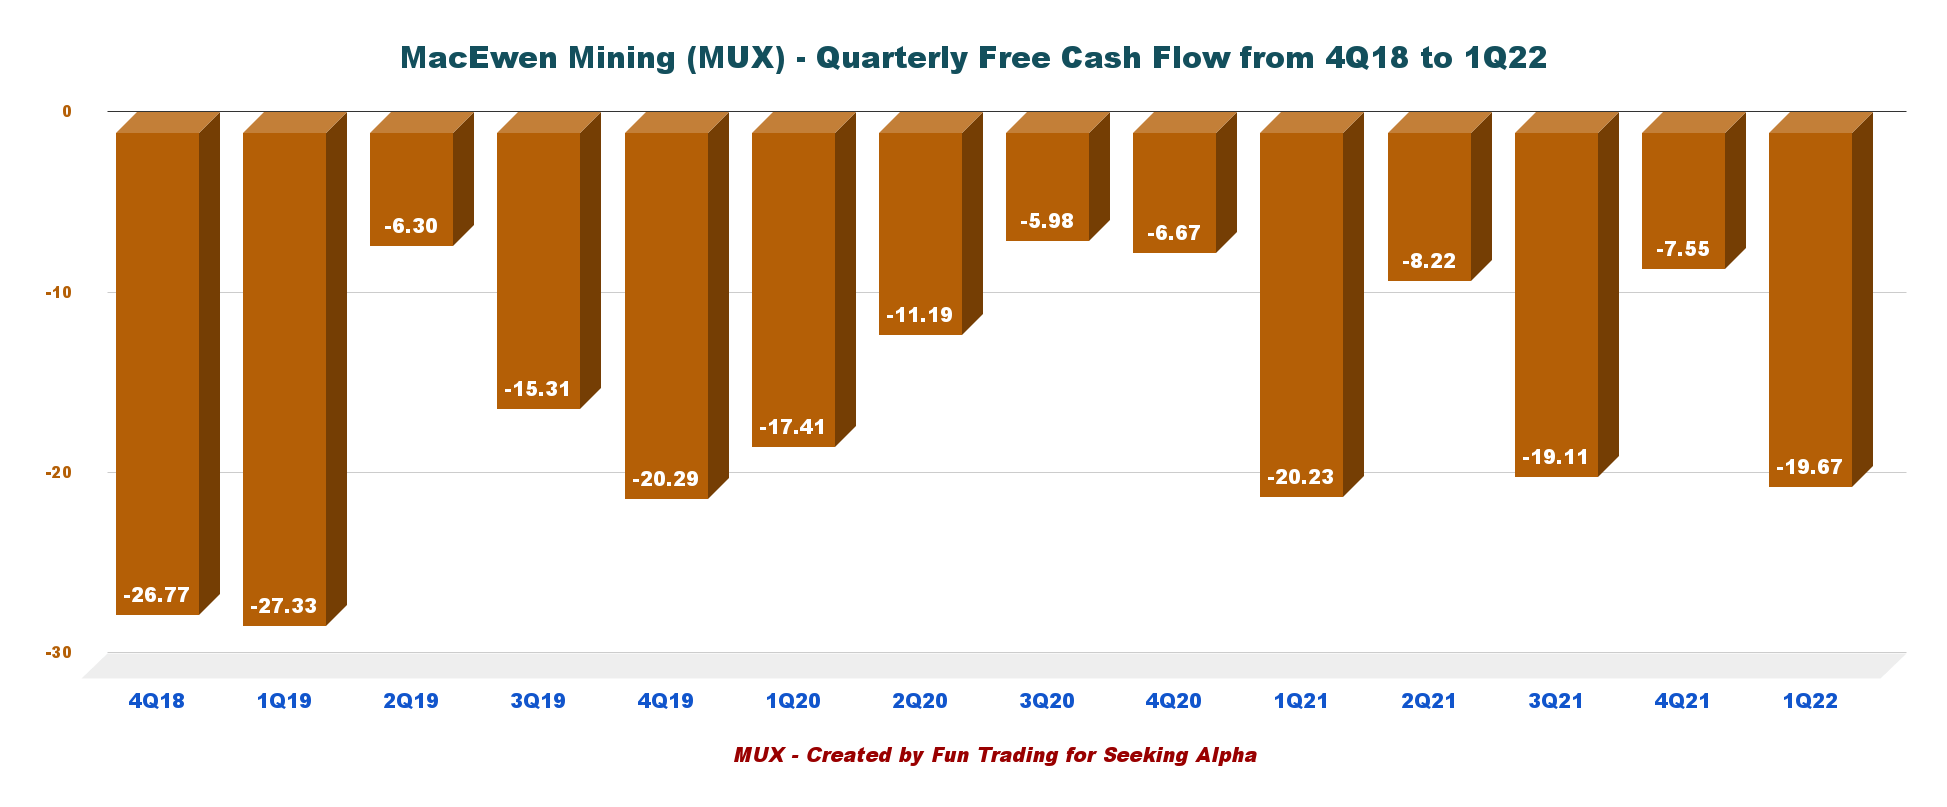
Trailing 12-month free cash flow ttm was a loss of $54.55 million, and the free cash flow for the first quarter was a loss of $19.67 million.
3 – Debt situation
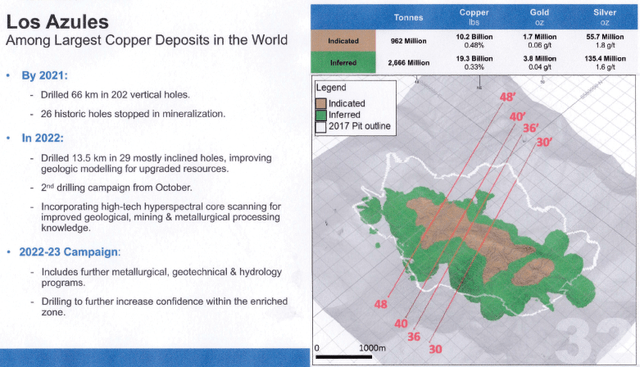
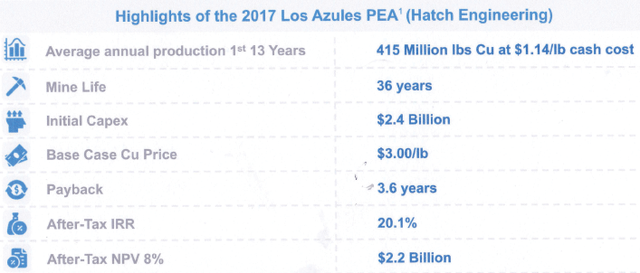
MUX Quarterly Cash versus Debt (Fun Trading) The total cash (including investment of $1.806 million, but not the precious metal owned of about $1.018 million) was $56.09 million at the end of December 2021. Long-term debt is $48.87 million. From the 10Q: The increase in cash and cash equivalents and restricted cash balance during the three months ended March 31, 2022, was driven by the cash provided from financing activities totaling of $29.5 million, partially offset by $15.6 million used in operating activities and $4.0 million used in investing activities. $35.6 million of the current cash balance is attributable to McEwen Copper to advance the Los Azules Copper project. The Los Azules project (76% owned by MUX) has been the main focus of the company: MUX Los Azules Project (McEwen Mining Presentation) It is an excellent copper project but with an initial CapEx of $2.4 billion that could go much higher with the recent inflationary pressure. MUX PEA Los Azules (McEwen Mining)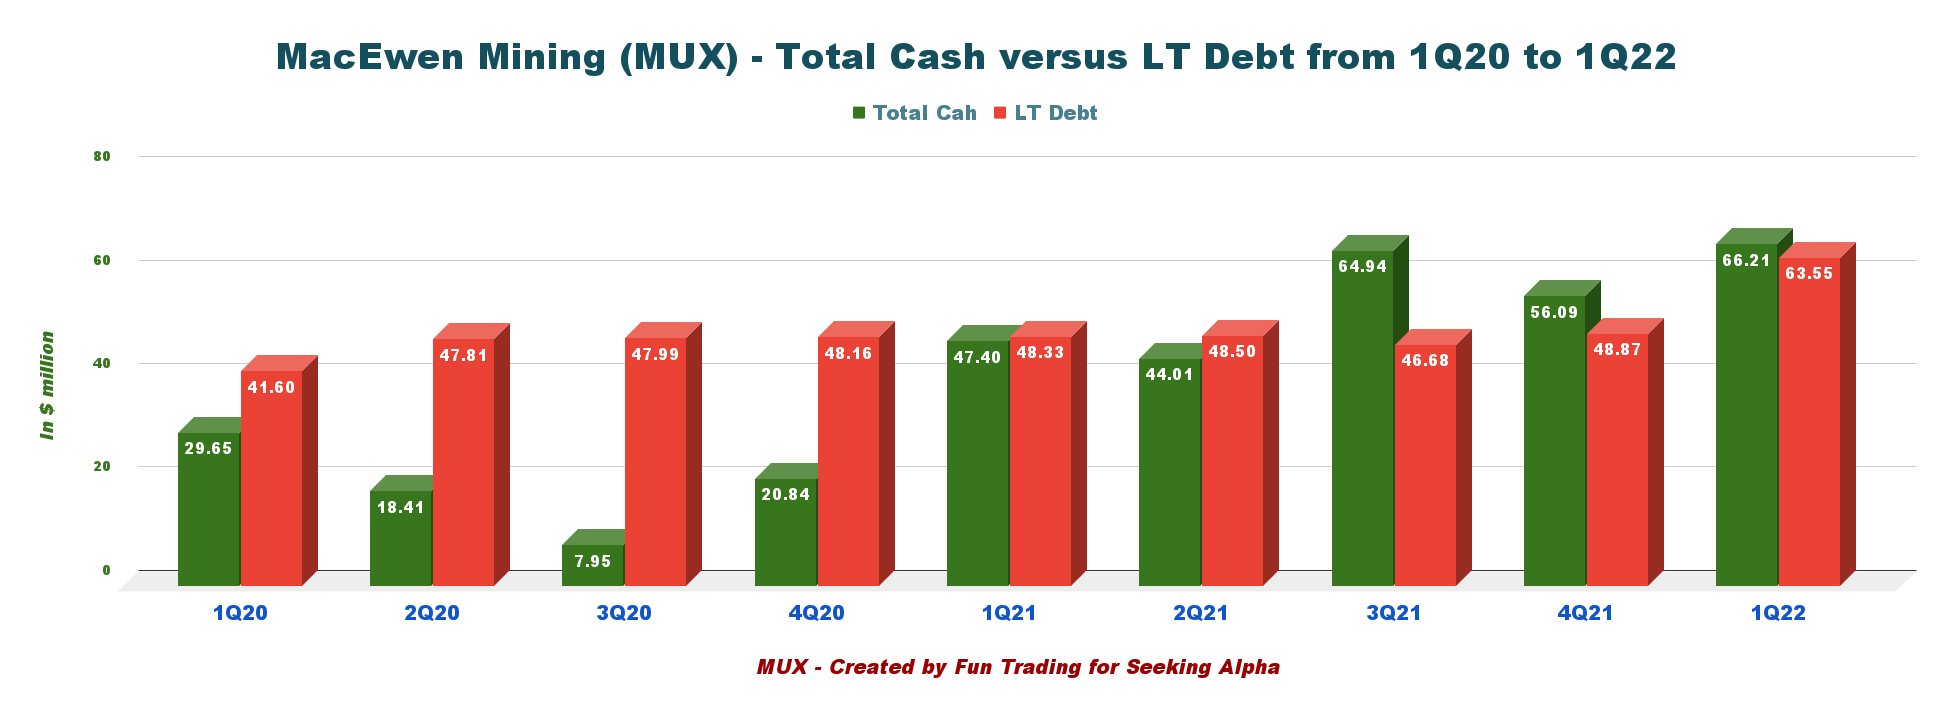
4 – Gold Equivalent production details. The company produced 25,111 GEOs in 1Q22.
4.1 – Production in GEOs
MUX Quarterly GEO Production history (Fun Trading) Gold Equivalent production was 25,111 Au Eq. Oz, down significantly from 30,600 Au Eq. Oz in 1Q21.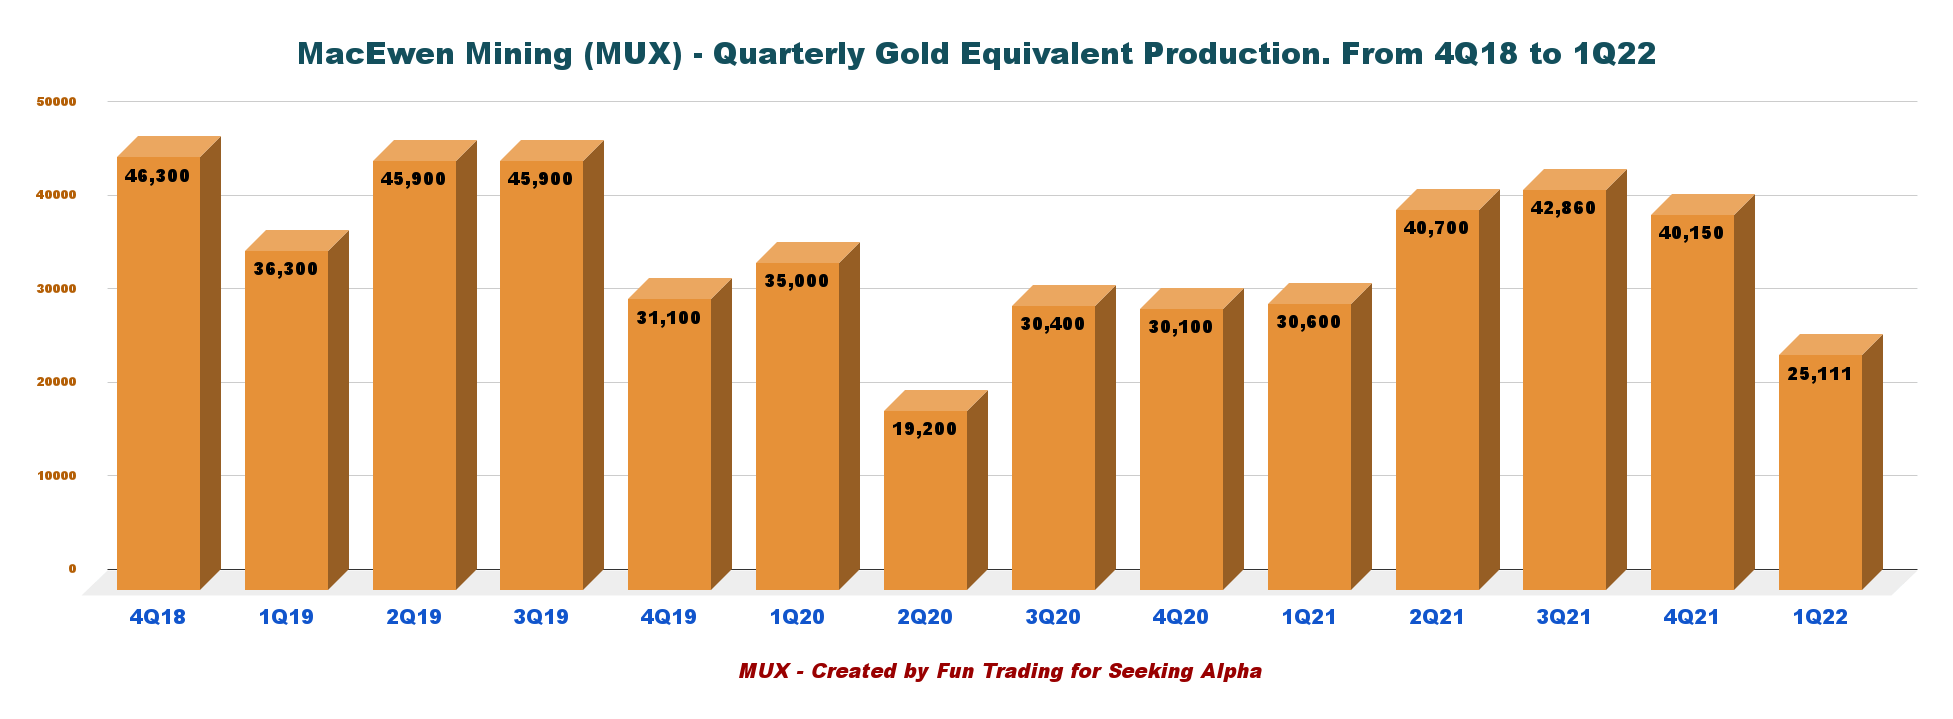
4.2 – Production details per mine:
MUX GEO Production per mine history (Fun Trading) 4.2.1 – Gold Bar produced 6,274 GEOs in 1Q22, which reflects a 15% decrease from the 7,415 GEOs produced in 1Q21. The decline was primarily due to a more significant number of weather-related days during 2022. Costs were high. 4.2.2 – In the conference call, the company said that the Fox Complex started strong and was slowed down by workforce shortages induced by COVID, and an equipment failure followed that in the mill. On January 26, 2022, MUX announced the PEA results on the Fox Complex. The PEA estimates positive economics for the expansion project at Fox, where production could continue for another 9 years after the depletion of Froome, at an average of 80.8K oz gold yearly. 4.2.3 – At the San Jose mine, operated by the company’s joint venture partner Hochschild Mining, COVID-induced workforce absences resulted in a temporary mine shutdown that adversely impacted gold and silver production and the costs associated with that production. Production went down to 10.700 GEOs this quarter. 4.2.4 – At the El Gallo Project, Production and revenue decreased in 1Q22, compared to 1Q21, as the company winds down the residual heap leach operation. McEwen Mining announced on December 31, 2020, the results of a feasibility study for the development of its 100%-owned Fenix Project, which includes the El Gallo Gold, and El Gallo Silver deposits, located in Sinaloa, Mexico… The Fenix Project feasibility study was published on February 16, 2021 and is available for review on our website and SEDAR (www.sedar.com). Multiple strategic alternatives continue to be evaluated for the project including lower capital costs, potential base metal evaluation and the possible divestiture of our Mexican business unit.
4.3 – All-in Sustaining costs – AISC and gold price received for 1Q22.

MUX Quarterly AISC and gold price realized history (Fun Trading)
AISC at the San Jose mine was $2,103 per ounce in 1Q22.
5 – 2022 Guidance (unchanged from 4Q21)
The company expects production of 153K to 172K GEOs in 2022.
Cash costs and all-in sustaining costs (AISC) per GEO sold for 2022 from the company’s 100%-owned mines (Gold Bar and Fox) are expected to be $1,310-1,410 and $1,570-1,690, respectively.
At San José, production is estimated to be 69.5K to 77.5K GEOs at an AISC per GEO sold of $1,330-1,370.
The Fox Complex PEA outlined the potential to extend the mine life by 9 years, generating average annual production of 80,800 gold ounces at average cash costs and AISC per ounce of $769 and $1,246, respectively. Below is the Fox Complex operations update from the July Presentation:
Also, total production for 2Q22 is expected to be 36,905 GEOs or 47% higher.
MUX 2022 Guidance (McEwen Mining)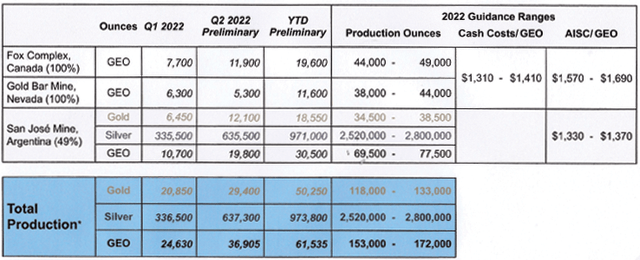
Technical Analysis (short term) and Commentary
MUX TA Chart short-term (Fun Trading)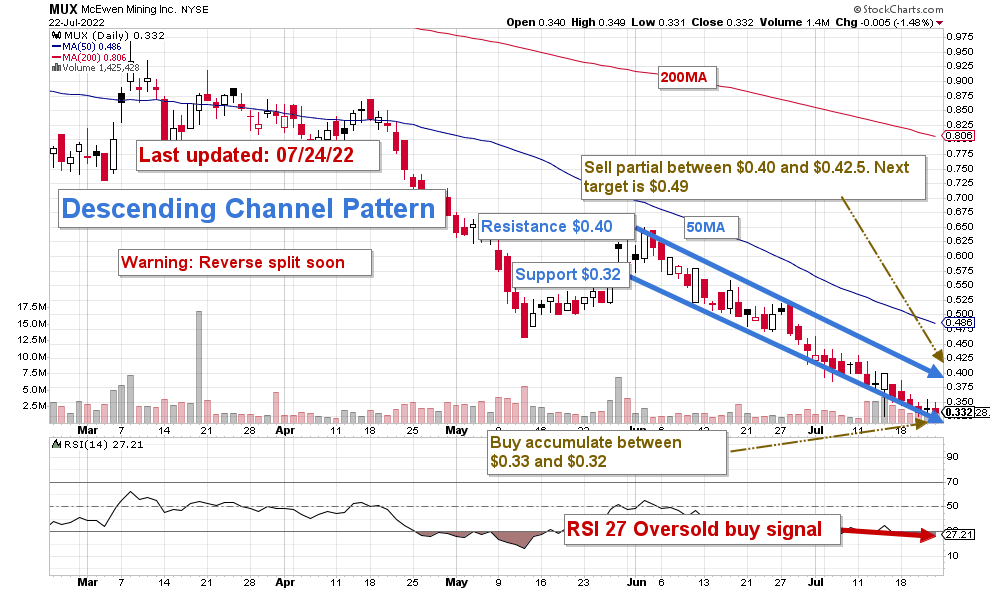
MUX forms a descending wedge pattern with resistance at $0.40 and ascending support at $0.32. The stock has dropped significantly since the company announced that it would go through a reverse split to stay compliant with its NYSE listing.
I suggest selling LIFO about 75% of your position between $0.40 and $0.425 and accumulating on any weakness between $0.33 and $0.32 (of a factor of 10 after reverse split).
The strategy buy-sell-rinse-repeat is the best path right now. I will probably start a small position on Monday between $0.32 and $0.33.
Note: The LIFO method is prohibited under International Financial Reporting Standards (IFRS), though it is permitted in the United States by Generally Accepted Accounting Principles (GAAP). Therefore, only US traders can apply this method. Those who cannot trade LIFO can use an alternative by setting two different accounts for the same stock, one for the long-term and one for short-term trading.
Author’s note: If you find value in this article and would like to encourage such continued efforts, please click the “Like” button below to vote for support. Thanks.
Be the first to comment