

simonkr/E+ via Getty Images
McCormick & Company (NYSE:MKC) is a consumer staple offering flavor solutions for the home chef as well as businesses across the world. McCormick offers spices that capture what they consider to be every flavor trend and for every occasion across every region as well as whether at home or on the go. McCormick sells their iconic flavors across 170 countries and territories giving them a truly global reach.
Approximately 60% of sales are from their consumer segment which includes the US and International spices that most everyone recognizes as well as recipe mixes, condiments & sauces. McCormick now holds the #1 spot in the US and Canada as well as the #2 spot in the US in hot sauce through their Franks Red Hot and Cholula brands of hot sauce.
The flavor solutions segment represents approximately 40% of sales and focuses on bulk spices, condiments, and flavorings for other businesses.
Their breadth of options, ~15,000 raw materials with over 80 countries as a source, is both a blessing and a curse and means they are heavily reliant on a functioning supply chain.
During the Q2 2022 earnings release McCormick cited continuing margin pressures due to supply chain issues as well as COGS inflation. Management plans to continue with price increases to help offset the COGS inflation and a targeting of internal cost cutting to combat the margin pressures.
After a greater than 20% pullback from their highs I wanted to re-examine McCormick to see if the valuation is finally palatable.
Dividend History
The dividend growth strategy is the one that most appealed to me when I first began investing. The strategy is simple and straight-forward: invest in businesses which have a history of paying and growing their dividend and which you believe will continue to do so for the foreseeable future. However, that doesn’t mean it’s easy.
McCormick Dividend History (McCormick Investor Relations)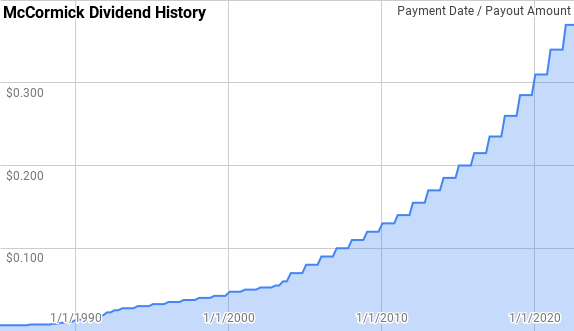
McCormick is a Dividend Champion with an impressive 36 consecutive year streak of dividend increases which dates back to 1987. Despite the tech boom and bust of the late 90s and early 00s, the financial crisis from 07-09, and most recently the global pandemic McCormick has been there with a steady hand for investors.
During that time McCormick’s year over year dividend growth has ranged from 5.0% to 35.7% with an average of 11.9% and a median of 9.4%.
There’s also been 32 rolling 5-year periods with annualized dividend growth ranging from 7.0% to 27.1% with an average of 11.7% and a median of 9.4%.
Over that same period there’s been 27 rolling 10-year periods with McCormick’s annualized dividend growth spanning 7.7% to 17.7% with an average of 10.9% and a median of 10.2%.
The rolling 1-, 3-, 5- and 10-year rolling dividend growth rates from McCormick since 1985 can be found in the following table.
| Year | Annual Dividend | 1 Year | 3 year | 5 Year | 10 Year |
| 1985 | $0.028 | ||||
| 1986 | $0.028 | 0.00% | |||
| 1987 | $0.031 | 13.64% | |||
| 1988 | $0.033 | 6.00% | |||
| 1989 | $0.043 | 28.30% | 15.62% | ||
| 1990 | $0.058 | 35.29% | 22.54% | ||
| 1991 | $0.070 | 21.74% | 28.33% | 20.55% | |
| 1992 | $0.095 | 35.71% | 30.75% | 24.90% | |
| 1993 | $0.110 | 15.79% | 24.14% | 27.13% | |
| 1994 | $0.120 | 9.09% | 19.68% | 23.07% | |
| 1995 | $0.130 | 8.33% | 11.02% | 17.72% | |
| 1996 | $0.140 | 7.69% | 8.37% | 14.87% | 17.67% |
| 1997 | $0.150 | 7.14% | 7.72% | 9.57% | 16.98% |
| 1998 | $0.160 | 6.67% | 7.17% | 7.78% | 17.06% |
| 1999 | $0.170 | 6.25% | 6.69% | 7.21% | 14.87% |
| 2000 | $0.190 | 11.76% | 8.20% | 7.89% | 12.70% |
| 2001 | $0.200 | 5.26% | 7.72% | 7.39% | 11.07% |
| 2002 | $0.210 | 5.00% | 7.30% | 6.96% | 8.26% |
| 2003 | $0.230 | 9.52% | 6.58% | 7.53% | 7.65% |
| 2004 | $0.280 | 21.74% | 11.87% | 10.49% | 8.84% |
| 2005 | $0.320 | 14.29% | 15.07% | 10.99% | 9.43% |
| 2006 | $0.360 | 12.50% | 16.11% | 12.47% | 9.90% |
| 2007 | $0.400 | 11.11% | 12.62% | 13.75% | 10.31% |
| 2008 | $0.440 | 10.00% | 11.20% | 13.85% | 10.65% |
| 2009 | $0.480 | 9.09% | 10.06% | 11.38% | 10.94% |
| 2010 | $0.520 | 8.33% | 9.14% | 10.20% | 10.59% |
| 2011 | $0.560 | 7.69% | 8.37% | 9.24% | 10.84% |
| 2012 | $0.620 | 10.71% | 8.91% | 9.16% | 11.43% |
| 2013 | $0.680 | 9.68% | 9.35% | 9.10% | 11.45% |
| 2014 | $0.740 | 8.82% | 9.74% | 9.04% | 10.21% |
| 2015 | $0.800 | 8.11% | 8.87% | 9.00% | 9.60% |
| 2016 | $0.860 | 7.50% | 8.14% | 8.96% | 9.10% |
| 2017 | $0.940 | 9.30% | 8.30% | 8.68% | 8.92% |
| 2018 | $1.040 | 10.64% | 9.14% | 8.87% | 8.98% |
| 2019 | $1.140 | 9.62% | 9.85% | 9.03% | 9.04% |
| 2020 | $1.240 | 8.77% | 9.67% | 9.16% | 9.08% |
| 2021 | $1.360 | 9.68% | 9.35% | 9.60% | 9.28% |
| 2022 | $1.480* | 8.82% | 9.09% | 9.50% | 9.09% |
Source: Author; Data Source: McCormick & Company Investor Relations
*Assumes the typical October payment will be made at a rate of $0.37 per share.
The dividend payout ratio is a quick and dirty way to measure the sustainability of a dividend as well as its potential to grow in the future. The payout ratio compares the dividend payment versus either profits or cash flow and the lower the payout ratio the better as there’s more “wiggle room” for the inevitable disruptions that a business will face without jeopardizing the dividend.
MKC Dividend Payout Ratios (MKC SEC filings)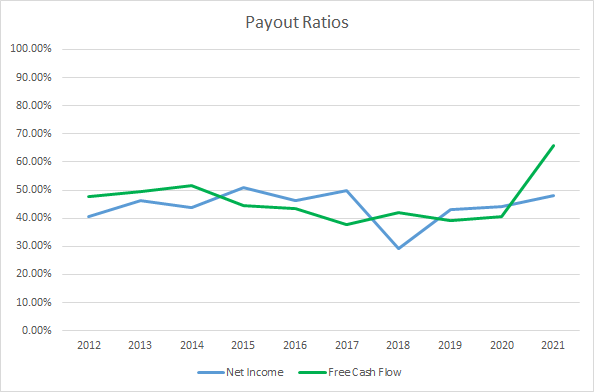
McCormick’s payout ratios have been fairly consistent over the last decade. The 10-year average net income payout ratio is 44.2% with the 5-year average at 42.9%. Similarly, the average free cash flow payout ratios are 46.2% and 45.0%, respectively. McCormick’s dividend is well covered by both profits and cash flow.
Quantitative Quality
A lengthy dividend growth streak is just one data point that I follow for a business and use it more as a screening tool to narrow down the universe of investments. In order to become comfortable with a business I track several other financial metrics over time.
MKC Revenue Profits and Cash Flow (MKC SEC filings)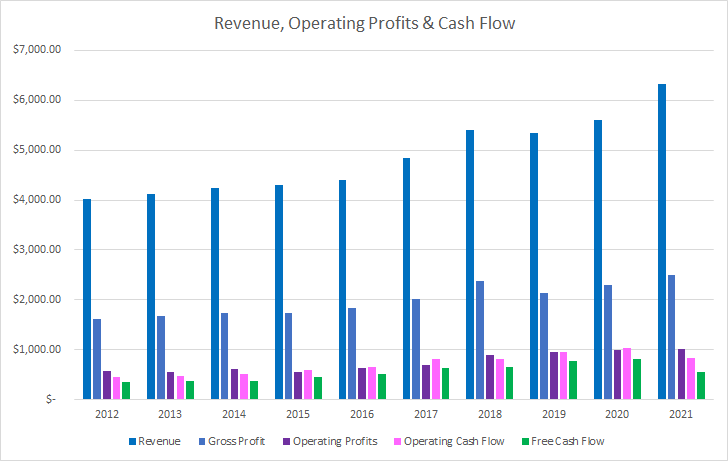
McCormick has achieved adequate growth over the last decade through a combination of both organic growth as well as acquisitions. Over that time total sales are up 57.4% or 5.2% annualized. Gross profits rose in line with revenues improving by 54.2% or 4.9% annualized.
Operating profits increased by a strong 75.6% or 6.4% annualized while operating cash flow improved by 82.0% or 6.9% annualized. Although free cash flow lagged behind operating cash flow growth increasing just 59.4% in total or 5.3% annualized. However, that appears to be more of a temporary issue rather than one likely to continue.
Quality businesses that have some form of moat around their business should be able to have at a minimum stable, and more than likely, improving margins over time. I typically want to see free cash flow margins greater than 10%.
MKC Margins and CCR (MKC SEC Filings)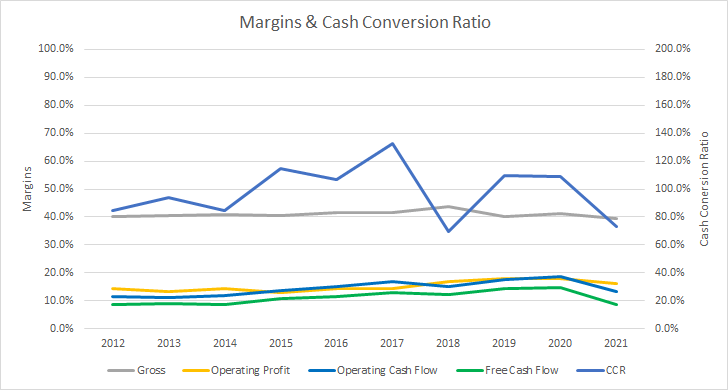
McCormick’s gross margin has routinely been right around 40% with little variability over time. The 10-year average gross margin is 41.0% with the 5-year average at 41.2%.
Likewise, McCormick’s free cash flow margins have been trending higher, although they have not hit >10% margins in 5 of the last 10 years. However, prior to FY 2021, McCormick had not been sub-10% since FY 2014. The 10-year average is 11.1% with the 5-year average at 12.6%.
I also want to see how efficient the business is at generating cash flow from its asset or capital base. The free cash flow return on invested capital, FCF ROIC, measures how well the company turns its invested capital into cash flow. Similar to the margins, my expectation is to see stable or rising FCF ROICs over time.
MKC Free Cash Flow Returns (MKC SEC filings)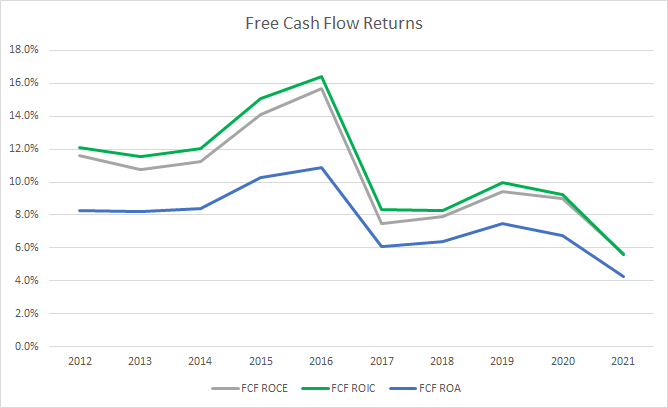
From FY 2012 through FY 2016, McCormick showed very strong FCF ROICs; however, they had a significant drop in FY 2017 due to the RB Foods acquisition and have trended lower. The 10-year average FCF ROIC for McCormick is 10.9% although the 5-year average is just 8.3%. McCormick’s debt load increased sharply from the acquisition leading to the decline in ROIC, ROCE, and ROA.
To understand how McCormick uses its free cash flow I calculate three variations of the metric, defined below:
- Free Cash Flow, FCF: Operating cash flow less capital expenditures
- Free Cash Flow after Dividend, FCFaD: FCF less total cash dividend payments
- Free Cash Flow after Dividend and Buybacks, FCFaDB: FCFaD less net cash used repurchasing shares
MKC Free Cash Flows (MKC SEC filings)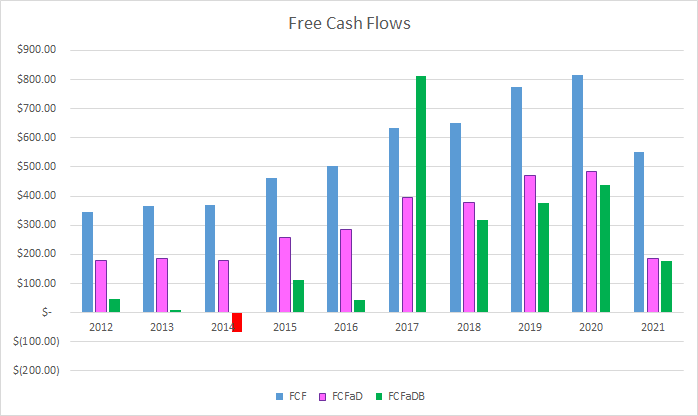
From FY 2012 through FY 2021, McCormick was able to produce $5.5 B in cash flow from operations while sending back $2.5 B to owners through dividend payments. That pegs the 10-year FCFaD at $3.0 B.
Once again we see a pre- and post- acquisition difference in McCormick. Prior to the acquisition, McCormick would send a majority of their FCFaD on buybacks; however, since then cash flow is being preserved. Over the decade, McCormick has used a net total of $0.7 B on buybacks putting the cumulative FCFaDB at $2.3 B.
With minimal capital being deployed on share repurchases since FY 2016, it shouldn’t be much of a surprise to see that McCormick’s share count has been back on the rise. The pre/post acquisition split rears its head again with McCormick retiring ~4.8% of outstanding shares between FY 2012 and FY 2016. However, post acquisition the share count is back to effectively flat over the last decade with a 0.4% total increase.
MKC Shares Outstanding (MKC SEC filings)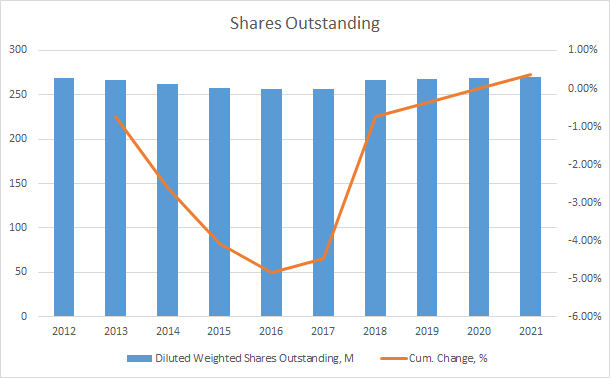
The balance sheet is another critical metric that I monitor especially since my goal is to own my stake in a business for years, if not decades, if the business continues to do what I expect. One metric that I track is the debt-to-capitalization ratio to see how the business is capitalized.
MKC Debt to Capitalization (MKC SEC filings)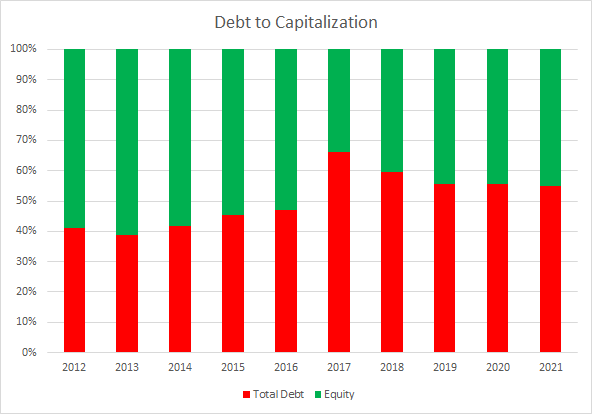
McCormick’s debt-to-capitalization ratio has been fairly stable considering the large increase in total debt from the RB Foods acquisition. McCormick’s debt-to-capitalization ratio has averaged 51% over the last decade with the 5-year average at 58%.
The net debt ratios are more important to me since it gives an idea of how much leverage the business carries versus its profits or cash flows. The net debt ratios also let you know how quickly the business could de-lever its balance sheet if needed.
MKC Debt Ratios (MKC SEC filings)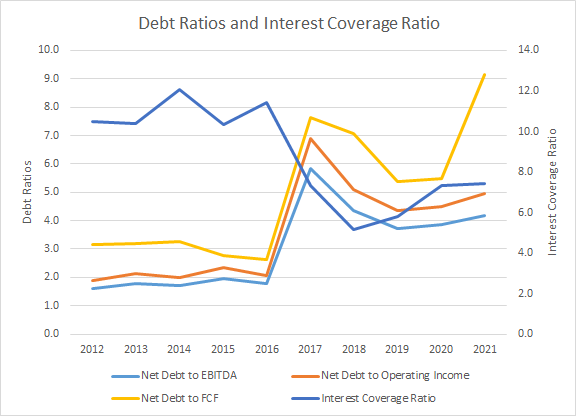
The RB Foods acquisition strikes again in terms of balance sheet effects. The 10-year average net debt-to-EBITDA, net debt-to-operating income, and net debt-to-FCF ratios are 3.1x, 3.6x, and 5.0x. McCormick’s 5-year averages are 4.4x, 5.2x, and 6.9x, respectively.
Similarly, McCormick’s interest coverage ratios have taken a hit as well with a 10-year average of 8.8x and 5-year average of 6.6x.
I expected to see more improvement in McCormick’s debt and leverage post-acquisition yet that has not played out as of now. Their debt ratios appear stable although elevated compared to what I would like to see. However, given the relatively predictable nature of their business McCormick can afford to run higher leverage although it is a risk at this time.
Valuation
When valuing potential investments I employ a variety of methods in order to try and determine what I believe would be attractive levels to purchase shares in a business. The methods that I utilize are a reverse discounted cash flow analysis, dividend yield theory, and a minimum acceptable rate of return, “MARR”, analysis.
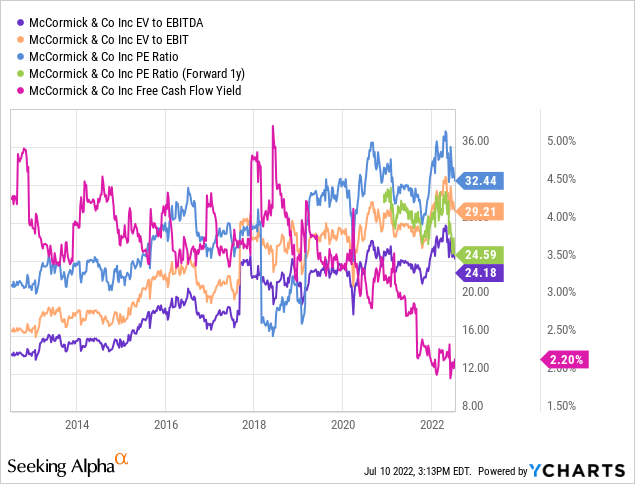
Analysts expect McCormick to report FY 2022 EPS of $3.04 and FY 2023 EPS of $3.31. They also expect McCormick to be able to grow EPS 6.6% annually across the next 5 years. I then assumed that McCormick could attain 5.0% annual EPS growth for the following 5 years. Dividends are assumed to target a 48% payout ratio.
I also like to see how market participants are currently valuing McCormick as well as on a historic basis to try and understand how they might value it in the future. For the MARR analysis I’ll use a terminal multiple that spans between 15x and 30x, with a fair value multiple between 20x and 25x.
The following table shows the potential internal rates of return that an investment in McCormick could possibly generate based on the assumptions laid out above. Returns assume that McCormick continues to pay and raise its dividend along its historical pattern. Returns also assume that shares are purchased at $82.07, Friday’s closing price.
| IRR | ||
| P/E Level | 5 Year | 10 Year |
| 30 | 11.9% | 9.2% |
| 25 | 7.6% | 7.3% |
| 22.5 | 5.2% | 6.2% |
| 20 | 2.5% | 5.0% |
| 17.5 | -0.3% | 3.7% |
| 15 | -3.5% | 2.2% |
Source: Author
Additionally, I use the MARR analysis framework to work backwards in order to find the maximum price I could pay today in order to generate the returns that I desire from my investments. My base hurdle rate is a 10% IRR and for McCormick I’ll also examine 12% and 8% return targets.
| Purchase Price Targets | ||||||
| 10% Return Target | 12% Return Target | 8% Return Target | ||||
| P/E Level | 5 Year | 10 Year | 5 Year | 10 Year | 5 Year | 10 Year |
| 30 | $90 | $79 | $84 | $68 | $97 | $92 |
| 25 | $76 | $68 | $71 | $58 | $82 | $79 |
| 22.5 | $69 | $62 | $65 | $54 | $75 | $72 |
| 20 | $62 | $57 | $58 | $49 | $67 | $66 |
| 17.5 | $55 | $51 | $51 | $44 | $59 | $59 |
| 15 | $48 | $45 | $45 | $39 | $52 | $53 |
Source: Author
Dividend yield theory is a valuation method centered around reversion to the mean and is best suited for stable companies that have a history of paying a dividend to owners. It operates under the assumption that collectively market participants will value a business around a normal dividend yield. For McCormick I’ll use the 5-year average forward dividend yield as a proxy for fair value.
McCormick Dividend Yield Theory (MKC Investor Relations and Yahoo Finance)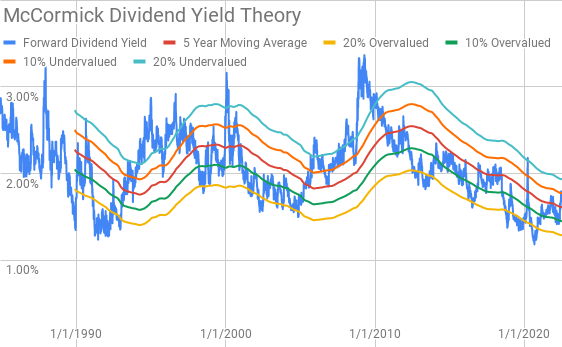
McCormick shares currently offer a forward dividend yield of 1.80% compared to the 5-year average forward yield of 1.61%.
A reverse discounted cash flow analysis is a way to work backwards with a DCF model from the current market valuation to figure out what kind of growth and margins a business must have to generate the cash flows to support the valuation. In other words you can see what you have to believe the company has to do from a growth and margin structure in order to be worth the current market valuation. If you believe the business can surpass the required levels then the business is undervalued; however, if you believe the business cannot attain the levels then the business is overvalued.
I use a simplified DCF model built on revenue growth, an initial free cash flow margin of 9% that increases to 13.0% during the forecast period, and a terminal growth rate of 3.5%. Under those assumptions, McCormick needs to grow revenues 15.6% annually through FY 2031 in order to generate the cash flows to support 10% annual returns. With an 8% discount rate, the required revenue growth drops to 9.5% annually.
Conclusion
McCormick is a great business and one that I’ll gladly continue to own as I have since early 2017. While McCormick has not wowed anyone with top line growth coming in at just 5.2% annually over the last decade including the RB Foods acquisition, they are very stable and I have little doubt McCormick will still be around helping restaurants, home chefs, and other businesses enhance their flavors for decades to come.
The question really comes down to does the current market valuation make sense. Dividend yield theory suggests that McCormick’s fair value range lies between $84 and $102. While the MARR analysis shows a fair value range between $62 and $76 based on a 10% return target 5-years out with a terminal multiple between 20x and 25x.
The reverse DCF model does seem to show that McCormick is quite expensive when targeting both 8% and 10% return marks. McCormick would need to generate very high revenue growth and or have their free cash flow margin expand to much higher levels in order to start reaching a reasonable valuation.
Although there is some blue sky peeking through those clouds if management is able to hit their intermediate and long-term targets. Although, McCormick did lower FY 2022 guidance during their Q2 earnings release suggesting more dark clouds potentially to come.
MKC CAGNY Conference Feb 2022 (MKC CAGNY Conference Feb 2022)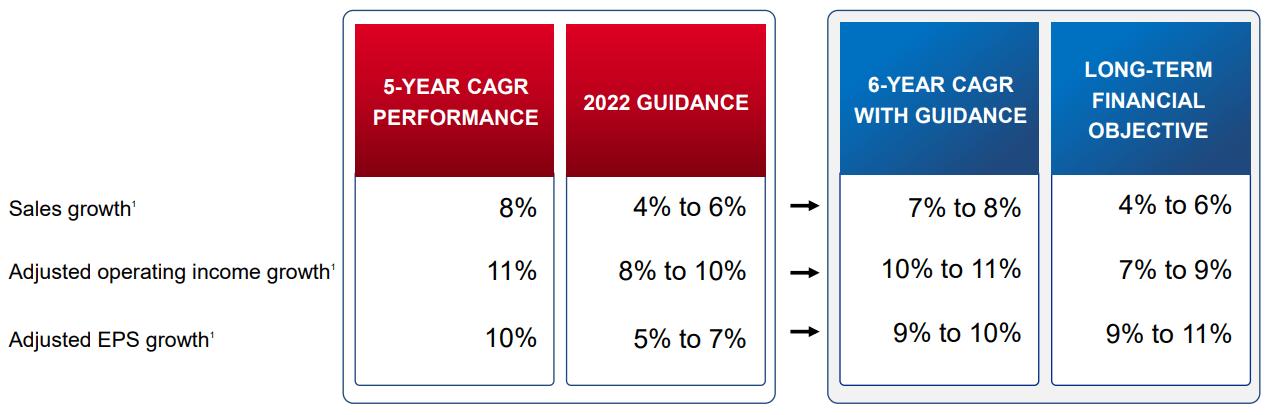
If McCormick is able to hit those targets then investors should be just fine over time.
With McCormick’s share price off over 20% and at least approaching more reasonable levels the options market could provide investors with a chance to earn some premium or purchase shares of what I believe is a quality company at lower prices.
MKC Option Possibilities (McCormick Option Chain from Close of 7/8/22)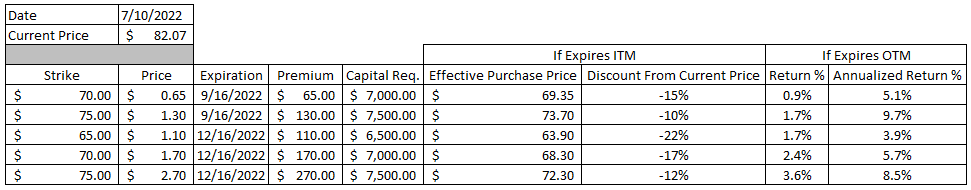
When I approach the options market as a way to potentially enter a position or acquire more shares, I typically look for the equivalent of a 10% annualized return from the option premium or an equivalent purchase price at a level that I believe offers a good risk:reward profile.
Of the September and December 2022 expirations there’s two potential contracts that look interesting. The September $75 contract was offering a $1.30 premium, at the midpoint, and works out to an effective annualized return of 9.7% if the contract expires or an effective purchase price of $73.70, ~10% lower than current levels. Similarly, the $75 strike December 2022 contract offers a return of 8.5% or a purchase price of $72.30, a ~12% discount from current levels.
The contracts aren’t especially enticing; however, they are approaching potentially attractive levels and an increase in volatility would make them more so.
At this time I’m in no rush to add to my position in McCormick other than through dividend reinvestment. The valuation appears quite elevated to me at the current share price around $82. If McCormick’s share price were to continue to fall into the low $70s or into the $60s I would be looking to pick up additional shares for my portfolio. Until then I’ll continue to look for other opportunities while patiently waiting for a better chance to add more McCormick.
Be the first to comment