

Allkindza/iStock via Getty Images
One of the perverse ironies of the investing world is that whenever corporate layoffs become widespread and thousands of workers are faced with the pain of unemployment, the stock market tends to jump for joy.
While some analysts who have commented on this phenomenon cynically chalk it up to a devil-may-care attitude on the part of Wall Street toward workers, it’s more likely the result of corporate cost-cutting having a presumably positive impact on profit margins. But whatever the reason, there’s no denying that when mass layoffs make front-page news, the broad market is setting up for a major rally in almost every single case.
That’s the reality we’re seeing now as front-page headlines describe a seemingly endless list of job cuts among several major companies. Wednesday’s edition of the Wall Street Journal featured the latest in the layoff litany, including Bed Bath & Beyond’s (BBBY) plans to proceed with “more layoffs [and] cost cuts,” as well as Coinbase’s (COIN) decision to slash 20% of its workforce. The day after both layoff decisions were announced, COIN stock rallied 10% while BBBY soared a head-turning 160% over a two-day period.
Prior to that, Amazon (AMZN) announced on January 5 that it planned to furlough over 18,000 workers—roughly 5% of its workforce—in the latest wave of tech sector layoffs. According to WSJ, the job cuts will be made over the coming weeks. Unsurprisingly, the final low for Amazon’s stock was made the day of the announcement; since then it has risen over 15%.
Other major companies with recent layoffs include: Zillow (ZG, which has laid off at least 5% of its workforce), Goldman Sachs (GS, 8% of its workforce), Salesforce (CRM, 10% of workforce), Vimeo (VMEO, 11% of workforce), Meta (META, 13% of workforce), Snap (SNAP, 20% of workforce) and Twitter—which laid off nearly half its global employees. In each instance, the stocks of the companies mentioned here rose significantly after the layoff announcement.
Aside from the layoffs, the trend of unsettling news as it pertains to the U.S. economy continues to dominate mainstream news outlets. The latest example of this trend is a Reuters article on January 13 that highlighted U.S. Treasury Secretary Janet Yellen warning that the U.S. faces a default risk by June unless the federal debt limit is increased.
With economic pessimism in the ascendant, an argument can be made that the old Wall Street bromide, “Buy when there’s blood in the streets,” applies here. It’s no coincidence that the floodtide of layoff announcements and bad economic news which began intensifying around late October, and has only increased in recent weeks, has served as a key catalyst behind the market’s New Year rally.
There’s no denying the stock market was (and still is) sitting on a virtual powder keg of short interest in the last few months. The extent to which traders were heavily short and pessimistic on equities can be seen in the following chart from Jason Goepfert’s SentimenTrader, which shows his Panic/Euphoria model at a multi-decade low. Similar levels of panic among traders (i.e. short interest buildup) were followed by explosive upside moves in the major indexes.
SentimenTrader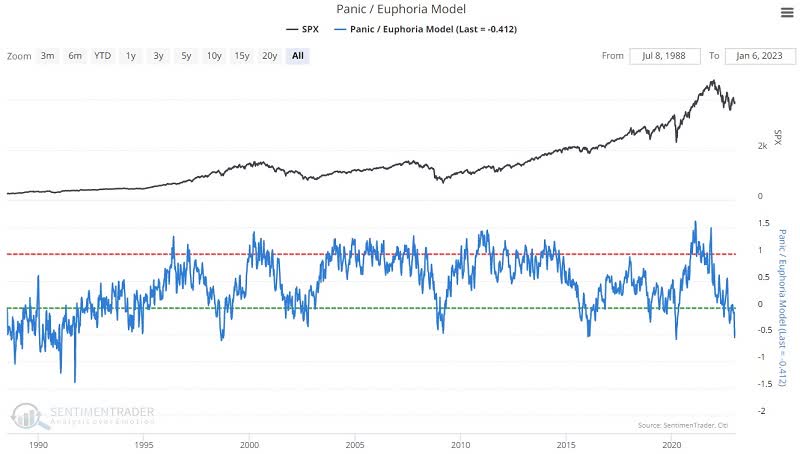
Even after the 11% rally in the S&P 500 index since the October low was established, investor sentiment remains astonishingly tepid. As shown by the weekly readings in the AAII survey, bullish sentiment has averaged only 23% in the last four weeks—well under the long-term average of 35%. This underscores the reluctance of individual investors to believe the bear is gone which, from a contrarian perspective, supports additional short covering potential as investors continue purchasing put options as protection again volatility risk.
AAII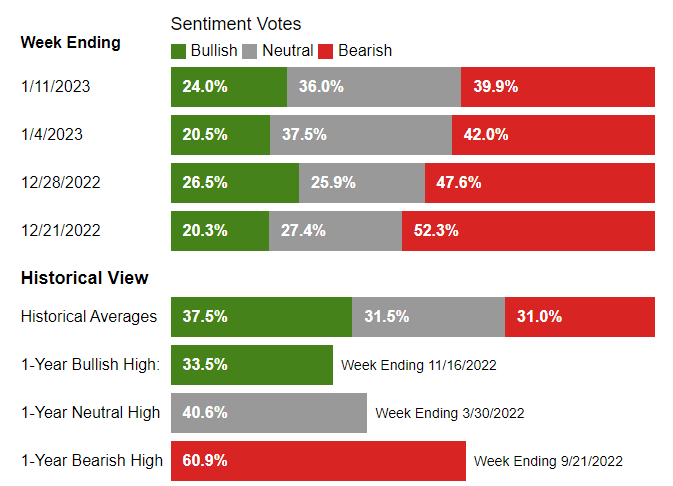
Speaking of the options market, Jason Goepfert noted last week that small options traders spent 32% of their total volume buying put contracts to open. He notes that’s the third heaviest put-buying total of any week since the year 2000. Moreover, traders reversed their purchases of call options by the highest level in almost four years, while the ROBO put/call ratio hit 93% (indicating a surplus of put buying over call buying). Moreover, this was the second-highest put/call ratio in the last 20 years and was exceeded only by the enormous put buying volume of mid-March 2020.
Moreover, the CBOE put/call ratio is coming off one of its most elevated levels (i.e. heavy put buying) in several years. The 13-day moving average of this put/call ratio remains near its historical high as of this writing, a sign that traders are still bearish and are loaded to the gills with short positions.
Market-Harmonics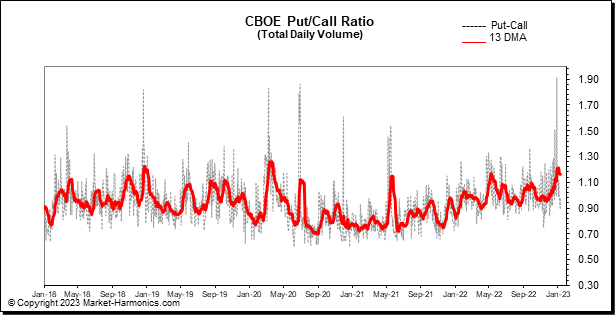
All told, the above indications suggest that there is indeed plenty of metaphorical “blood” in the headlines today, which is potentially very good news for the intermediate-term (3-to-6-month) stock market outlook. My expectation is that the months ahead will witness continued recovery in the major U.S. averages as the heavy bearish bets out there are gradually covered when it becomes evident that the market has already discounted the corporate layoffs and bad economic news.
Editor’s Note: This article covers one or more microcap stocks. Please be aware of the risks associated with these stocks.
Be the first to comment