

Editor’s note: Seeking Alpha is proud to welcome Ming Jong Tey as a new contributor. It’s easy to become a Seeking Alpha contributor and earn money for your best investment ideas. Active contributors also get free access to SA Premium. Click here to find out more »
chaiyapruek2520/iStock via Getty Images
The breadth thrust indicator using the percentage of stocks above the 50-Day average for the S&P 500 has been rising with strong momentum since the low in June 2022. This could be a meaningful momentum starter, marking the stock market bottom in 2009, 2010, 2011, 2016, 2018 and 2020.
Using Market Breadth Thrust To Anticipate the Market Bottom
To qualify as a significant breadth thrust, it needs to hit the deeply oversold level, which is below (or close to) 10 followed by a rise above the deeply overbought level, which is above 90.
As reflected in the market breadth, the deeply oversold level suggests a selling climax or a depressed market with an extreme bearish sentiment. The subsequent sharp rise in the market breadth to the overbought level suggests urgent buying from the institutions, and bullish divergence could show up from time to time.
TradingView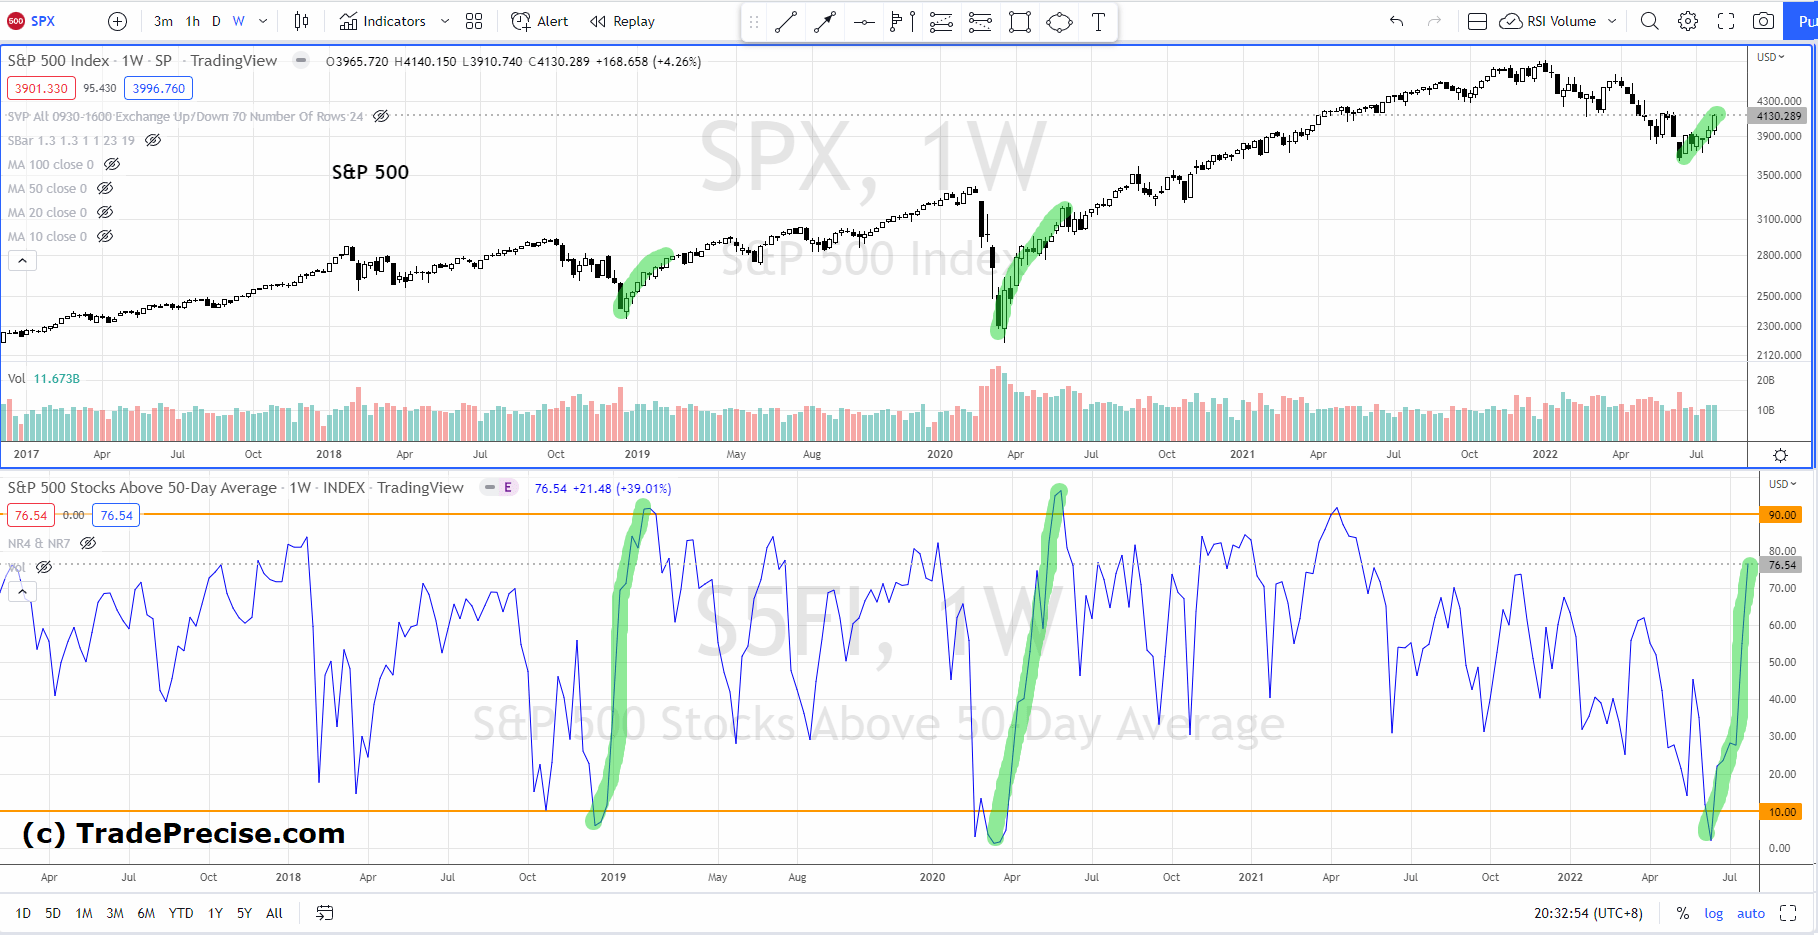
As shown above, a market bottom was formed in March 2020, where the breadth thrust dipped below 10 and rose beyond 90. This strong momentum of the breadth thrust started the bull market despite the market sentiment being very bearish because of the pandemic.
In December 2018, S&P 500 had a strong selloff as a shakeout, breaking below the support level at 2500. Similarly, the market breadth dipped below the oversold level and rebounded to 90, marking the market bottom in 2018.
Currently, the breadth thrust is at 76, with impulsive momentum similar to 2019 and 2020. A test of the overbought level is essential for the current breadth thrust to qualify as the momentum starter to kick start the bull run.
TradingView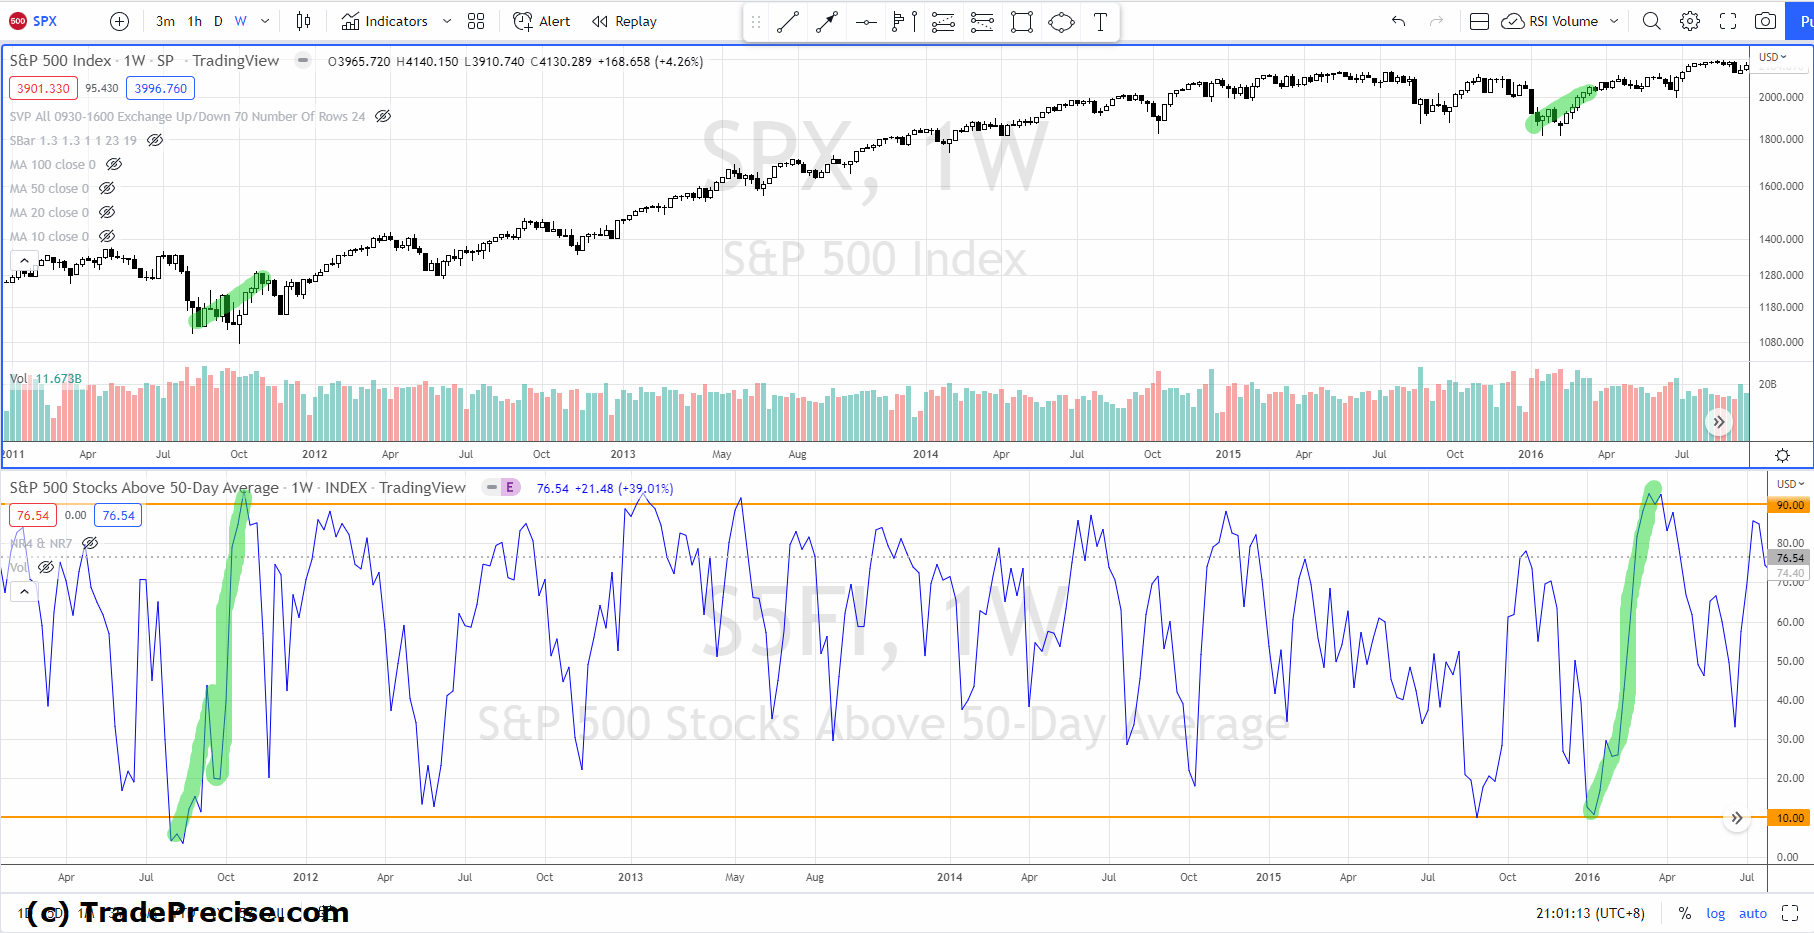
During 2015-2016, S&P 500 formed a trading range between 1800-2100 as shown above. In July 2015, although the market breadth hit the oversold level, it failed to reach the overbought level at 90. Hence it did not qualify as momentum starter that would mark the bottom, and it was confirmed by a lower low test in 2016. However, the breadth thrust in 2016 went from 10 to 90, which marked the market bottom.
In July 2011, although the breadth thrust qualified the condition from oversold to overbought, the momentum was not as strong as in 2016. This was also reflected in S&P 500 as multiple tests of the swing low were observed. Nevertheless, the breadth thrust in 2011 did mark the market bottom.
TradingView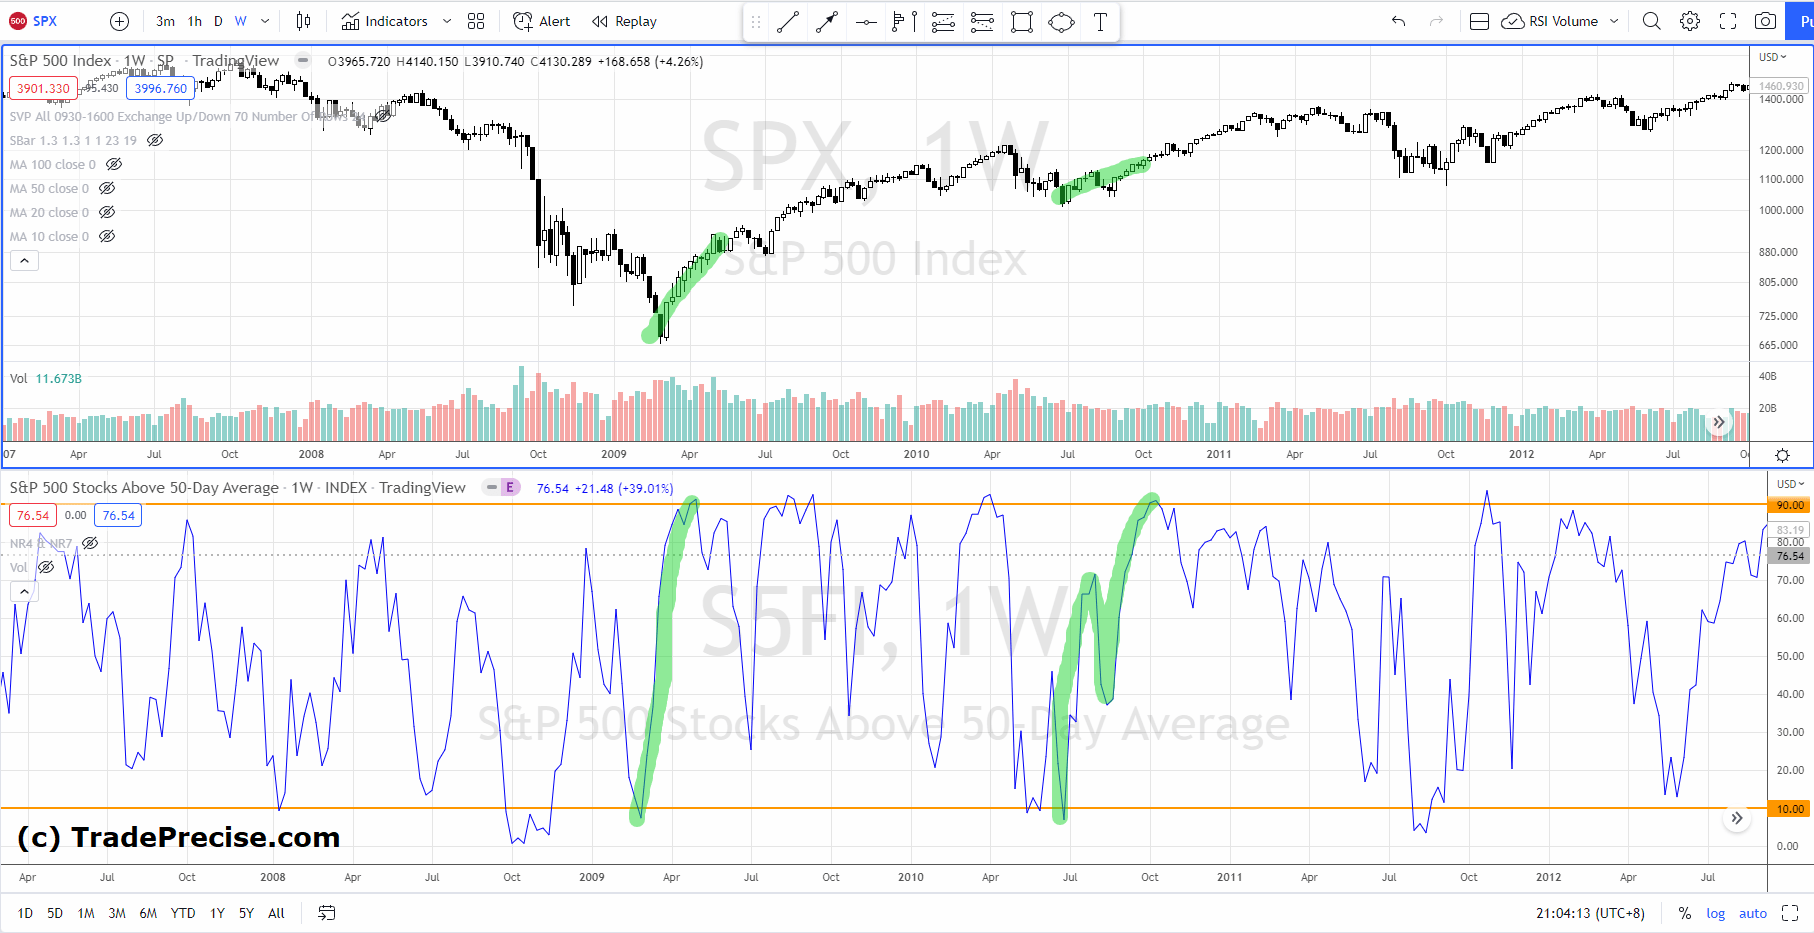
The breadth thrust in 2010 was similar to 2011, which was not impulsive enough. However, it did qualify (from 10 to 90) as a momentum starter to mark the market bottom.
During the global financial crisis in 2008-2009, there were three instances where the market breadth dipped below 10, yet the subsequent move did not reach the overbought level at 90. These were the classical bear market rallies, which traders and investors should pay attention to.
In March 2009, the breadth thrust went from below 10 to above 90, which marked the market bottom.
Bottom Line
As the current breadth thrust is yet to reach the overbought level, the market bottom is yet to be confirmed.
Pay attention to the percentage of stocks above the 50-Day average for the S&P 500 (Ticker Symbol: S5FI in TradingView). Should this market breadth commit above 90, the market environment will be a lot bullish and might be time to scale in with progressive exposure.
While the bullish setups are gaining momentum, the market is short-term overbought and testing the resistance zone between 4100-4200. It is prudent to pick the best quality setup among the outperforming stocks with decent reward to risk.
Tight risk management is essential while participating during the market bottoming process as volatile movement can be expected from both sides.
Should S&P 500 break below 4000 with increasing volume, a re-assessment with the Wyckoff method is required for the market bottoming scenario.
Be the first to comment