

JHVEPhoto/iStock Editorial via Getty Images
Introduction
The independent US refiner and marketer, Ohio-based Marathon Petroleum (NYSE:MPC), released its first-quarter 2022 results on May 3, 2022.
Note: I have followed MPC quarterly since 2018 with 14 articles and counting. This new article is a quarterly update of my article published on March 9, 2022.
I also recommend reading my article on Valero Energy (VLO) published on May 11, 2022.
1 – 1Q22 results snapshot
Marathon Petroleum reported a better-than-expected adjusted income of $1.49 per share for the first quarter. Net income was $845 million compared to a loss of $242 million in 1Q21. Revenues were up significantly from $22.88 billion to $38.38 billion.
MPC: 1Q22 Highlights Presentation (Marathon Petroleum)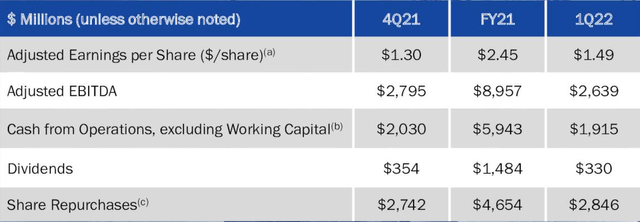
The company’s results were positively impacted by a stronger-than-expected performance from the Refining & Marketing and the Midstream segments, with income totaling $768 million and $1,072 million (please see the chart below).

MPC Quarterly operating income per segment comparison 1Q22 versus 1Q21 (Fun Trading)
Note: On March 1, 2022, the company announced it has agreed to form a joint venture with Neste (OTCPK:NTOIF) for Marathon’s Martinez renewable fuels project. The partnership will be structured as a 50/50 joint venture with Neste expected to contribute $1 billion, inclusive of half of the total estimated development costs.
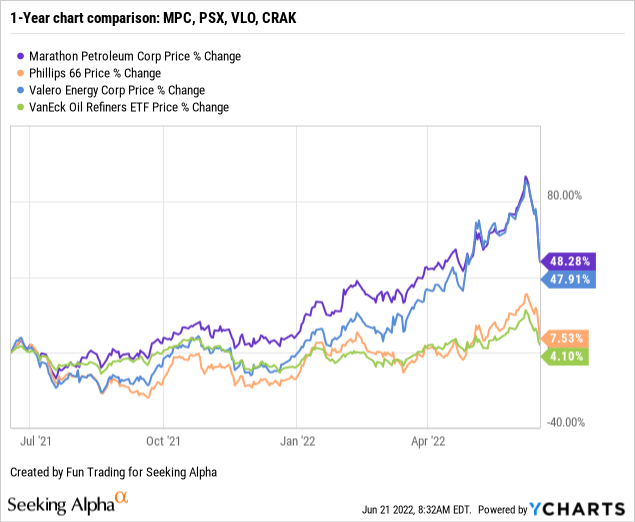
2 – Stock performance
I recommend following the VanEck Vectors Oil Refiners ETF (CRAK) for investors interested in the refining sector. Marathon Petroleum has significantly outperformed the group and is up 48% on a one-year basis after the giant slide last week.
3 – Investment thesis
My primary investment in this sector is Valero Energy, but I consider Phillips 66 (PSX) and Marathon Petroleum as two reliable companies that can be part of a long-term investment.
As you will conclude after reading my article, MPC is a great company with an excellent balance sheet. Furthermore, demand for MPC products is robust and is expected to be strong in 2022.
The refining sector is profiting from geopolitical uncertainty amid Russia’s war in Ukraine. In March, crude prices increased to multi-year highs of $130 on concerns about supplies from Russia, one of the world’s largest oil and natural gas producers. This situation set the stage for a great 2022 for Marathon Petroleum and its US peers.
However, booming oil prices are creating an unprecedented rise in inflation, reaching as high as 9%, which lifts the probability of a painful recession that could significantly affect demand for MPC products.
Thus, it is prudent to trade LIFO about 30% of your long-term position in case of a steep retracement in this sector which looks overheated right now and could quickly drop another 20% if the market gets spooked by rampant inflation.
Marathon Petroleum pays a dividend yield of 3.11%.
MPC, PSX and VLO dividend comparison (Fun Trading)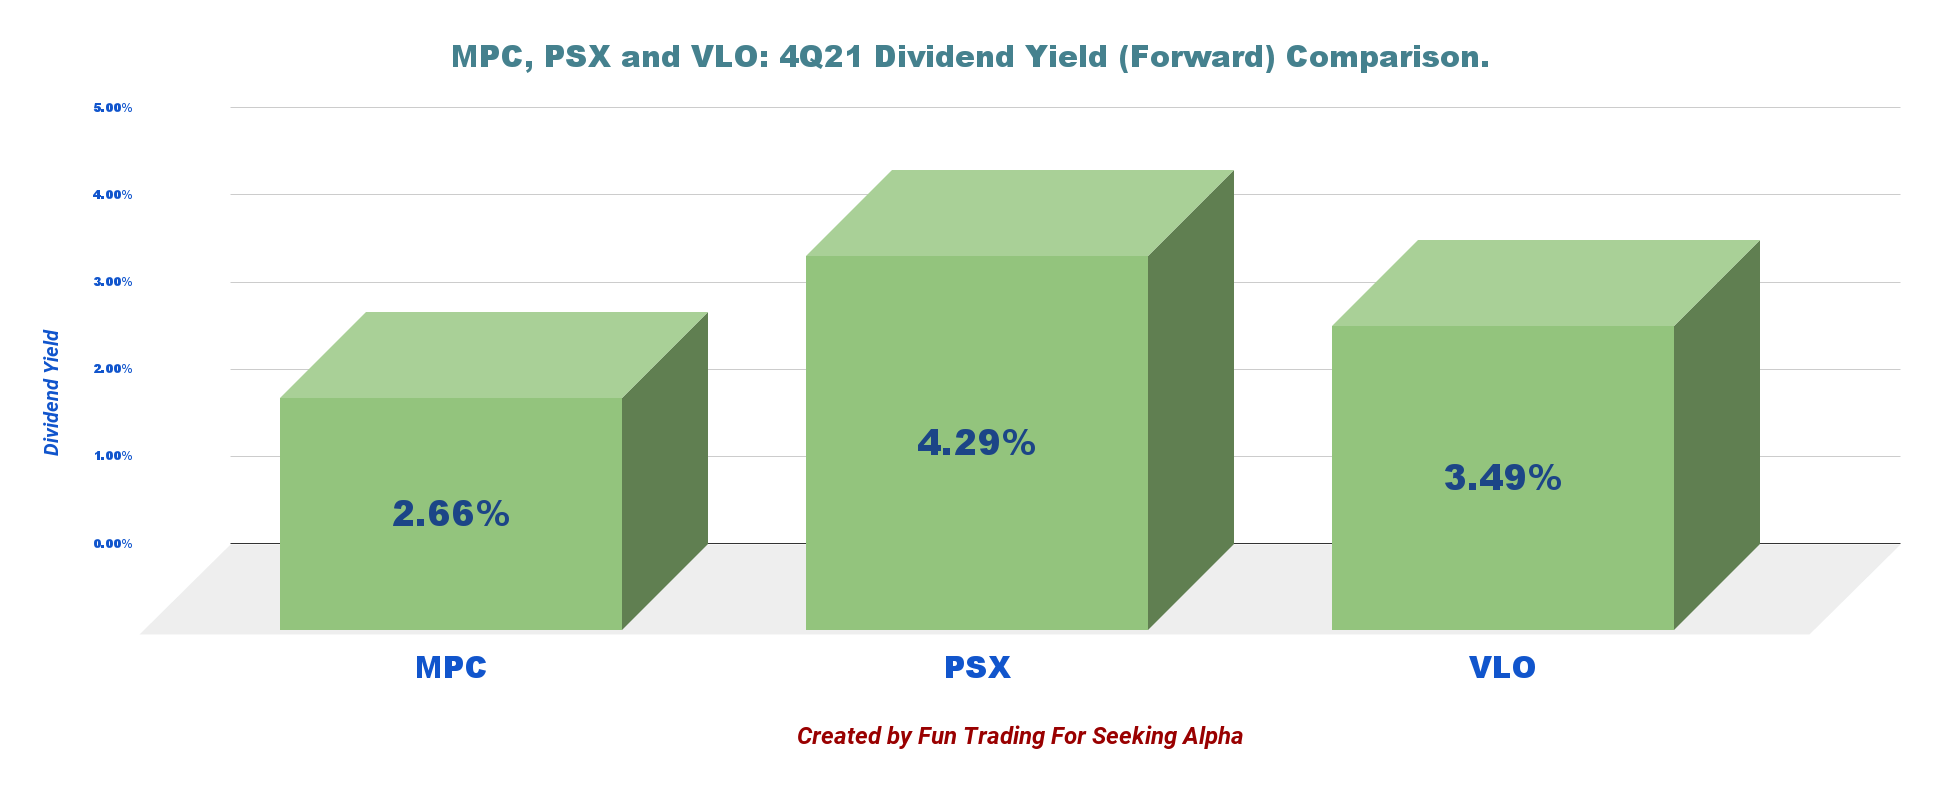
However, after a slow start, MPC has performed exceptionally well in 2021 and is now relatively high. The refinery sector is highly cyclical, and it is crucial to trade LIFO as a good part of your core position. The recent swings are a constant reminder of this simple rule.
4 – Margins and chart comparison
Marathon Petroleum declared a global R&M margin of $15.31 per Bbl based on throughput per region. Details below:
| Gulf Coast | Mid Continent | West Coast | Total |
| $16.14/per Bbl | $12.35/per Bbl | $19.99/per Bbl | $15.31/per Bbl |
Below is the chart indicating the revenues and the net income for the first quarter for Marathon Petroleum, Valero Energy, and Phillips 66.
MPC, VLO, PSX operating income comparison (Fun Trading)
The CEO Mike Hennigan said in the conference call:
We expect continued volatility in 2022 with an advantage for safe, reliable and low-cost operators. We are focused on optimizing our maintenance schedules to maximize uptime and allow us to do what we can to produce volumes to meet the market demand. As we do this, we remain steadfast in our commitment to safely operate our assets, protect the health and safety of our employees, and support the communities in which we operate.
Marathon Petroleum – Financials History: The Raw Numbers – First Quarter 2022
| Marathon Petroleum | 1Q21 | 2Q21 | 3Q21 | 4Q21 | 1Q22 |
| Total Revenues in $ Billion | 22.71 | 29.62 | 32.32 | 35.34 | 38.06 |
| Total Revenues and others in $ Billion | 22.88 | 29.83 | 32.61 | 35.61 | 38.38 |
| Net Income available to common shareholders in $ Million |
-242 |
8,512 |
694 |
774 |
845 |
| EBITDA $ Million | 1,042 | 1,782 | 2,161 | 2,463 | 2,546 |
| EPS diluted in $/share | -0.37 | 13.00 | 1.09 | 1.27 | 1.49 |
| Operating cash flow in $ Million | 454 | 1,380 | -1,148 | 3,674 | 2,513 |
| CapEx in $ Million | 304 | 302 | 377 | 481 | 495 |
| Free Cash Flow in $ Million | 150 | 1,078 | -1,525 | 3,193 | 2,018 |
| Total Cash $ Billion | 0.62 | 17.26 | 13.23 | 10.84 | 10.60 |
| Debt Consolidated in $ Billion | 32.61 | 28.32 | 27.34 | 25.54 | 26.71 |
| Dividend per share in $ | 0.58 | 0.58 | 0.58 | 0.58 | 0.58 |
| Shares Outstanding (Diluted) in Million | 651 | 654 | 637 | 605 | 568 |
| Operating Income per Segment in $ million | 1Q21 | 2Q21 | 3Q21 | 4Q21 | 1Q22 |
| Refining & Marketing | -598 | 224 | 509 | 881 | 768 |
| Midstream | 972 | 977 | 1,042 | 1,070 | 1,072 |
| Items not allocated in Segment | -157 | -180 | -186 | -173 | -161 |
Source: Company News
Analysis: Earnings Details
1 – Revenues and other income were $38.38 billion in 1Q22
MPC Quarterly revenues history (Fun Trading)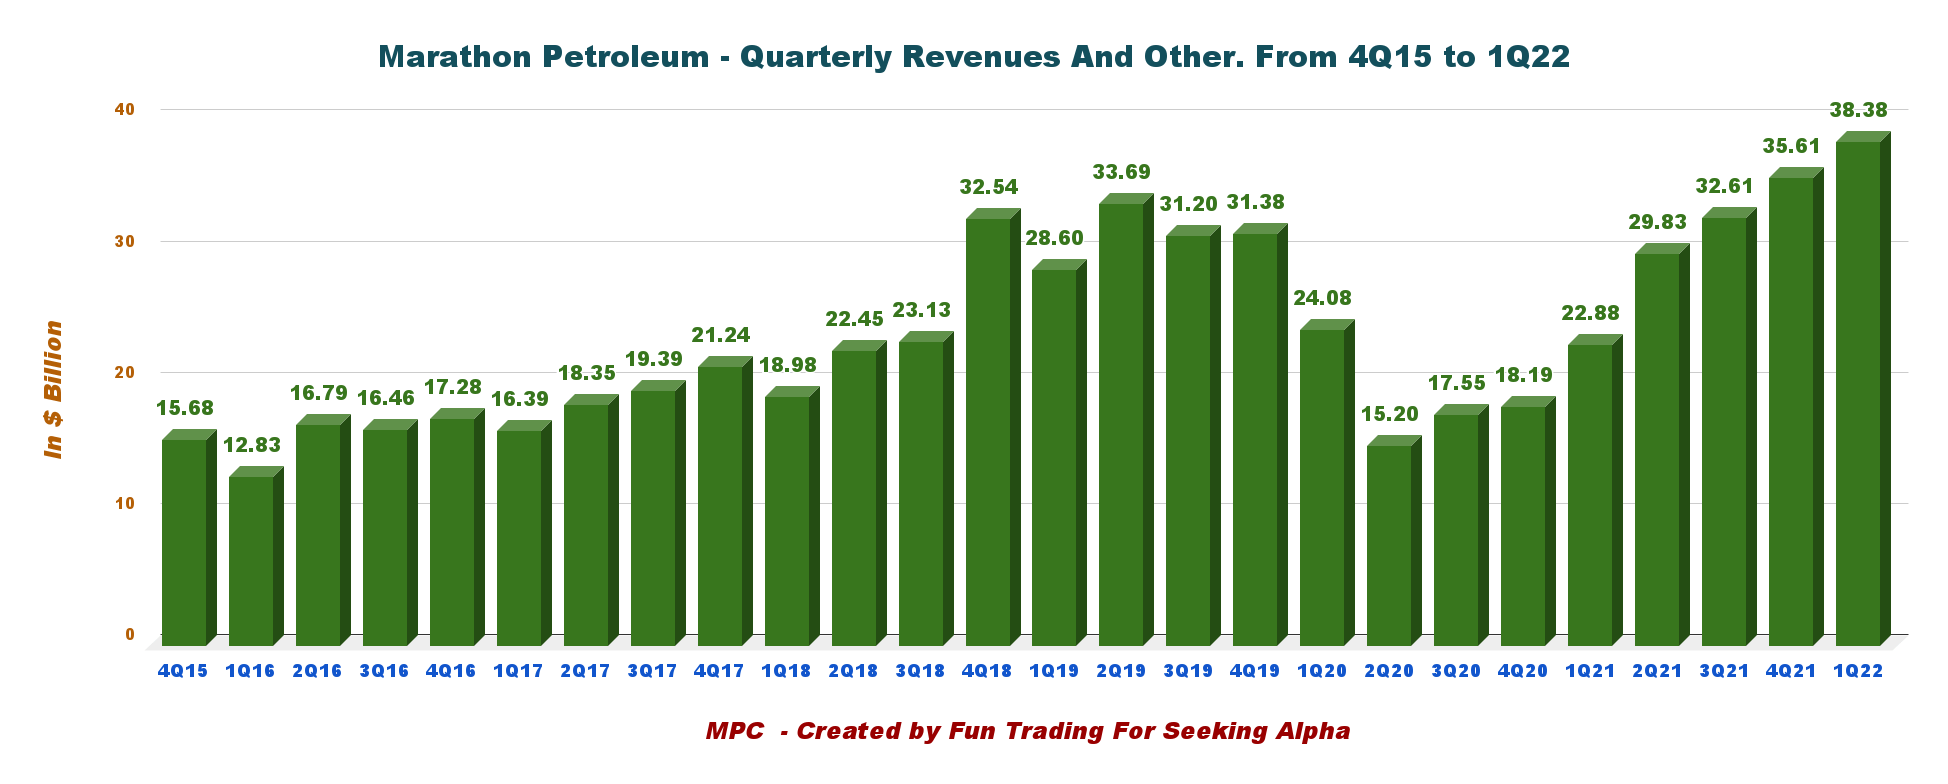
Marathon Petroleum reported a total income of $38.38 billion in the first quarter of 2022, up 67.7% from the same quarter a year ago and up 7.8% sequentially. Net income was $845 million or $1.49 per diluted share compared to a loss of $242 million in 1Q21.
Note: Basic Revenues were $38,058 million.
MPC reported adjusted earnings of $1.30 per share, beating analysts’ expectations. The operating income from the Refining & Marketing and the Midstream units totaled $768 million and $1.072 billion, respectively, beating expectations.
1. 1 – Refining & Marketing: The company reported an operating income of $768 million compared to a loss of $598 million in the same quarter a year ago. The significant improvement was due to higher year-over-year margins and throughputs. The refining margin was $15.31 per barrel in 1Q22 from $10.16 a year ago. Refining operating costs were $5.22 per barrel, up from $5.16 in 1Q21.
Below is the Refinery margins history:
MPC quarterly margins history (Fun Trading)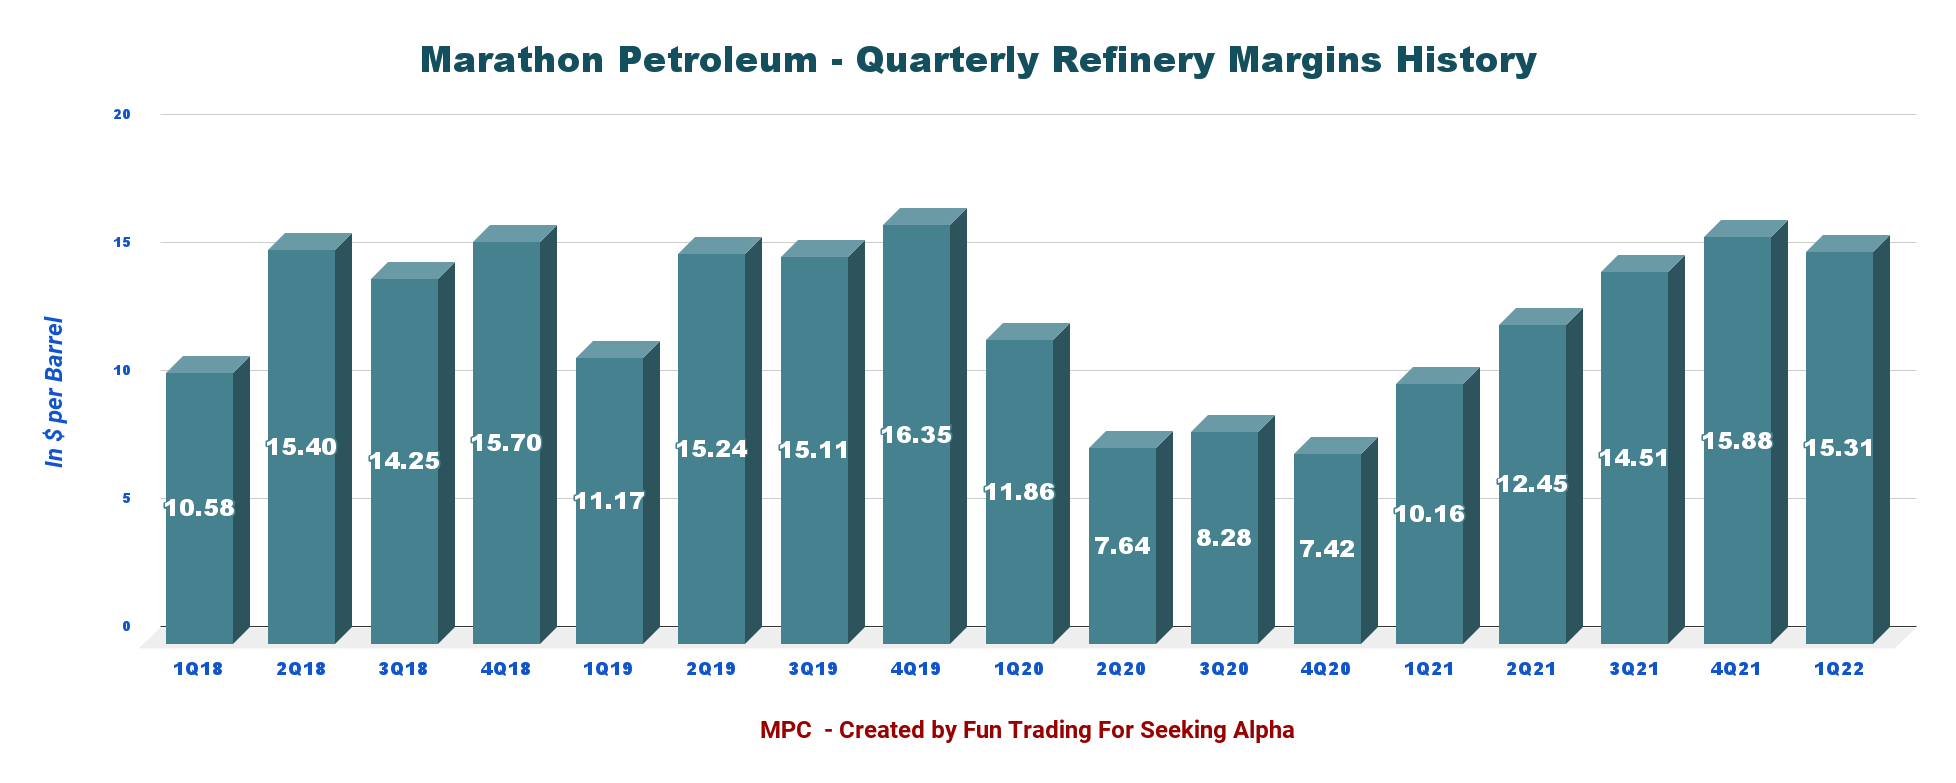
Total refined product sales volumes were 3,293K Bop/d, up from the 3,067K Bop/d in the year-ago quarter. Throughput increased from 2,565K Bop/d last year to 2,833K Bop/d. Capacity utilization during the quarter was 91% against the previous year’s 83%.
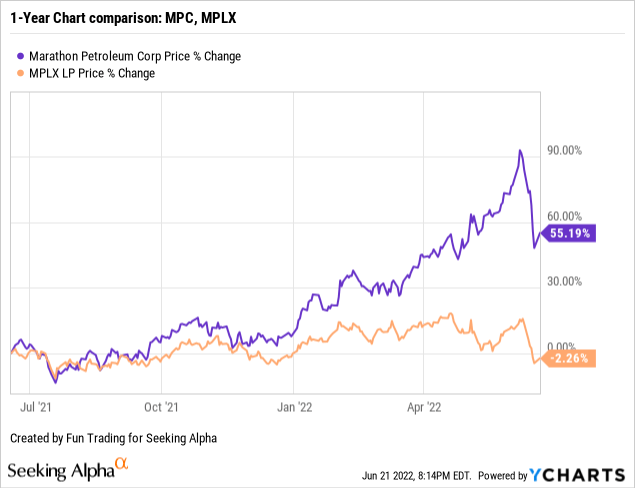
1.2 – Midstream:
Marathon Petroleum’s general and limited majority partners are MPLX (MPLX). Segment profitability was $1,072 million, up 10.3% from $972 in 1Q21. MPLX has largely underperformed MPC on a one-year basis. However, the company is paying a high dividend yield of now 9.74%.
2 – 2Q22 Outlook
MPC 2022 guidance (Marathon Petroleum)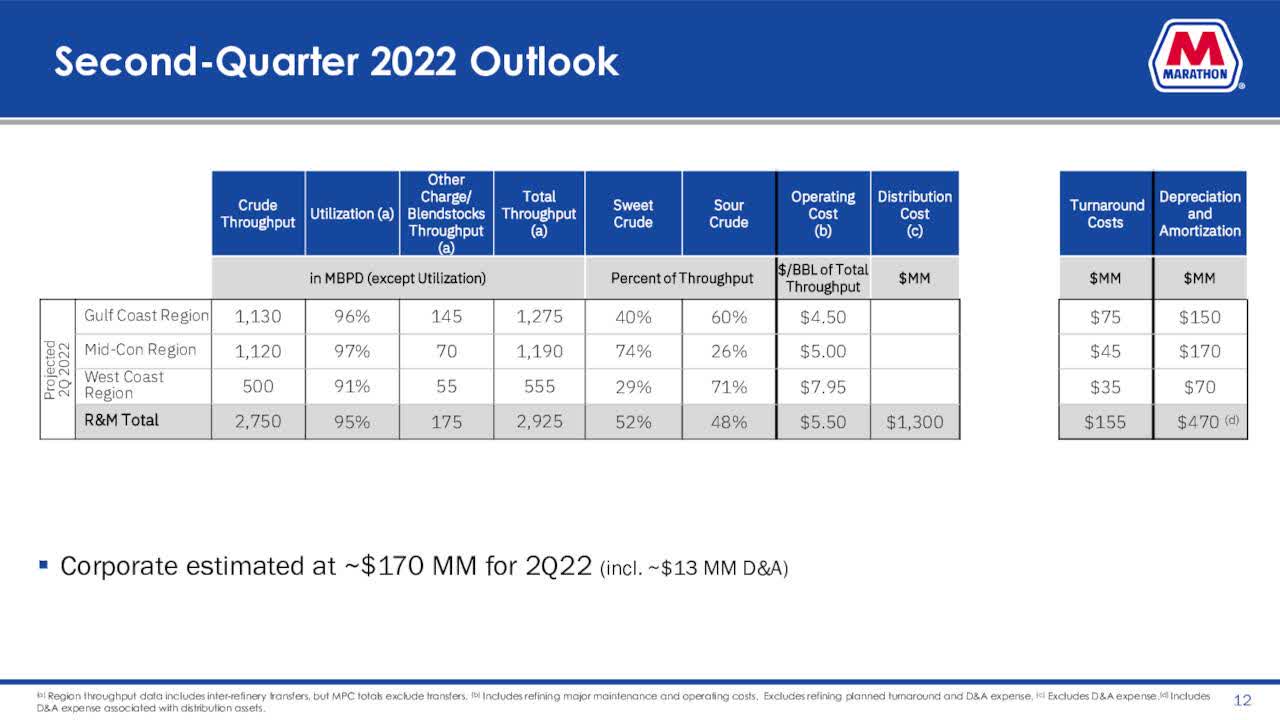
CFO Maryann Mannen said in the conference call:
We expect total throughput volumes of roughly 2.9 million barrels per day representing 95% utilization. Planned turnaround costs are projected to be approximately $155 million in the second quarter. Expected activity is relatively light and spread through all three regions.
3 – Free cash flow was $2,018 million in 1Q22
MPC Quarterly Free cash flow history (Fun Trading)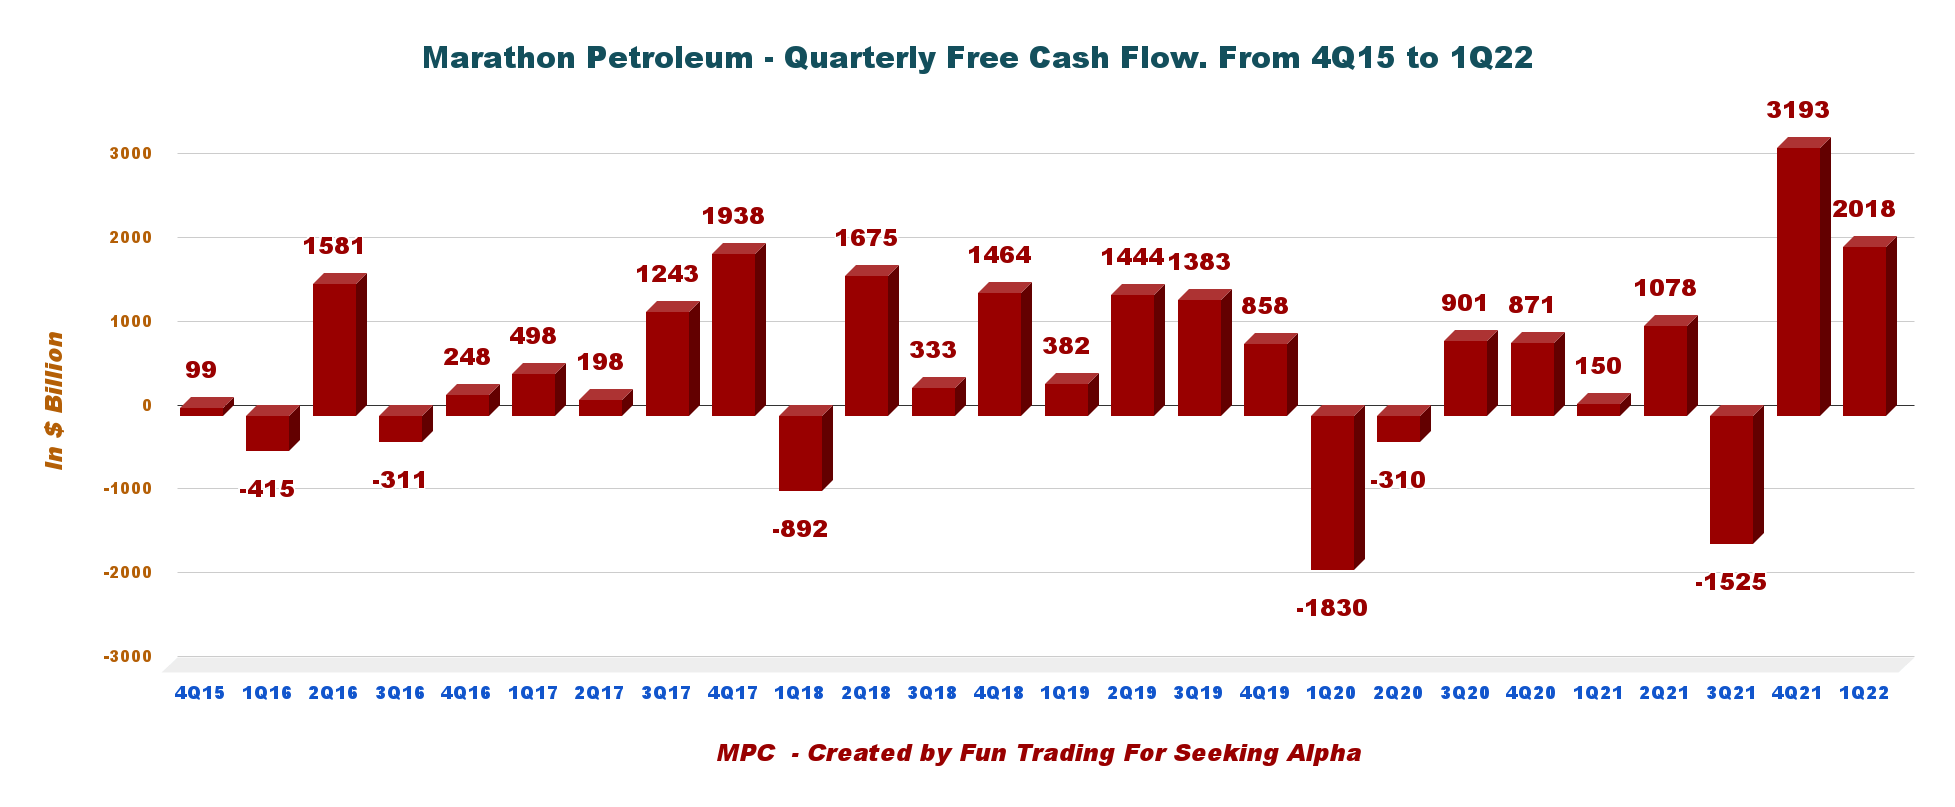
Note: Generic free cash flow is the cash from operations minus CapEx. The company has a different way of calculating it.
The trailing 12-month free cash flow was $4,764 million, with $2,018 million in 1Q22.
The dividend payout ($2.32 per share) is $1.32 billion annually, which is covered by Free cash flow.
The company said that since the last earnings call, the company has repurchased approximately $2.5 billion of company shares, and has completed, as of April 30, 2022, about 80% of the $10 billion repurchase program as part of its announcement to buy back $10 billion in common stocks following the sale of Speedway. The company has approximately $7 billion remaining under its share repurchase authorizations.
MPC repurchased $2,846 million worth of company shares in 1Q22.
However, I wonder how effective can be this share buyback program? The company is buying its shares at the high of the market instead of using the cash for CapEx or increasing the dividend payout. I favor buyback of shares only if the stock is below intrinsic valuation, which is not the case here.
4 – The total debt is $26.71 billion (consolidated) in 1Q22
MPC Quarterly Cash versus Debt history (Fun Trading)
Note: The graph above indicates the debt on a consolidated basis.
As shown below, the debt is $6.953 billion on a standalone basis, with a debt to capital ratio of 22% and 46% on a consolidated basis. Total cash is $10,597 million (MPC standalone cash was $10,555 million).
The company debt to revenue ratio is 0.18, which is good but still high compared to VLO with 0.06.
MPC Debt and liquidity (Marathon Petroleum)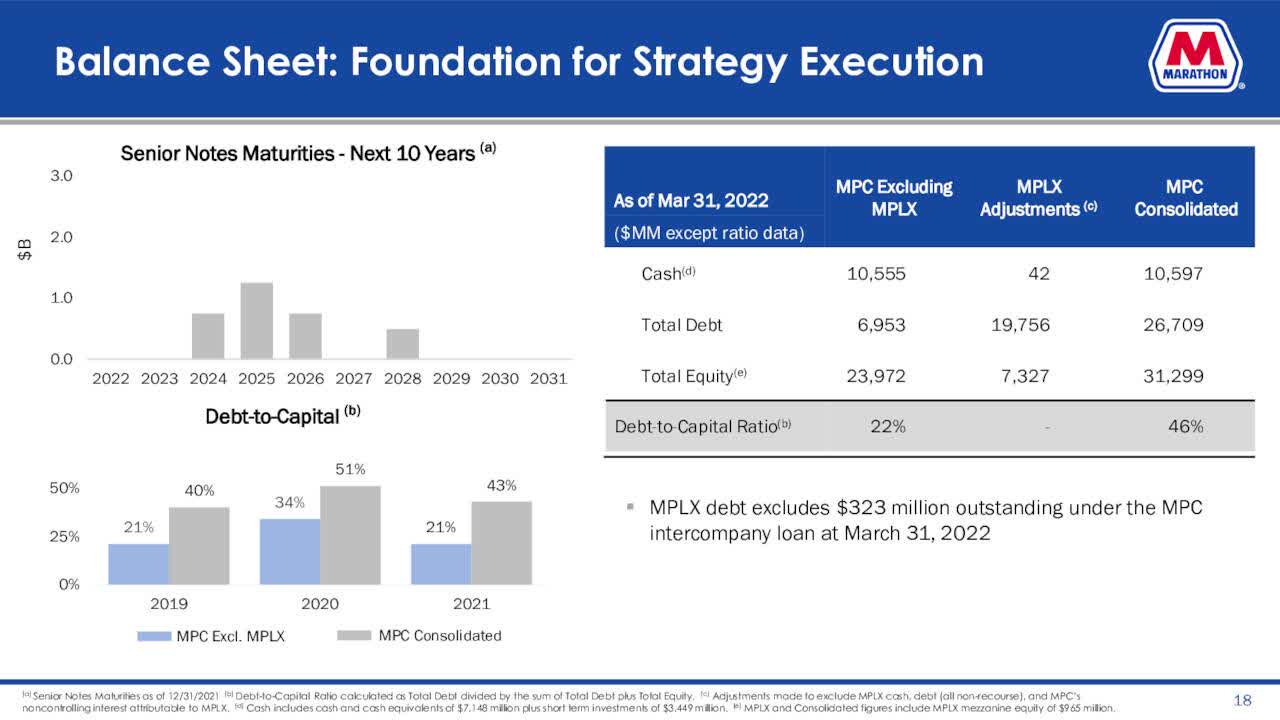
Note: Fitch Affirms Marathon Petroleum Corp. at ‘BBB’; Outlook Stable
MPC’s ratings reflect the company’s status as the largest independent refiner in the U.S. with a high-quality, flexible asset base; evidence of ongoing improvement in the macroeconomic environment for U.S. refiners; MPC’s business diversification through its ownership of MPLX; and the impact of recent MPC parent level debt repayments.
Technical Analysis (Short Term) and commentary
MPC TA Chart short-term (Fun Trading)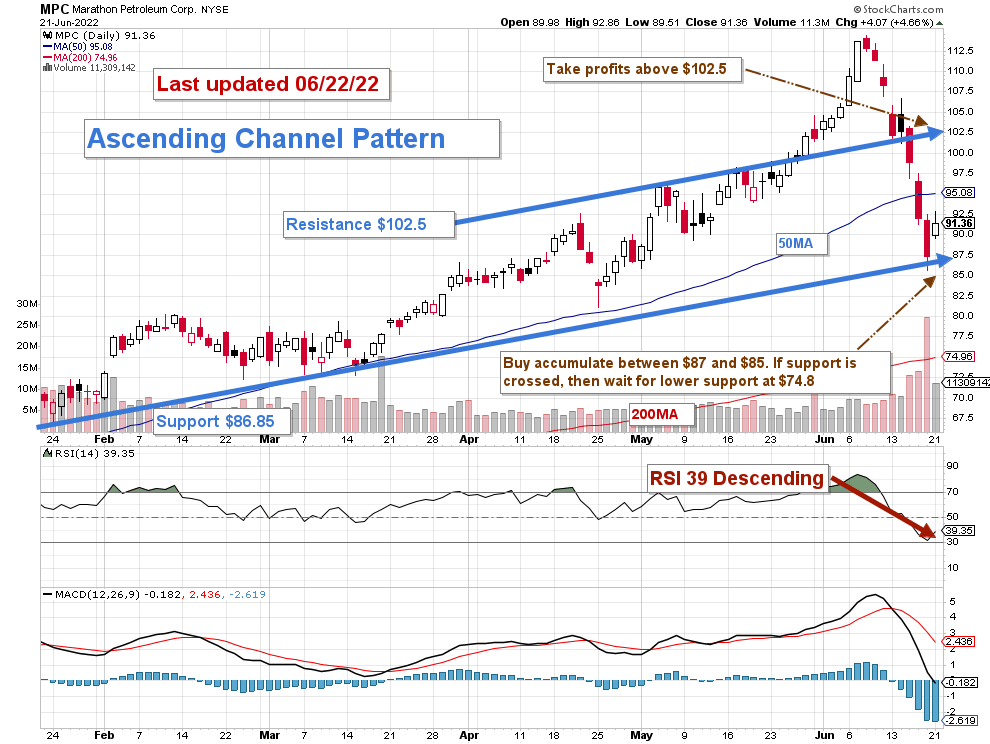
Note: The chart is adjusted for the dividend.
MPC forms an ascending channel pattern with resistance at $102.5 and support at $86.85.
The trading strategy continues to be the same. I recommend trading short-term LIFO about 30% of your total position and keeping your long core position for a much higher target while enjoying a substantial dividend.
It has worked wonders for me, especially during exceptional situations that seem to recur faster in the past few years.
The recent unpredictable downside of the oil market is another reminder of how important it is to trade part of your position to be on top of the situation and make a valuable profit while keeping your long position.
Thus, I suggest selling above $102.5 with a potential higher target at $113, assuming a return of the favorable conditions we had experienced recently. Conversely, the risk of a deep recession triggered by the Fed’s hikes and an economy starting to slow down under painful inflation affected MPC last week and turned the stock attractive again. Thus, I suggest accumulating below $87 with potential lower support at $74.8.
Warning: The TA chart must be updated frequently to be relevant. It is what I am doing in my stock tracker. The chart above has a possible validity of about a week. Remember, the TA chart is a tool only to help you adopt the right strategy. It is not a way to foresee the future. No one and nothing can.
Author’s note: If you find value in this article and would like to encourage such continued efforts, please click the “Like” button below as a vote of support. Thanks!
Be the first to comment