

artiemedvedev
Bitcoin (BTC-USD) and the stocks related to it have been performing quite nicely since the bottom was hit during the summer. This group is ultra-risky but, because of that, it also presents nearly endless opportunities for trades on both the long and short side.
One company in the space that I believe has started a new uptrend is Marathon Digital (NASDAQ:NASDAQ:MARA), which bottomed at five bucks in July, but sits at nearly 3X that level today. There are plenty of naysayers on crypto, and maybe they’re right, but I choose to follow price action and it’s telling me Marathon is an attractive long right now.
I last covered Marathon back in July, when I said the stock was in the midst of a short squeeze. The stock eventually ran to $18, but in true short squeeze fashion, it fell back to earth nearly as quickly. Now, instead of a short squeeze, I just see a stock that has a shot at a very strong setup technically, and fundamentally.
StockCharts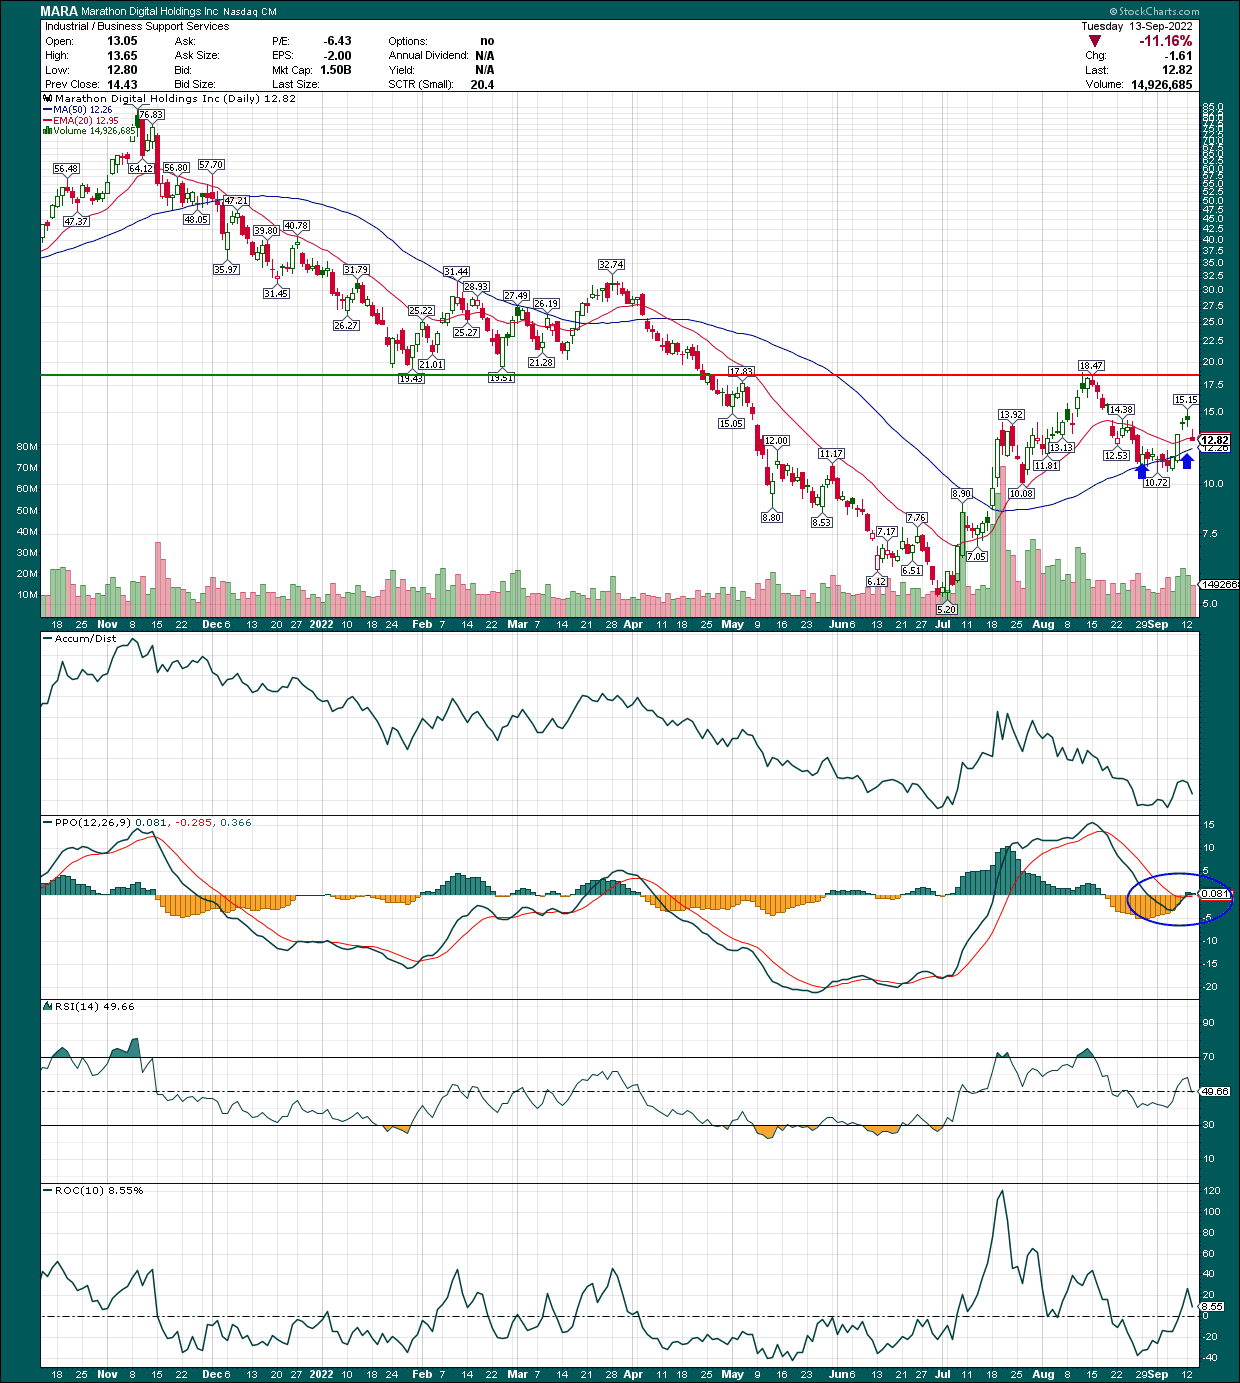
Let’s start with the daily chart of Marathon, which shows a very strong rally from the summer lows. Very importantly, the 20-day exponential moving average and 50-day simple moving average are both sloped sharply higher, which is a great sign. Those tend to become support on rallies when they look like this, so that’s one feather in the cap of the bulls.
Next up, the PPO is showing a sharp turn higher right near centerline support, which again, is a great sign for the bulls. As the PPO turns higher, it shows that bearish momentum has ended for now and that means the bulls have the upper hand.
Third, the current price is already ahead of the relative high that was set back in July, so that resistance level was taken out without any real drama. That leaves the next upside objective at $18/$19, which is combination resistance from the recent high, as well as relative lows from earlier this year. That level is likely to prove much more difficult to break through, so if you get long Marathon, consider taking profits there on the anticipation of a small pullback.
Now, for the very short-term, Marathon is quite overbought. The 10-day rate of change in the bottom panel shows +27%, which simply means the stock has soared that much in a two-week span. That’s a massive rally for any stock in such a short period, so don’t be surprised to see a pullback. That’s when you want to strike, as the stock has both the 20-day EMA and 50-day SMA as potential support. The former is ~$13, and the latter is just over $12, so those are two levels to watch on pullbacks.
On the whole, this chart looks quite bullish considering higher lows and higher highs that are accruing. Keep in mind also that short interest remains very high for Marathon, so if we get a breakout over the recent high at $18, look out above. That’s not a primary reason to buy this stock, but it will almost certainly help if there’s a breakout in terms of fueling the upside move.
Below I’ve plotted the 250-day correlation of Marathon to Bitcoin itself, to show how they tend to move in tandem. This time period corresponds to one year of trading activity, so it’s a longer-term measure. On shorter time frames, you can see Marathon temporarily decouple from Bitcoin, but over time, they tend to move in the same direction. The past year has seen correlation of 0.94, so it’s almost perfect.
StockCharts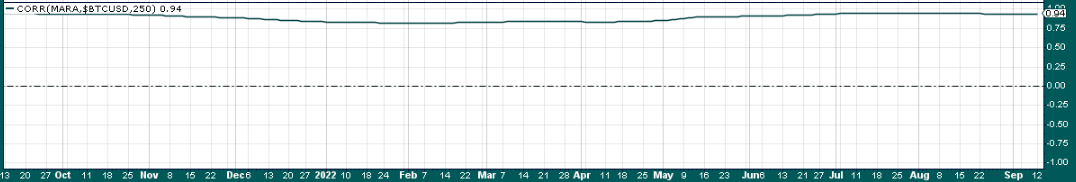
Given this, it makes a lot of sense for us to evaluate Bitcoin to see where that may go next, because as this correlation shows, if Bitcoin moves one direction or the other, it is likely to take Marathon with it.
I said back in June that Bitcoin had bottomed when it spiked to $17.6k, and that low has not been violated since. I was confident in June that Bitcoin had bottomed, and I’m still confident now. I don’t currently see any evidence that low is going to be violated, so I’m operating on the assumption any pullbacks will remain ahead of that level. I could be wrong, and if so, I’ll reevaluate when/if that happens. But for now, the June low appears to me to be the low, and I’m sticking to that call.
StockCharts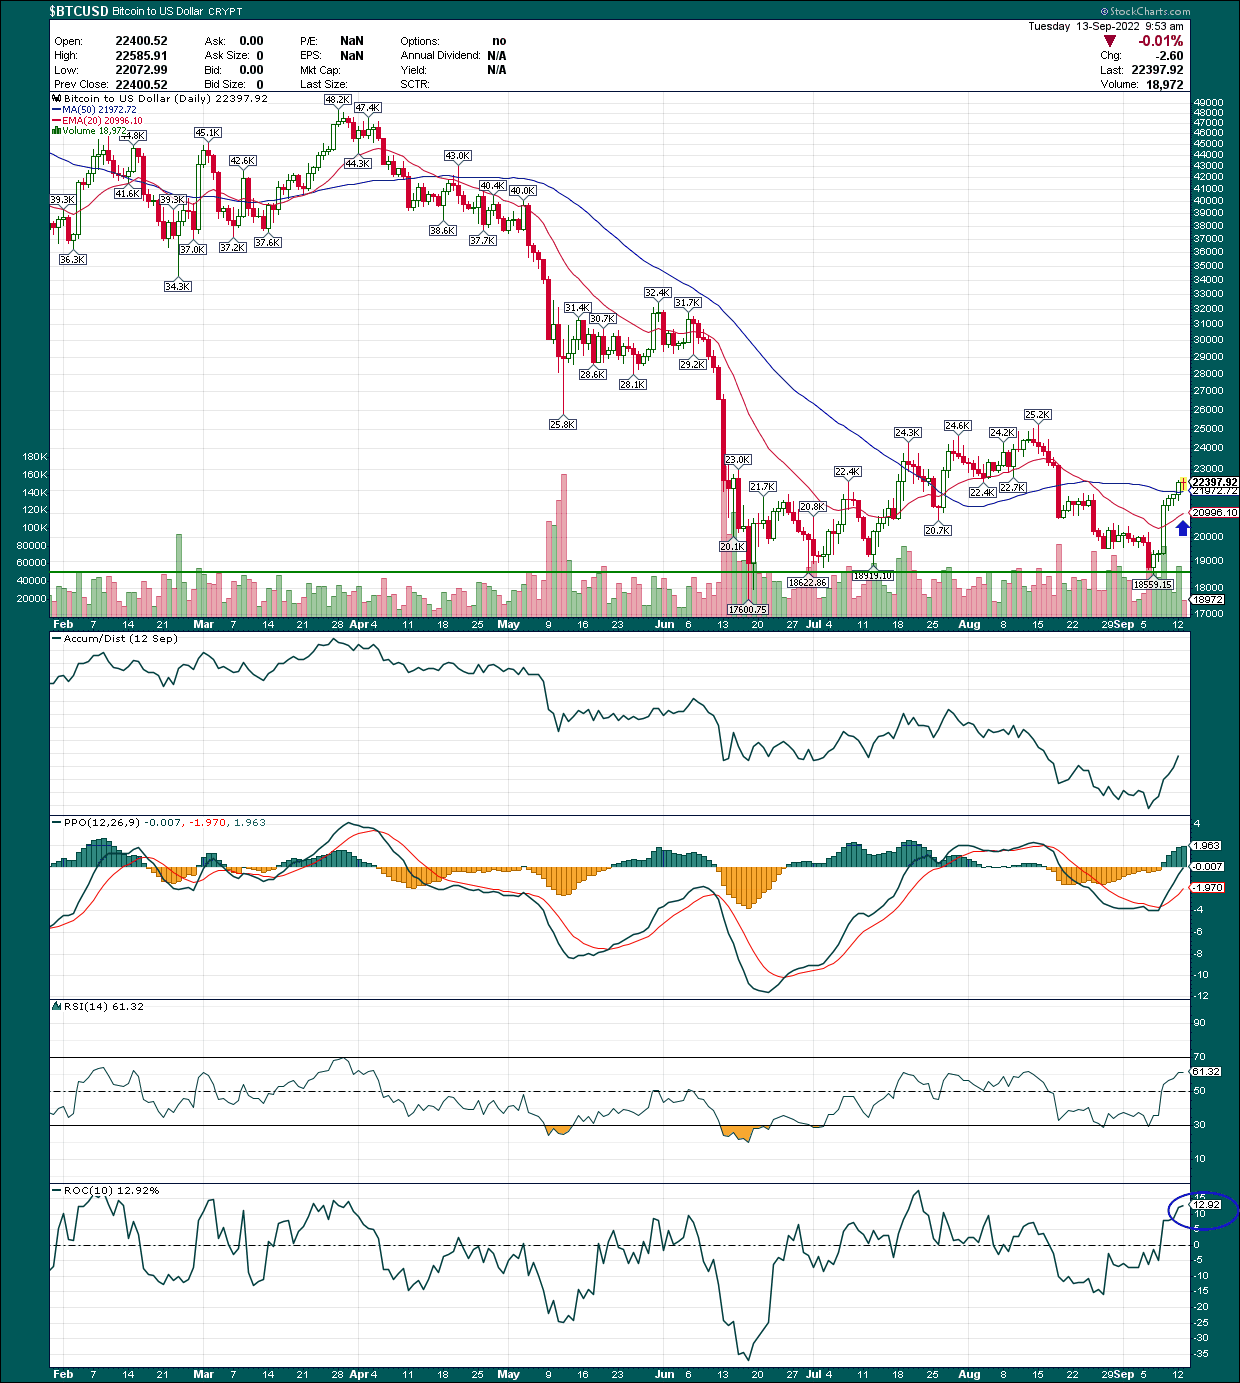
We can see there’s good price support on the coin itself at the $18.6k level, give or take, and that’s been tested three times now. That’s the line in the sand for me on Bitcoin, because if that level is violated, it drastically increases the odds of a further breakdown to a new low. But look at how the coin acted once it tested that level a few days ago; it has absolutely rocketed higher. I can hear the groans of crypto haters in the comments now about how Bitcoin is worthless and it’s all a scam, but there’s a huge amount of money moving this coin around, so I’m following that rather than emotion or personal vendettas against an asset class.
Bitcoin is back above the 20-day EMA and 50-day SMA, the same as Marathon. In addition, the PPO is rising sharply and is cresting the centerline, which is a key trait for a sustainable rally.
The only caveat is that, like Marathon, Bitcoin is overbought in the short-term. The coin could use a little breather, so don’t be surprised if we get that. I think that would be healthy, rather than a sign of a breakdown, so long as support levels and moving averages are respected during the pullback. Selloffs and pullbacks have different looks to them, so it should be pretty obvious when it starts which one it is.
Let’s now take a longer-term look at Bitcoin’s path with a weekly chart.
StockCharts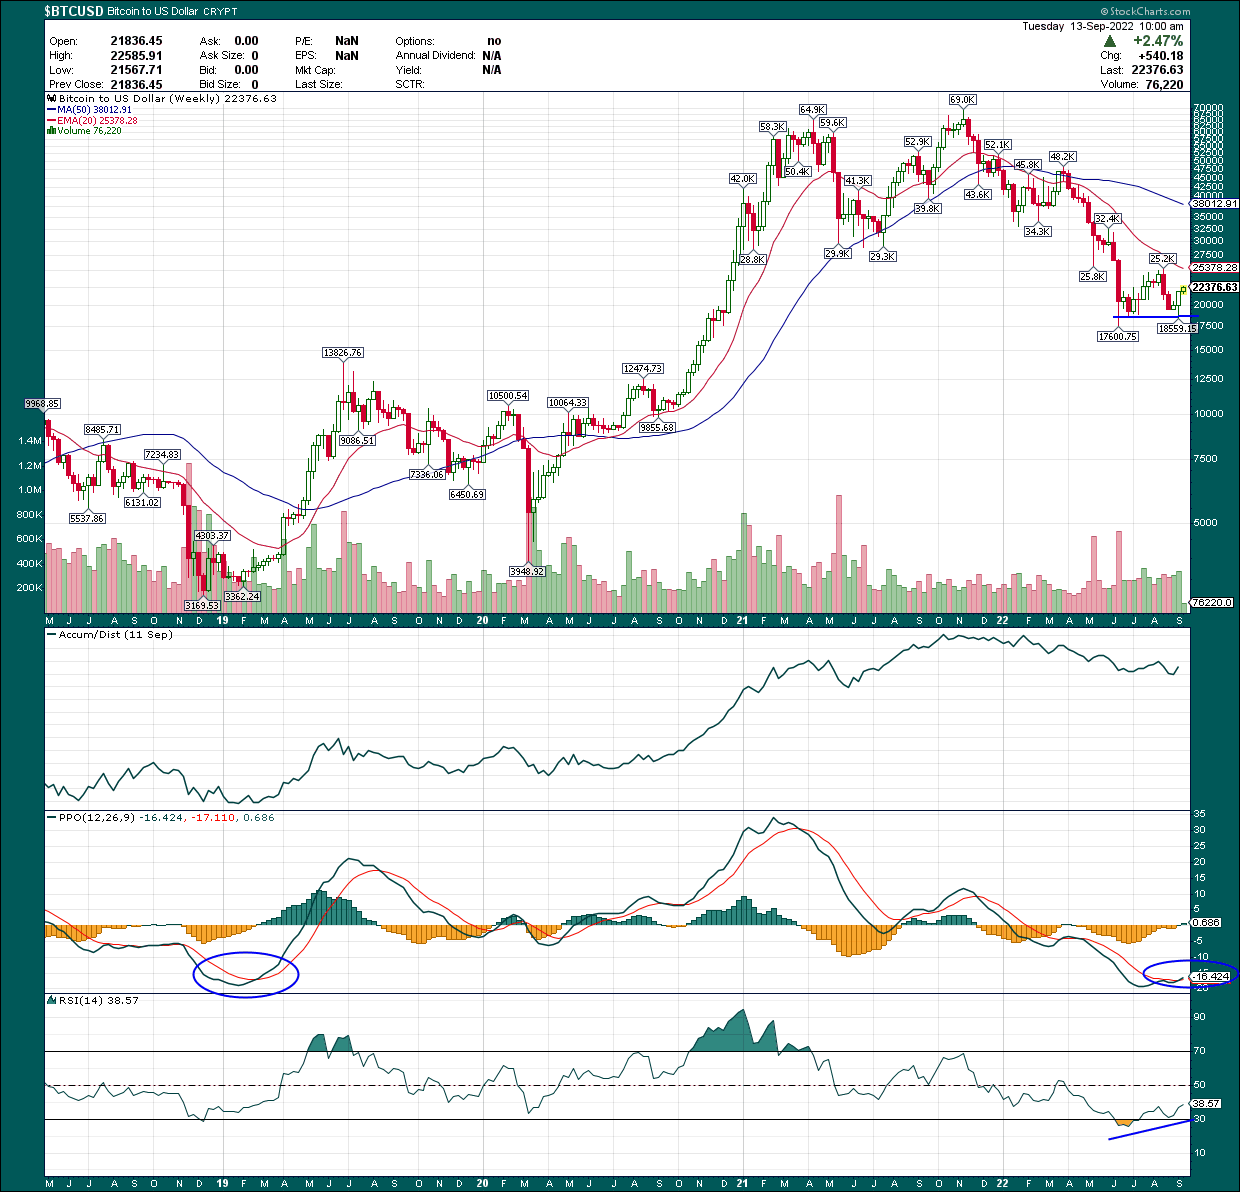
We can see here that the 14-week RSI showed a big positive divergence between June and September, as price tested lows but the RSI made a much higher high. We can also see the weekly PPO produced a turn such that the short-term line has crossed the long-term line in a bullish manner, which you can see using the histogram. The PPO is also at -16, which is not only unbelievably oversold, but is also where the coin turned higher from its last bear market. The point being that while Bitcoin looks a little overbought on the daily chart, for me, the weekly chart is confirming the odds that this is a start of a new rally, rather than a bear market bounce.
Fundamentals remain favorable
Marathon is all about two things: its ability to mine Bitcoin, and the value of Bitcoin itself, which drives the book value of the company’s holdings. We’ve covered the future path of Bitcoin, which heavily influences the second factor, but I think there’s cause for optimism on the first one as well.
Marathon’s August production update reiterated that the company continues to grow its production quite nicely, which now stands at 3.2 exahashes per second. That’s fine, and it puts Marathon towards the top of the pack in terms of mining capacity. However, what’s intriguing is forecasts for future growth once Marathon gets all of its machines up and running.
The company’s CEO said he expects 6.9 exahashes per second by the end of this year, and 23 by the end of next year. That’s a tripling of capacity in three months, and a further tripling after that in the subsequent 12 months. Those are ambitious targets, but if Marathon can get anywhere near them, there’s a tremendous amount of growth ahead.
That’s not the only reason to like the stock, however, because, it is quite cheaply valued today. Below is price-to-tangible-book, which is simply the market cap divided by the theoretical cash value of the company’s assets. Those assets, obviously, are largely in the Bitcoin holdings the company has today, so it’s a decent valuation method for a Bitcoin miner.
Seeking Alpha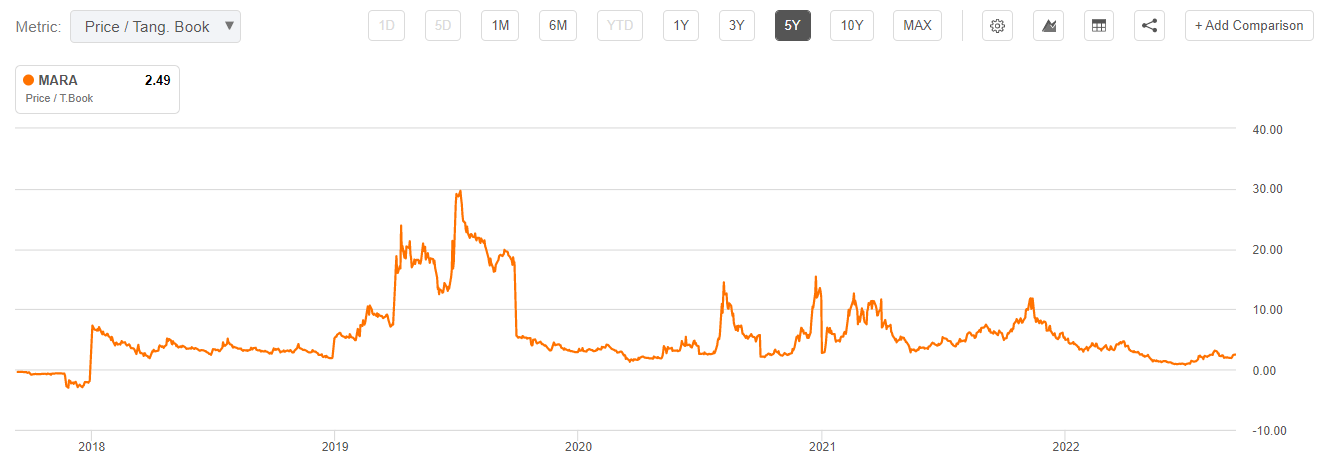
Today, shares trade for 2.5X tangible book, which is very cheap based on the bull market valuations we’ve seen for Marathon in the past. In other words, the stock is still trading at a bear market valuation that, to my eye, assumes Bitcoin isn’t in the midst of starting a new bullish phase. Thus, if I’m right, Marathon should not only be able to mine a lot more Bitcoin in the relatively near future, but the value of each coin will be higher, and the value that investors are willing to pay for each coin should be higher. That’s a virtuous combination that could lead to some truly outstanding gains for the share price.
Final thoughts
While it is true that I see the setup for Marathon as quite favorable today, it is not without its risks. The company’s investments in future growth have produced a lot of leverage on the balance sheet. Marathon had a net cash position of $338 million a year ago, but today it’s a net debt position of $680 million, a swing of more than a billion dollars in the wrong direction. If the company’s investments work, none of that will matter. If they don’t, Marathon could be in for a world of pain where it has to liquidate Bitcoin to pay off debt. For that to happen, you’d need to see another prolonged bear market for Bitcoin. Is that possible? Of course, anything is possible. Is it likely? Not based on what I’m seeing, but it’s a risk worth calling out.
Apart from that, you have a stock that is relatively cheaply valued, has a huge growth runway in front of it, and looks to benefit from what I believe is a new bullish phase in Bitcoin. If I’m right, the stock is going to be much, much higher a year from now than it is today. If I’m wrong, you can stop out for a small loss under the 50-day SMA.
I’ll look to add Marathon on a test of either the 20-day EMA or 50-day SMA (or possibly both), with a stop under the 50-day SMA. Upside targets are $18 initially, and if that’s broken, prior highs at $31/$32 are next up.
Be the first to comment