

undefined undefined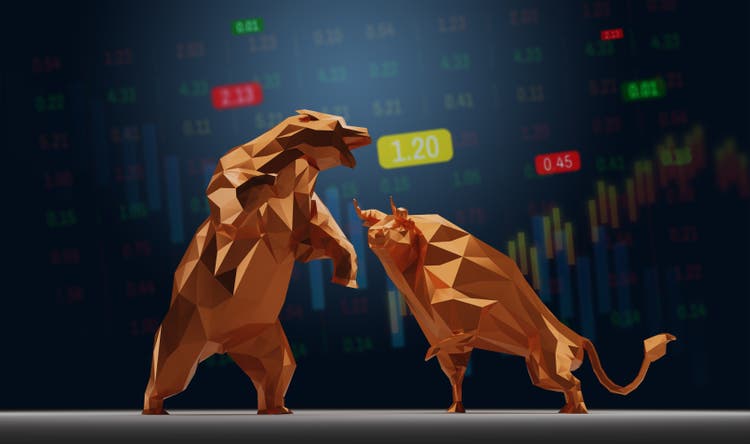
Manole Capital Management
2nd Quarter 2022 Investor Newsletter
July 2022
Proprietary Research:
We hope this finds you well and that you are enjoying your summer. While Tampa isn’t the hottest place on the earth, it sometimes feels like it, with our unpleasant 70% humidity levels. We hope you have an opportunity to do some travelling and escape any uncomfortable weather conditions.
As we normally do in our quarterly newsletters, we will review and address some recent macro issues, like inflation, interest rates, the Fed, jobs, investor sentiment and recessionary fears. Then, we try to discuss the implosion of crypto currencies and how we see regulation impacting that industry going forward.
Our quarterly research note isn’t going to criticize the Fed for its prior decisions. Instead, we want to discuss how certain companies (i.e., payment companies) benefit from higher prices and inflation. We remain disciplined and true to our bottoms up, fundamental investment approach. When the media panics, we find it better to turn off or mute the TV and spend our time doing FinTech and company specific analysis. In this current period of elevated uncertainty, we have stayed true to our research-intensive process.
Over the next week or so, we will be publishing a stock-specific note on payment processor Global Payments (GPN). We have owned GPN for nearly two decades and it currently is one of our largest positions. We will begin by highlighting recent spending trends, eCommerce developments and how many of our payment companies can actually benefit from inflation and higher costs. We will discuss their business, industry trends, what is driving their growth, and then highlight their compelling valuation.
Lastly, over the next month or so, we will publish the results of our latest Gen-Z financial services survey. This is the 5th year that our interns will write and publish their thoughts on various financial and FinTech implications impacting the Gen-Z generation. Our notes will cover four distinct topics: payments, banking, brokerage, and cryptocurrencies and the prior year’s notes can be re-read by simply searching inside of Seeking Alpha.
Introduction:
While we don’t want to oversimplify things, we saw this recent quote from economist Richard Bernstein and found it both comical and insightful. He said, “There are a bazillion things going on, but there are two certainties: The Fed is going to tighten, and profits are going to decelerate.” While we agree, we think some additional thoughtful commentary (and detailed analysis) is warranted to discuss our forward-looking expectations.
Inflation is the biggest topic concerning the market and we will spend a considerable amount of this newsletter addressing its impact. We recently saw this picture of former Fed Chairman Paul Volcker and thought it perfectly captured the inflationary environment of the late 1970s and early 1980s. If there ever was a picture that perfectly shows the economic conditions during a period of time, it might be this.
Paul Volcker (federalreservehistory.org)
Not only is the look on his face filled with annoyance for having to endure endless Congressional questioning, but he gave his testimony with a cheap and unlit cigar in his hand.
Just classic!
1st Half of 2022:
Over the last few years, investors favored equities with a TINA (there is no alternative) approach. So far this year, stocks, bonds, crypto and nearly every asset class (outside of commodities) has struggled.
During the 1st half of the year, the S&P 500, our best indicator of the US stock market, was down (21%). This was its worst start to a year since 1970. This decline represents a loss of roughly $9 trillion of wealth, from the January 4th market peak. To put this amount into perspective, it more than offsets the impact of fiscal and monetary COVID-19 stimulus. Also, these market losses are a trillion dollars more than what was lost during the Financial Crisis.
So far this year, the DJIA fell (15%), which was its worst start to a calendar year since 1962. The Nasdaq is now down (30%) from its high in November of 2021, but the declines aren’t just in equities. Bonds have typically been an effective hedge against equity market declines, but this negative correlation has also broken down. The Bloomberg US Aggregate, a broad representation of fixed-income securities, fell nearly (11%) year-to-date and this was the worst start to a year since 1975. Even US Treasuries, often considered the epitome of stable investments, was down (18%) through the first four months of the year.
The largest component of the S&P 500 is the Tech or IT (information-technology) sector, at 27% of the total index. Unfortunately for tech investors, this sector has fallen by over (27%) so far this year and it is its worst start to a year since 2002. However, many tech names are +20% higher than they were pre-pandemic, which just signals to us that the market is repricing some of the outrageous gains posted in the second half of 2020 and 2021. Even worse than Tech, the Consumer Discretionary sector (at 11% of the S&P 500) was down (33%) this year. Other than Energy (only 4% of the S&P 500), which is up over +32% this year, there have been few places to hide. One cannot ignore that US stocks climbed more than +100% from the COVID bear market lows, which just means this current retracement, while painful, does not make equity investors worse off than two years ago.
2nd Quarter and 2nd Half 2022 Expectations:
With the strength of the US dollar, it will likely cause some additional headwinds for S&P 500 earnings. For the first time in two decades, the US dollar reached parity with the euro. A strong US dollar makes imports of foreign goods cheaper for US consumers and companies, but also makes our exports less competitive. According to Yardeni Research, the +11% rise in the dollar this year will equate to S&P 500 profits falling by over (4%).
2nd quarter 2022 results just getting released now, sell-side analysts have been racing to get in front of these expectations. Over the last month, sell-side analysts have downgraded more than 500 names, which exceeds the rating changes experienced during the Financial Crisis. Not only are analysts cutting their ratings, but they are lowering their forward-looking revenue and earnings expectations. However, by lowering estimates, it makes it easier for companies to then beat a low bar.
According to Zacks Research, S&P 500 companies will generate +9.7% higher revenues, but only +2.1% higher earnings. If we exclude the positive Energy sector from these expectations, the S&P 500 companies will generate +7.4% higher revenues, and experience earnings declines of (6.1%). Clearly, the Energy sector remains the growth leader of today.
At this point, only 10% of companies in the S&P 500 have reported 2nd quarter results. Later this week, we will get several other big technology earnings reports, from companies like Microsoft (MSFT), Alphabet (GOOG, GOOGL), Meta (META), QUALCOMM (QCOM), Apple (AAPL), Intel (INTC), and Amazon (AMZN). In addition, over the next month, we will get over 1,000 publicly traded companies reporting results. Why are the big technology companies important to monitor for a FinTech -specific manager? Well, as we all know, the largest companies in the S&P 500 are dominated by the technology sector. The top 20 stocks, by earnings contribution, are expected to determine 35% of 2nd quarter’s total index earnings and the top 50 companies comprise 53% of the index’s earnings.
Profit margins are expected to compress by nearly 100 basis points, as certain businesses just do not have pricing power. It is during these volatile periods that knowing what you own and why you own it are critical. Do your companies have a “wide moat around their franchise” and strong barriers to entry? Are they market leaders with durable competitive advantages? Are they able to raise prices and withstand this market volatility?
Comparing our long-only portfolio (represented by our Flagship FinTech portfolio – click here for our latest tear sheet) to the S&P 500, over the last 5 years is insightful. Over the last 5 years, our Flagship FinTech portfolio has generated 3x the top line growth of the market (21% vs. 7%) and more than 2x the earnings growth (27% vs. 12%). More important than looking backwards, our Flagship FinTech portfolio is expected to continue to outgrow the market. Using 3 to 5 year forward EPS estimates, our portfolio is expected to generate 21% growth, roughly 2x the S&P 500.
From the analysis we have done so far, there does not appear to be anything that would lead us to believe that there is an imminent economic slowdown coming. Are there headwinds and pressures? Absolutely, but nothing that screams recession to us. We think the overall picture emerging from earnings season is fairly positive and isn’t consistent with an economy heading into a downturn.
Valuations:
There is an astounding amount of cash sitting on the sidelines, just waiting for the market to bottom. At Bank of America (BAC), owner of Merrill Lynch, its private clients have 12.6% of their assets in cash. At Charles Schwab (SCHW), the percentage of client accounts sitting in cash is 12.8% of $6.8 trillion.
Household finances remain historically strong. At the end of the 1st quarter of 2022, Federal Reserve data shows that households had $18.5 trillion in cash in checking, savings, and money market funds. For perspective, before the pandemic, that figure was $13.3 trillion. The problem remains, there’s no bell that rings when we reach that elusive market bottom.
The 25-year average median S&P 500 P/E is 16.0x, which is essentially equal to today’s 15.6x. As we continue to highlight in our research, we are less focused on overall market multiples and instead analyze each company on its own merits. The key issue with fundamental research is whether or not the “E” or earnings projections have more upside growth ahead or do estimates need to come down.
In terms of valuation, most everything we analyze is significantly cheaper than it was 6 or 12 or 18 months ago. While certain investors are bracing for another crash, others (like us) are beginning to take advantage of this market weakness. While we aren’t “leveraging the farm” to buy some of our favorite names, we are selectively adding to those beaten down companies now trading at attractive valuations.
The key (at least for us) is to understand what the earnings and free cash flow will be for these companies, over the next 12 to 24 months. We employ scenario testing and model out various economic conditions to understand what results will look like. We can then better understand what we are paying for, and whether the economy is better or worse than expected. Current market expectations are just well-educated guesses, and we prefer to place probabilities on various scenarios. This allows us to understand and assess downside risk, as well as upside opportunity in these uncertain times.
Bear Markets:
Big stock downturns are unfortunately quite normal. Since 1950, the S&P 500 index (i.e., the market) has fallen by more than (20%) on 10 different occasions. For example, during the last extended period of US inflation, the market fell (43%) from December 1972 to September 1974. During the Dot Com implosion, S&P 500 fell another (45%) and from November 2007 through February 2009 (during the Financial Crisis), the market fell by over (50%). More recently, during the COVID-19 shock, the market declined over (30%) in a little more than 1 month, from February to March of 2020.
We don’t raise these bearish performance results to be overly pessimistic. We simply want to frame the environment and current market sentiment.
This Zacks Research chart shows how the S&P 500 has historically performed following a bear market. The median 12-month return for the S&P 500, following a bear market, has been +24%.
Bear Mkts (Zacks Research)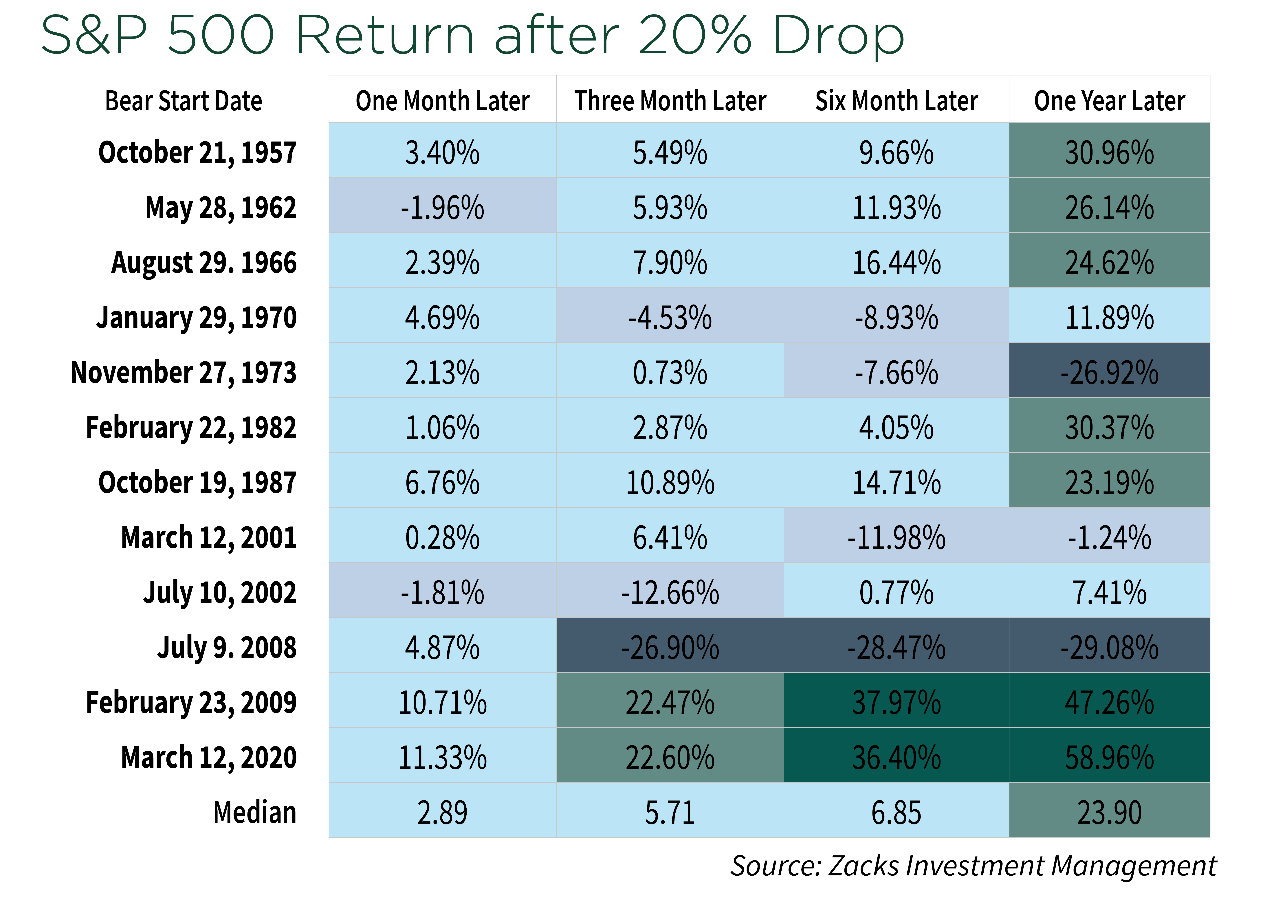
On average, stocks decline by (36%) during a bear market. This pales in comparison to the +114% that is gained during the average 2.7-year long bull market.
Even with the losses experienced this year, we still are above the gains generated last year. Clearly bull markets are longer and stronger than the average bear markets. While one can never know how long this bear market will last, we do know that weak markets have almost always been followed by excellent periods of returns.
Market Timing:
The world is dealing with multiple geopolitical risks, soaring commodity costs, sky-high inflation, all while the Fed is pushing through a round of monetary tightening policies. A year ago, the S&P 500 rose +28% and the market was anticipating a “return to normal”, following a couple of years of a global pandemic. Instead, uncertainty grips the market, as Ukraine defends itself against a hostile Russia and energy costs climb. All of these macroeconomic headwinds are worrying the stock market and posing a series of systemic challenges.
What makes bear markets so challenging and unbearable? Well, history has proven that nobody is able to market time and predict when bear markets will end. This doesn’t stop the experts from making grandiose predictions, using proprietary measures and hunches, but the truth is nobody knows – not even the “experts” on TV.
Selling your stocks and waiting for confirmation of a new bull market will almost certainly mean that you’ll miss the first several months of that new bull market. Looking backwards, roughly 1/3rd of the market’s best performance days has taken place in the first two months of a new bull market (which is obviously only known with the benefit of hindsight). Want more evidence that market timing doesn’t work? Over the last 20 years, 70% of the stock market’s best days have occurred within two weeks of its worst days. Obviously, during periods of volatility, trying to perfectly time entry and exit points is challenging.
In our opinion, it is impossible to time the market. History shows that investors do not want to be “left on the sidelines” when a surprising rebound occurs. Since 1974, the S&P 500 has increased an average of +8% one month after a correction bottom, and more than +24% a year after a correction bottom. Looking back even further, to 1928, the market has experienced 26 bear markets and 27 bull markets. Interestingly, these bull markets have always recouped prior bear market losses. Over the last 94 years of stock market history, bear markets have taken up only 21 of the years, while bull markets have been the other 78%.
We do not know when a new bull market will begin. Will a recession come in 2022 or 2023? We truly have no idea, but we do not see the economic conditions that would merit that statement. We could guess, but that would be pointless. History tells us to be more optimistic than pessimistic and to analyze the fundamentals to understand current economic conditions. We expect some of the market’s best gains will occur in those early days and we don’t want to be on the sidelines when it starts.
Instead of being a short-term trader, Manole Capital is a long-term investor. Our process, strategy, and philosophy all rests on this long-term investment approach. We don’t know when this mini correction will run its course, but it will end. We are confident that investing in growing, free cash flow generating FinTech companies, trading at very reasonable valuations, is a good recipe for success. Instead of attempting to market time or predict the unpredictable, we prefer to do deep fundamental research on our companies and understand how they actually might benefit from today’s high inflationary conditions.
Sentiment:
During periods of uncertainty and stress, overall investor sentiment can play a critical role. If declining stock prices cause corporate executives to reduce hiring and cut back on investment spending, it can dampen future growth. CEOs might respond to their faltering stock prices and institute measures to reflect current market sentiment. There clearly seems to be a disconnect between the Fed’s commentary and the market’s current expectations.
As a recent Gallup data indicated, only 1% of its poll view current economic conditions as “excellent”. Instead, 85% of Gallup’s respondents view current economic conditions as “fair to poor”. Looking forward, 77% of Americans expect the outlook to get worse.
Another US consumer sentiment reading is done by the University of Michigan. Its US consumer sentiment reading fell to an all-time low of 50.2% in June, from an already low 58.4% a month ago. These are sentiment readings and lows not seen since 1980 and worse than the depths of the Financial Crisis. For perspective, during that period, unemployment was at 10% and roughly 10 million Americans lost their homes. Contrast that to today, where unemployment is near 50-year lows, and discretionary spending remains strong.
From an institutional perspective on sentiment, Bank of America (i.e., BoA) did a survey of global fund managers in April 2022. BoA inquired with these institutional managers about their biggest economic worry. 26% of managers believe a global recession is coming, 25% of managers are worried about hawkish central banks, 21% are fearful of inflationary pressures and 16% are concerned with the Russia and Ukrainian conflict.
At recent conferences, some large card issuers, and banks (i.e., BoA, PNC, American Express) expressed confidence in the economy, based on a healthy consumer. With a robust job market, rising wages, and a fairly high savings rate, these companies are expecting a healthy economy and solid spending. Bank of America Corp’s CFO is Alastair Borthwick and he recently commented on the strength he is seeing in their loan portfolio and its asset quality. He said, “There’s this question of what will happen in the future, and there’s what we’re seeing right now. And what we’re seeing right now, credit is in great shape.” On the flip side, others are calling for a recession due to skyrocketing energy prices, a reduction in fiscal and monetary stimulus, rising interest rates and the impact from the Ukrainian / Russian war. JPMorgan’s (JPM) CEO Jamie Dimon is cautious and just stated he is getting his bank ready for an impending “financial hurricane.”
While it never hurts to prepare for the worst, we are more confident. We see resilient consumer spending and solid household balance sheet strength. We are not forecasting a recession, but we are not macro economists; we are bottoms-up, fundamental research analysts focused entirely on the emerging FinTech industry. When we look at the current fundamentals, we see excellent growth ahead. While inflation is an obvious and powerful negative force on sentiment, it also may be so powerful that it causes investors to miss the parts of the economy that are growing and working well. From our perspective, today’s negative sentiment provides a somewhat bullish setup, as a strong economy is being wildly under-appreciated.
Recessionary Fears:
Defining a recession isn’t easy. Normally, it is determined by the National Bureau of Economic Research to determine when a recession has started, but it often takes so long that the slowdown is over by the time one is declared. Others point to the technical definition of a recession, which is two consecutive quarters of declining economic growth. The Atlanta Fed posts its GDP forecasts, and it is expecting a 2nd quarter contraction of (1.6%), following a (1.6%) decline in the 1st quarter. Technically, that would mean we are in a recession right now.
Back in the 1960s, economist Paul Samuelson famously said that “the stock market has predicted nine of the past five recessions”. Decades later, those comments remain as true as ever, as nobody is quite sure if we are currently in the midst of recession or not.
One cannot turn on the TV or read the newspaper without hearing from economists and experts about the impending financial crisis and next recession and/or depression. We do not find it constructive to live our lives in a constant recession countdown, like certain media outlets do.
Economists increasingly expect the Fed to fight inflation with aggressive hikes in their Fed Funds rate. Many worry that our central bank will go too far and trigger a recession. A recent Wall Street Journal survey of economists found that 49% believed a recession was coming in the next 12 months, up from only 18% in January. Nearly half (46%) of these economists said they expected the Fed to raise interest rates excessively and cause unnecessary economic weakness.
One commodity we believe is a decent indicator for economic risk is copper. The CME is the world’s leading derivatives marketplace, and it reports daily volumes for all of the products and commodities it trades. On July 21st, the CME reported an all-time high record of copper options traded. This was a record week for copper trading, as open interest records were set on back-to-back days. Copper is typically seen as a bellwether for the global economy, so this type of trading (and price hedging) indicates that certain market users are efficiently managing risk and potentially expecting an economic slowdown.
Recessions can be mild and short, especially if the causes are anticipated and less systemic. They can be more severe and longer, if they are unexpected and less intertwined with the core economy. The COVID recession of February 2020, was the shortest recession in US history, at roughly a month long. That downturn had a stunning (19.2%) decline in GDP, the biggest drop in output since the Great Depression. That recession was a completely unexpected pandemic, that literally shut down the global economy. In short order, central banks and governments figured out how to cope, many provided huge sums of stimulus, and most economies came roaring back.
This is obviously quite different from the Financial Crisis, which occurred from December 2007 through June 2009. This downturn was triggered by the subprime mortgage crisis, which was the longest downturn since the Great Depression. The snapback took years, as the labor market was slow to recover. In between these two examples is the recession in early 2000. It was primarily due to the implosion of the “dot com” era, excessive valuations, that was then followed by the tragedy of September 11th. That recession lasted eight months, from March to November of 2001, but the cumulative drop in GDP output was only (0.3%).
What does this evidence mean for our current economic environment? What are the systemic challenges and how deep are the underlying causes of this prospective slowdown? On the negative side of the equation, inflation is clearly running at unacceptable levels. In addition, geopolitical events are creating supply chain issues and commodity problems. On the positive side of the equation, current economic conditions are fairly healthy. The labor market is in excellent shape and household finances and corporate balance sheets are very strong.
Historically, recessions are best characterized by a decline in production and output, a breach in the credit markets, declining household finances, and significant job losses. So far, we are only seeing one of these conditions (decline in output), which we think is directly correlated with the lingering effects of the global pandemic and war in Ukraine.
We believe businesses and consumers will adapt and that we are not in the middle of a systemic crisis. Global economies are learning to deal and cope with COVID (excluding China’s Zero Tolerance policy), and supply chain issues seem to be easing.
Inflation:
Over the years, there have been some colorful metaphors and quotes to describe inflation. Ronald Reagan said inflation was “as violent as a mugger, as frightening as an armed robber, and as deadly as a hitman.” Economist Milton Friedman said inflation was “taxation without legislation.” More comically, writer Sam Ewing said, “Inflation is when you pay fifteen dollars for the ten-dollar haircut you used to get for five dollars when you had hair.”
For years, the Fed strived to get annual inflation up to 2%. Instead, inflation hardly budged. A year ago, the Fed believed that inflationary indicators were only “transitory”, so it remained accommodating on its policies. Clearly, times have changed, and this is yet another example of using prior data to determine forward policies can be quite challenging.
In June, year-over-year CPI rose to 9.1%. And Core CPI, which excludes energy and food costs, was +5.9%. Energy and food represent 1/3rd of total CPI and the Fed prefers to use Core CPI for its preferred inflationary measure. While we see the logic in this, the average US household can’t simply ignore food and energy costs.
The food index rose another +1% last month, and this was the sixth straight month that food at home rose at least +1%. Even more troubling, energy prices are up an alarming +42% on an annual basis. Both of these inflationary measures were at 40-year highs, not seen since November of 1981.
Former Fed Chairwoman and now Treasury Secretary Janet Yellen recently admitted that she failed to fully appreciate the sharp rise in inflationary pressures. She said, “I think I was wrong then (in late 2021) about the path that inflation would take.” Yellen originally framed inflation as a “temporary side effect of the economy returning to normal following the pandemic”, and blamed snags in supply chains for inflationary pressures.
The Fed’s Vice Chairwoman is Lael Brainard and she recently said, “from the data we have in hand today, (higher rates) seems like a reasonable path”. Then she said, “if we don’t see the kind of deceleration in monthly inflation prints (by September), if we don’t see some of that really hot demand starting to cool a little bit, then it might well be appropriate to have another meeting where we proceed at the same pace. Right now, it’s very hard to see the case for a pause.”
In recent Congressional testimony, Chairman Powell said “We are strongly committed to bringing inflation back down, and we are moving expeditiously to do so. We have both the tools we need and the resolve it will take to restore price stability on behalf of American families and businesses.”
The average growth of CPI since 1980 has been +3.3%, so recent readings are troubling. Without placing blame on the Fed, it has failed in its commitment to preserve price stability, as inflation is running at well over 4x its target.
CPI Inflation (US Bureau of Labor from Yahoo Finance)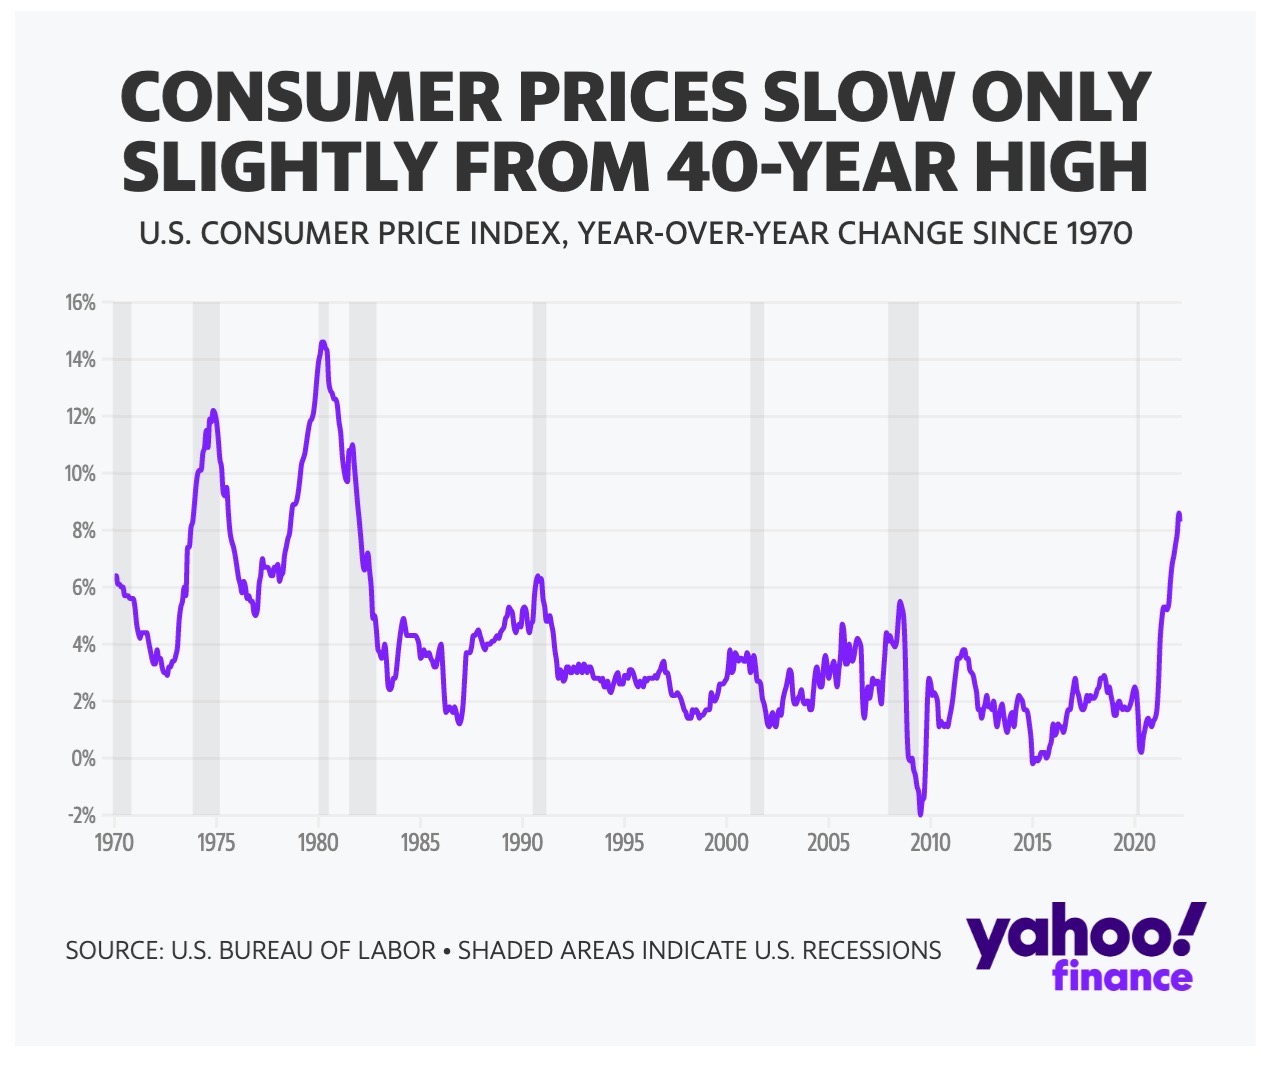
Before we curl up into a fetal position and cry, today’s environment, while challenging, is still far from the all-time high CPI of 14.8% in 1979 (as seen in this chart).
Prices:
At the PGA Championship in Tulsa Oklahoma this summer, Michelob Ultra was selling for a whopping $18 a can. That seems excessive, but I’m sure there were thousands of thirsty patrons purchasing that beer. I guess we can take some solace in the fact that it was a 24 ounce can, not a traditional 12 ounce can, but we’re probably splitting hairs on that one. It isn’t just beer that we are disappointed in seeing such large YoY (year-over-year) increases in. Over the last year, eggs are up +33%, coffee and bread increased +15%, milk and furniture +16%, bacon +18%, hotels and used cars are up +23%, airline tickets are +33% and gasoline +44%. Over the past year, electricity prices rose +12%, an increase that will translate to $540 in higher electric bills for the average American household.
There’s little doubt that inflation is permeating through our economy. If you drive a car, filling up your gas tank now well exceeds $100. Going out to dinner and a movie (even without a babysitter) will cost over $100 too. We are all struggling with higher costs, but the payment stocks offer an opportunity to benefit from inflation. Why? Well, payment companies earn their revenue off of the number of transactions, but also on the face value of those transactions. If the average credit card MDR (merchant discount rate) is 2.2%, the payment revenue associated with each transaction goes up too, as the face value of the purchase goes higher.
Considering we just celebrated July 4th, we were disappointed that certain BBQ prices are skyrocketing too. For example, there is a +22% increase in lemonade prices, a +36% increase in ground beef prices and +16% increase in hot dogs. The only place to still get a hot dog deal seems to be Costco. It hasn’t changed the price of its popular $1.50 hot dog and soda combo since 1985 and it has no plans to change its pricing despite runaway inflation. Costco (COST) co-founder Jim Sinegal once said, “If you raise the price of our effing hot dogs, I will kill you.”
Joey Chestnut signed picture (My personal photo collection)
While inflation is unfortunately eating away at the price of our BBQ, we were happy to see Joey Chestnut eat an astounding 63 hot dogs and repeat as the 15x champion in Nathan’s Famous Hot Dog eating contest.
The Fed:
For the last year or so, we have been discussing how the Fed has a challenging job and has “painted itself into a corner”. Their dual mandate is to strive for full employment, as well as maintain stable prices. The idea that the Fed can act as an economic backstop and magically control supply and demand is unfair.
Now, there are dozens of economists pointing fingers at the Fed and stating it is to blame, not if, but when the economy falls into a recession. We think this blame game is unhealthy and almost unfair. Could the Fed have begun raising interest rates earlier? Maybe in 2021, when the S&P 500 was up +28%? Yes, but we were coming out of a global pandemic, which brought the world’s economy to a screeching halt. We will cut the Fed some slack for being tolerant, as opposed to ripping life support off of this ICU patient.
At his recent bi-annual Congressional testimony, Fed Chairman Powell was asked if they might overshoot on rate hikes and push our economy into a recession. He replied, “we might”, but “the bigger risk was not restoring stable prices.” He then said, “We can’t fail at this. We really have to get inflation down.” The clear takeaway is that the Fed is focused on bringing inflation back to its 2% target, over the next two years, without dramatically impacting low unemployment. While Chairman Powell continues to state that the overall economy can handle tighter Fed policies, the stock market doesn’t seem as confident. As investors have become increasingly more and more pessimistic, Chairman Powell’s comments are somewhat reassuring.
We don’t have any historical evidence that a fiscal tightening, during the roll-off of massive stimulus, will result in a soft landing. The Fed and other global central banks are appropriately fixated on lowering inflation, but it might result in demand destruction and a recession. One can always “hope” for a soft landing, but “hope” isn’t a wonderful investment philosophy.
Could we actually be experiencing a recession-less, almost sentiment-driven bear market? Unlike the fundamentally driven bear markets of 2000 and 2008, maybe we are simply worrying ourselves into market declines? There have been 26 bear markets since 1929, but only 15 of them were tied to a recession.
The ECB:
The European Central Bank or ECB just raised interest rates for the first time in 11 years, to try and cool rampant inflation in the 19 nations of the eurozone. The ECB surprised the markets by pushing its benchmark rate up by 50 basis points, but it is simply bringing the bank deposit rate back to 0%.
Since 2014, interest rates have been in negative territory, as European leaders first dealt with the sovereign debt crisis and then had to manage through a global pandemic. The ECB is hiking its interest rates, as its economies are drastically slowing and facing the risk of stagflation (low growth coupled with high inflation). The biggest uncertainty facing Europe is its reliance on natural gas supplies from Russia. It appears that Moscow is weaponizing fossil fuels, following sanctions from their unprovoked invasion of Ukraine. Putin has the ability to cut critical natural gas supplies (through its Nord Stream 1 pipeline) that could leave Europe without the hydrocarbons it desperately needs.
ECB President Christine Lagarde expressed worry that “a prolongation of the war in Ukraine remains a source of significant downside risk to growth, especially if energy supplies from Russia were to be disrupted to such an extent that it led to rationing for firms and households.” We can appreciate these honest comments, but it certainly appears that Europe is facing a challenging fall and winter.
Interest Rates:
In March of this year, the Fed raised rates by 25 basis points. Then in May, the Fed hiked interest rates by another 50 basis points. On Wednesday, the 15th of June, the Fed delivered a 75-basis point rate hike, which was the largest increased since 1994.
We could see the Fed take a “front-end load” approach and make bigger rate hikes sooner than the market expects. If the Fed acts bigger and faster, it could potentially solve this inflation problem sooner rather than later. In fact, following the surprising CPI June report, market expectations put a 26% probability for a full 1% increase in July.
How much will the Fed raise interest rates? Instead of guessing, like many headline-seeking economists do, we prefer to look at the CME’s Market Watch tool. This provides us with real-time insight into what the market is thinking. If you visit the CME’s website (click here), you will see that the Street is anticipating a 75 basis point hike in July and nearly a 90% probability of Fed Funds approaching 4.0% by the end of this year.
We believe the Fed is aggressively raising rates now to try and stem sky-high inflation. When inflationary pressures begin to ease, the Fed can begin to pull back some of its monetary tightening measures. In fact, if growth begins to stall, the Fed might even lower interest rates next year.
The Fed has to act assertively, and potentially overshoot on interest rate increases, to stem +9% inflation. While it doesn’t want to induce a contraction, it has to do everything in its power to bring inflation down. We expect another 75bp hike this week, followed by additional rate increases (albeit smaller) in September and November.
Jobs:
Not to oversimplify things, but we believe consumer spending is directly tied to employment. As we look at the employment situation, we continue to be very impressed. As this job openings slide shows, we are currently at 12 million open jobs, well above anything experienced over the last few decades. There are 1.9 available jobs for every unemployed person in the US. There have been over 10 million US open jobs in every month this year, which is nearly 2x the number of typical job openings in years before the pandemic. In order to attract good candidates, businesses are forced to continue to increase wages.
Jobs Market (Internet)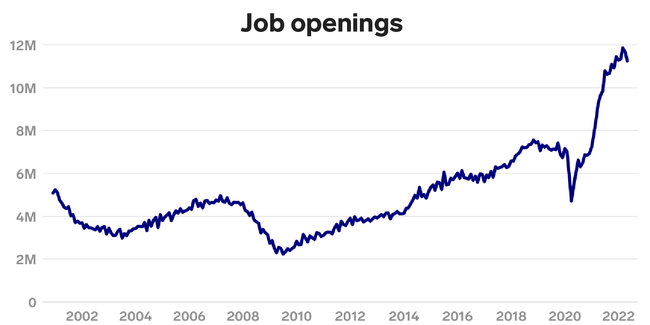
The latest employment results showed that 372,000 new jobs were created last month compared to consensus estimates of 270,000, keeping the unemployment rate steady at 3.6%. Diving a little bit deeper into the details, the industries with the biggest job gains were: Professional and Business Services (74,000 new jobs), Leisure and Hospitality (67,000 new jobs), Healthcare (57,000 new jobs) and Transportation and Warehousing (36,000 new jobs). On the flip side, we are disappointed to see that 3% or 300,000 public school teachers left the industry between February 2020 and May of 2022.
Analyzing federal unemployment benefits, adds another interesting labor perspective. During the Financial Crisis in 2008, there was over 6.5 million unemployed Americans getting federal assistance. Pre-COVID-19, many considered the economy to be in great shape. Back in 2019, there was an average of 1.7 million Americans collecting benefits. Currently, this number is even lower, at only 1.3 million Americans. Clearly, with unemployment and those receiving assistance so low, the US jobs picture has rarely been better.
Our Crypto Thoughts:
Bitcoin (BTC-USD), the largest and most important crypto currency has fallen (75%) from its highs and is down (60%) between April and June of this year. Before we cry too much for crypto investors, Bitcoin yearly low prices tell of a significantly appreciated asset. Back in 2014, Bitcoin’s yearly low was $300. In 2017, the Bitcoin low was $780 and in 2020 it was $3,800. So, today’s price of roughly $21,000 is still more than 5x the low experienced a couple of years ago.
To say that the crypto market has been volatile would be the understatement of a lifetime. We don’t believe the dramatic decline in Bitcoin is even the biggest story within the crypto industry. In our opinion, it is the freewheeling financial practices and lack of regulation that is our greatest concern. Instead of revolutionizing the banking industry and financial services, some crypto companies have been adopting some of the worst practices of Wall Street, like unbridled leverage and automatic liquidations.
At Celsius Network, a major crypto lender with $11 billion of deposits, once it froze withdrawals, the business was doomed. Less than 72 hours after this announcement, despite its CEO Alex Mashinsky claiming to “have billions of liquidity”, the business failed. Between the failures and bankruptcies of Three Arrows, Celsius, Finbox, Babel, Galaxy Digital (OTCPK:BRPHF), Terra Luna (LUNA-USD), there are no shortage of massive breakdowns in this industry. Could adequate regulations have prevented these problems? We will never know, but we do believe regulations and stricter rules are coming.
DeFi:
What we have come to learn, from recent events, is that DeFi (decentralized finance) protocols are perfect environments for mass contagion. In periods of market stress, the spillover effects can become impossible to contain since blockchains have a public and automated infrastructure. For the last few years, DeFi has claimed that its automation is a dramatic improvement over human-run systems, utilized by traditional banks and brokerages. However, when markets seize up and credit risk needs to be managed, DeFi has clearly failed.
Crypto enthusiasts love to say how their industry is decentralized, but it is still dominated by just a handful of major platforms. Just like in 2008, when one company teeters, the pain can spread fast. Since blockchain transactions are publicly available, investors can watch declining fundamentals in real-time. Blockchain data is so granular, that anybody can see debt outstanding, collateral posted, specific loan terms and what price might trigger a margin call.
There are numerous risks and rewards of lending crypto, just like what exists when one deposits money in a traditional bank. Lending and borrowing are one of the oldest and fundamental forms of finance, and it is not fundamentally different even when it comes to crypto. When an investor lends out Bitcoin, the return earned is compensation for the risk you are taking. Taking risk is not necessarily a good or bad thing, it is inherent in any investment. An investor believes they have appropriately sized the inherent risk relative to the opportunity or return. When you lend your cash to the bank or your Bitcoin to BlockFi, an investor trusts that the financial entity evaluated its counterparty risk, did due diligence, an analysis of its borrowers, maintained adequate collateral requirements, and examined custody protections.
One forced liquidation and automated margin call has cascading impacts throughout the industry (i.e., rippling from Celsius to others market participants). This reminds us of the Financial Crisis and there are meaningful similarities between these extreme market conditions and what happened at Lehman Brothers. Once confidence gets shattered and prices plummet, liquidity freezes up and operations cease. The $60 billion demise of Terra Luna and its stablecoin led to a cascading contagion to others.
Unlike traditional banks, with strong regulatory protections (i.e., FDIC guarantees), cryptocurrency banks have no backstops and few investor protections. As panic continued to spread throughout the crypto landscape, retail depositors clamored to get their money out of these custodians. Voyager told its customers that their deposits were FDIC-insured, through a partnership with Metropolitan Commercial Bank. Unfortunately, customer funds were only protected if Metropolitan Bank fails, not if Voyager fails. While the FDIC is now investigating Voyager’s (potentially false) claims, it does little to help those investors impacted. These types of misleading statements and losses will damage the confidence investors have in crypto.
A year ago, there were entities promising 15% to 20% returns on crypto deposits. These types of promises and returns should have been questioned and scrutinized by regulatory agencies. Instead, investors are now wondering about where they stand in bankruptcy court proceedings in Delaware and the Cayman Islands.
Crypto Regulation:
June 17th marks the 50th anniversary of the Watergate burglary. This ultimately led to the resignation of President Nixon, but also ensnared an FBI director, two former attorney generals and 20 lawyers. On July 30th, the 20th anniversary of the Sarbanes-Oxley Act will occur. This was intended to restore public confidence in the securities markets, following numerous corporate and accounting scandals (i.e., Enron in 2001 and WorldCom and Tyco in 2002). It is often these types of embarrassments and illegal behaviors that lead to the regulations that shape our current markets.
Regulators have been pursuing lenders like Celsius, as they have been offering high-yield products under the guise of regulated accounts and registered securities. Now, with its demise, regulators are probably quietly gloating. The industry will survive, but many hard lessons have emerged. The biggest, in our opinion, is that regulation is coming. What has become abundantly clear (at least to us) is that a lack of regulation has left investors vulnerable and exposed. The foundation of digital currencies was based upon a lack of regulation and governmental control. Now that cracks are evident in this foundation, many are wondering why there aren’t more investor protections and FDIC backstops. The industry can’t have it both ways. The crypto outlook remains quite cloudy and some of the regulatory commentary seems ominous.
On July 8th, 2022, Fed Vice Chairwoman Lael Brainard published 11-pages of very insightful crypto commentary, which can be read by clicking here. These comments were made at the Bank of England conference and are intended to act as an introduction to possible global crypto regulation. While it is an excellent and quick read, we would summarize her bigger picture points as:
“Recent volatility has exposed serious vulnerabilities” in the crypto landscape Crypto is susceptible to the same risks as traditional finance (i.e., leverage, settlement, opacity, liquidity, etc.) “New technology and financial engineering cannot by themselves convert risky assets into safe ones.” New tech promises increased competition, reduced transaction costs, lower settlement times, etc. However, these advances are often “fraught with risks, including fraud and manipulation” Strong regulation will not stifle innovation, but will “build a resilient digital native financial infrastructure” Crypto assets are not a hedge to inflation, but are “highly correlated with riskier equities”, “It has become clear that the crypto ecosystem is tightly interconnected.”
Recent crypto performance has been painful, but it still remains somewhat on its own little island. The contagion to traditional financial entities has been limited and it does not seem to be a systematic risk to the overall market. As Vice Chairwoman Brainard stated:
Despite significant investor losses, the crypto financial system does not yet appear to be so large or so interconnected with the traditional financial system as to pose a systemic risk. So, this is the right time to ensure that like risks are subject to like regulatory outcomes and like disclosure so as to help investors distinguish between genuine, responsible innovation and the false allure of seemingly easy returns that obscures significant risk.
Strong guardrails and a regulatory foundation will bring some much-needed safety and soundness to the crypto market. We believe there is a serious lack of market integrity on pricing, which is needed for further institutional investment. In addition, retail investors will benefit from additional bank-like protections. These regulations will need to be both domestic and international, as crypto is global and potentially prone to evasion.
Lastly, as Chairwoman Brainard emphasized, “The permissionless exchange of assets and tools that obscure the source of funds not only facilitate evasion, but also increase the risk of theft, hacks, and ransom attacks.” We agree and anticipate significant global regulations coming to the crypto markets. This foundation and regulation must be established “before the crypto ecosystem becomes so large or interconnected that it might pose risks to the stability of the broader financial system.”
We welcome innovation and the opportunity for financial services to become faster, cheaper, and more inclusive. However, enabling responsible innovation must come with rules and will only truly flourish once a regulatory perimeter encompasses the crypto financial system.
Conclusion:
Following the pandemic lows in early 2020, the stock market saw a spectacular bull market run. Technology and meme stocks rallied, cryptocurrency surged higher, all fueled by trillions of stimulus and Fed support, to help offset a hopefully once-in-a-lifetime global pandemic. That 2021 party has left many with a hangover, as the S&P 500 just had its worst start to a year in half a century.
The first six months of 2022 were a rocky stretch, no matter how investors were positioned. Seeing stocks and bonds move in lockstep – downward – was a break from what we’ve experienced in the last two decades. Some have plowed assets into real estate, to take advantage of historically low interest rates. Others piled into commodities, since hard assets typically do best in inflationary environments, but these usually fall fast if there’s a hint of an upcoming recession. Instead of market timing and rotating in and out of various sectors, we focus on one secularly growing segment – FinTech .
While we are noticing some hiring freezes and modest layoffs, the overall employment picture remains excellent. As we stated earlier, if consumers are employed and being paid decent and fair wages, they will spend. While there are limits to the strength of the US consumer, the fundamentals and trends currently remain robust. We believe the setup looking forward is positive, with solid 2nd quarter results from our companies and some relief on the inflation front.
We hope you enjoy the rest of your summer and look forward to speaking with you soon.
Warren Fisher, CFA
Founder and CEO
Manole Capital Management
Be the first to comment