

Galeanu Mihai
The first day of the new year started out with a bang, but the major market averages faded quickly as shares of Tesla plunged to a new multi-year low. This bellwether for expensive growth stocks announced a vehicle delivery number for the fourth quarter that fell short of Wall Street estimates. Apple also took a hit on reports that it cut orders for some of its most popular devices. Big declines in two of the most valuable companies have an outsized impact on the market averages. Investors also sold energy stocks, along with crude oil futures contracts, over concern that China’s economic reopening might stifle growth in the short term, as the number of Covid cases rise. Yet the major market averages were a little misleading yesterday.
Finviz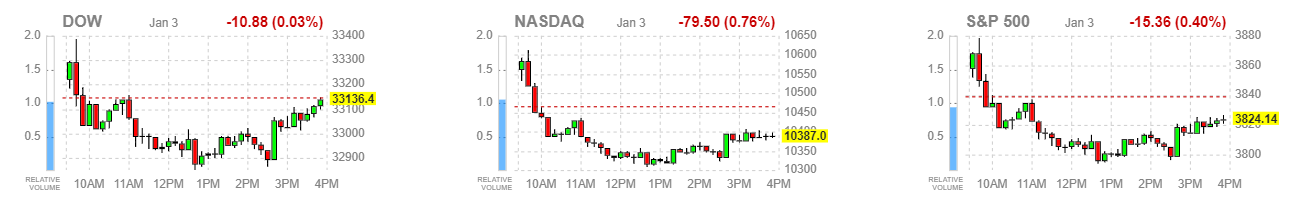
Every so often, I think sharing the heat map of the prior day’s trading in the S&P 500 does a better job of explaining what happened than anything else. Outside of Tesla, Apple, and the energy sector, there were a lot of stocks performing well. They were predominately value-oriented names, as the rotation from growth to value that started last year continues.
Finviz
While the growth side of the S&P 500 fell 1.25% yesterday, as measured by the iShares S&P 500 Growth ETF (IVW), the value side rose 0.45%, as measured by the iShares S&P 500 Value ETF (IVE). This performance divergence between growth and value grew dramatically in late October of last year, and I expect it to be an important investment theme this year.
StockCharts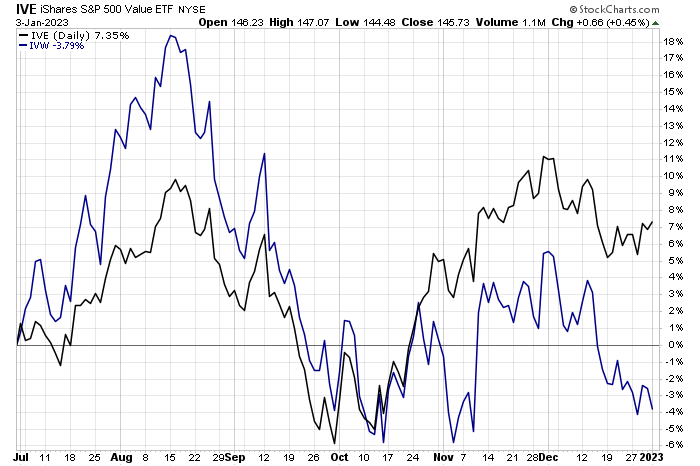
The greatest opportunities appear to be in small-cap value, as that is where we saw the largest divergence between share prices and earnings per share, as can be seen below. Remember that last year’s market decline was entirely a function of valuations, because earnings grew.
Bloomberg
I hear the bears complaining about the unsustainability of a price-to-earnings ratio of 17x for the S&P 500 with interest rates at current levels, but they need to look beyond the market’s most expensive stocks. In Ed Yardeni’s most recent Stock Market Briefing, he shows the differential between market caps and valuations below, which tells a similar story as the chart above.
S&P 500 – forward Price/Earnings 17.3x and forward Price/Sales 2.22x
S&P 400 – forward Price/Earnings 13.2x and forward Price/Sales 1.17x
S&P 600 – forward Price/Earnings 12.8x and forward Price/Sales 0.88x
There are bargains to be had in mid- and small-cap stocks that cannot be found in the largest companies. Therefore, a further decline in the major market averages, should it occur, is more likely to be a function of rotation from expensive growth to more reasonably priced value than a broad decline in all stocks. That is what we saw yesterday. It also requires a focus on quality, which means value-oriented companies that are strengthening their balance sheets, because low-quality names continued to underperform going into year-end.
Bloomberg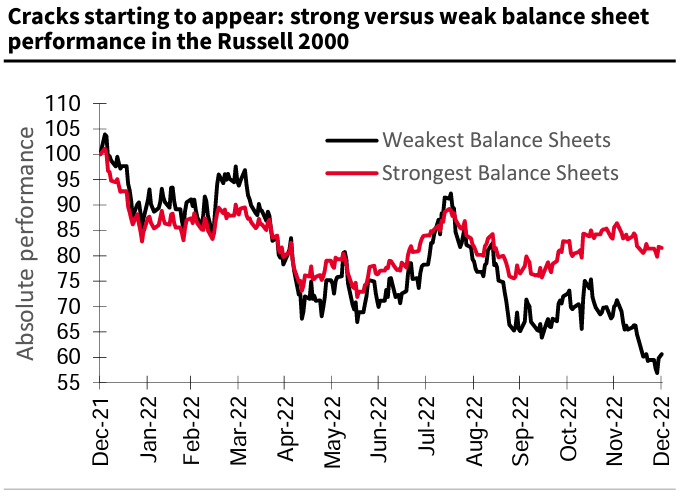
Lots of services offer investment ideas, but few offer a comprehensive top-down investment strategy that helps you tactically shift your asset allocation between offense and defense. That is how The Portfolio Architect compliments other services that focus on the bottom-ups security analysis of REITs, CEFs, ETFs, dividend-paying stocks and other securities.
Be the first to comment