

JHVEPhoto
Magna International (NYSE:MGA) is one of the leading automotive parts suppliers globally. With a rising human resource of 170,000 worldwide, MGA is well-positioned to meet the needs of the rapidly evolving mobility technology sector. The company’s recent investments in Yulu Mobility and Yulu Energy have allowed it to expand its operations to 345 manufacturing facilities and solidify its position in the rapidly growing Micromobility market.
However, due to inflationary and supply chain pressures, management presented a weaker revenue outlook due to slower vehicle sales, which snowballed into declining EBIT margins in FY ’22. MGA is trading fairly with my average fair price and at a logical resistance, making this stock unappealing as of this writing.
Company Overview
MGA ended the quarter with a growing top line of $9,268 million this Q3 ’22, up from its $7,910 million. This is thanks to its improving production and assembly volumes of light vehicles, as shown in the image below.
MGA: Recovering Light Vehicle Production (Source: Q3 ‘2022 Report )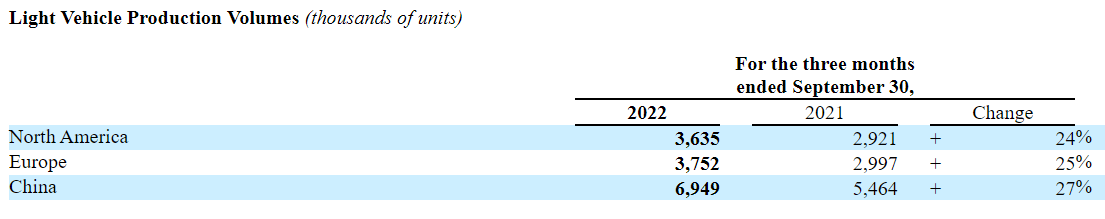
However, this improving figure is somehow negated by the management with its slower outlook regarding global light vehicle production in FY ’22 compared to its outlook in February, as shown in the image below.
MGA: Updated Light Vehicle Production Outlook (Source: Q3 ‘2022 Report )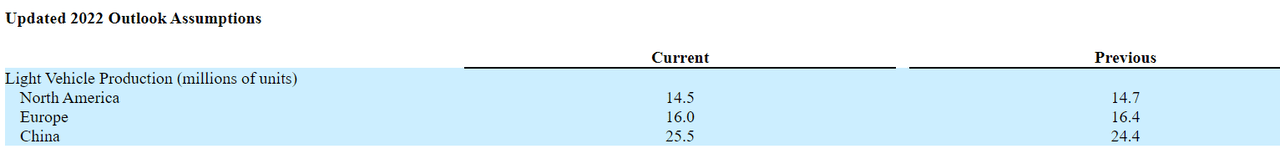
Aside from a slower forecast, these numbers are still below the pre-pandemic levels in North America and Europe for FY ’19, which were 16.296 million and 21.35 million, respectively. This raises the question of whether MGA is efficient in expanding its human resource base compared to its 149,000 employees recorded in FY ’21. MGA posted a higher direct labor expense of $676 million this quarter, up 7.9% from its $626 million recorded in the same quarter last year. There is no wonder why it has a slower trailing gross margin of 12.77% compared to its 14.20% recorded in FY ’21 and its 5-year average of 14.41%.
The anticipated demand environment recovery would be difficult as we continue to confront uncertainty from the global recession. As stated below, MGA’s margin will be under pressure until the end of FY ’22.
We continue to experience supply constraints in particular, semiconductors. Improvement in the second half of 2022 is not as much as expected. At this point, we anticipate some ongoing scheduled choppiness through the end of the year and into the first half of 2023. Input costs remain elevated with higher energy costs in Europe, the most recent factor. We continue to make progress in customer recoveries and our discussions with customers continue. Relative to our previous outlook, we expect only a modest increase in our net input cost for 2022. Source: Q3 ’22 Earnings Call Transcript
These are the key reasons why management forecasted an adjusted EBIT margin of 4.8% to 5.0% in FY ’22, a decline from 5.7% in FY ’21 and 5.0% in FY ’20.
MGA: Slowing Net Margin (Source: Company Filings. Prepared by Author)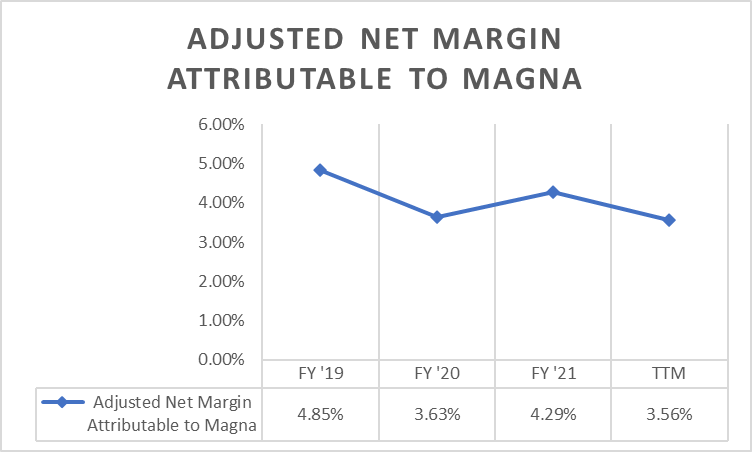
This snowballed to its deteriorating adjusted Net Income outlook amounting to $1.3 billion to $1.4 billion, down from its $1.553 billion recorded in FY ’21 but remained above its $1.186 billion recorded in FY ’20. However, this will result in a declining adjusted net margin, as shown in the image above. Hence, this makes MGA unattractive as of this writing.
Relative Valuation
MGA: Relative Valuation (Source: Data from SeekingAlpha. Prepared by the Author)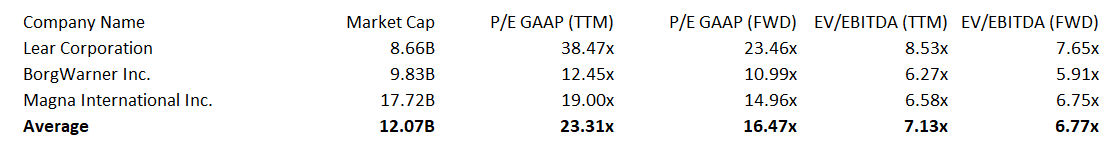
Lear Corporation (LEA), BorgWarner Inc. (BWA)
With a trailing P/E of 19x, MGA is selling at a discount to the average of its peer group, which is 23.31x. A discount can be seen in the company’s trailing EV/EBITDA multiple of 6.58x compared to its peer group average of 7.13x. However, comparing its trailing multiples and its historical performance, with a 5-year average P/E of 17.39x and EV/EBITDA of 6.29x, this implies that MGA is trading fairly. This is especially true given that its forward EV/EBITDA multiple of 6.75x is still much higher than its 5-year average.
MGA: Relative Valuation (Source: Prepared by the Author)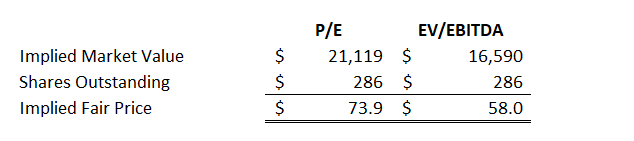
With an estimated $4.7 EPS and EBITDA amounting to $3,260 million in FY ’22, a conservative P/E multiple of 15.08x, and an EV/EBITDA multiple of 5.89x, we can arrive at an average blended fair price of $65.9, implying a 6.3% upside as of this writing. As a result, there is no margin of safety, making this stock currently an unattractive long-buy candidate.
Trading Near Resistance Zone
MGA: Weekly Chart (Source: TradingView.com)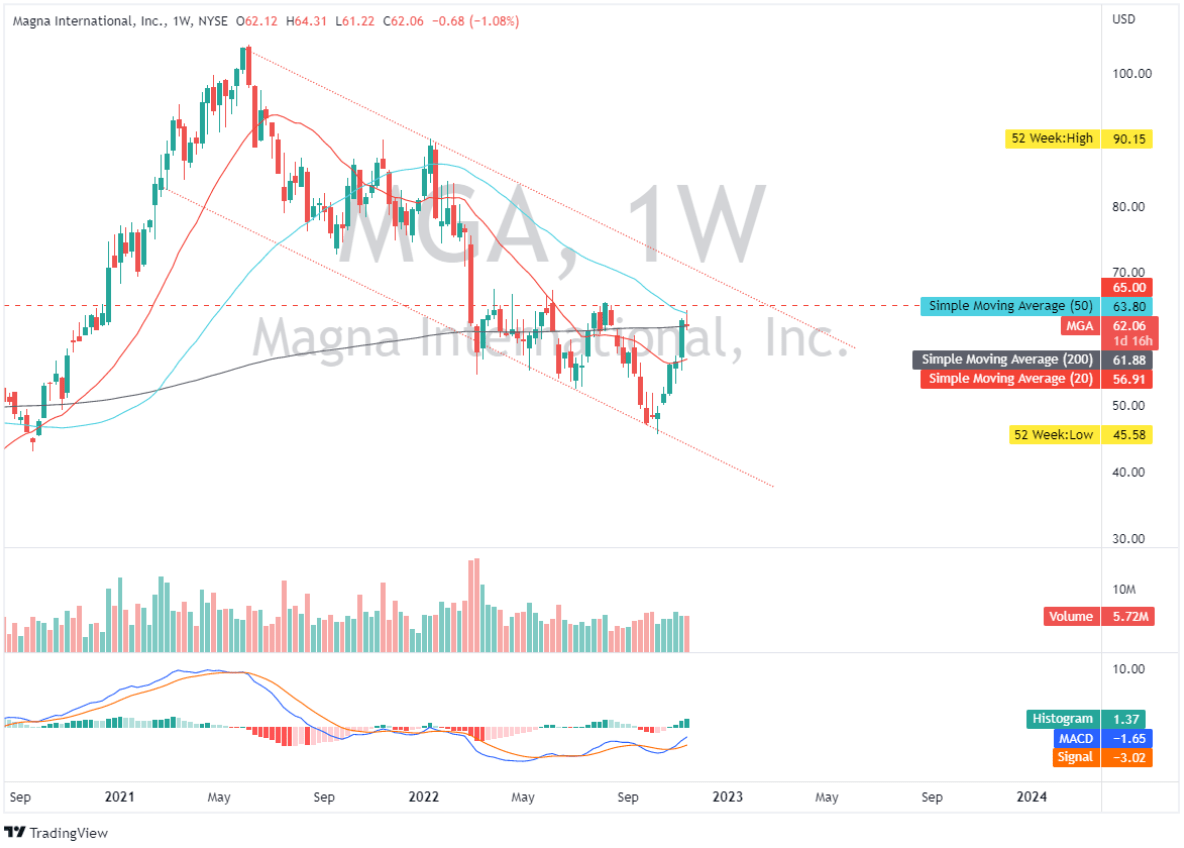
MGA is trading close to its latest swing high, around $65. This level of resistance has been tested repeatedly since March of this year. Bearish pressure is indicated by its MACD staying below the zero line. If the price can break out of its $65 area, the next psychological resistance to keep an eye on is around $70, which aligns with its upper trend line and then the next level of support would be $54.
Final Key Takeaway: Go-Forward Strategy
MGA: Megatrends (Source: 2022 Investor Presentation)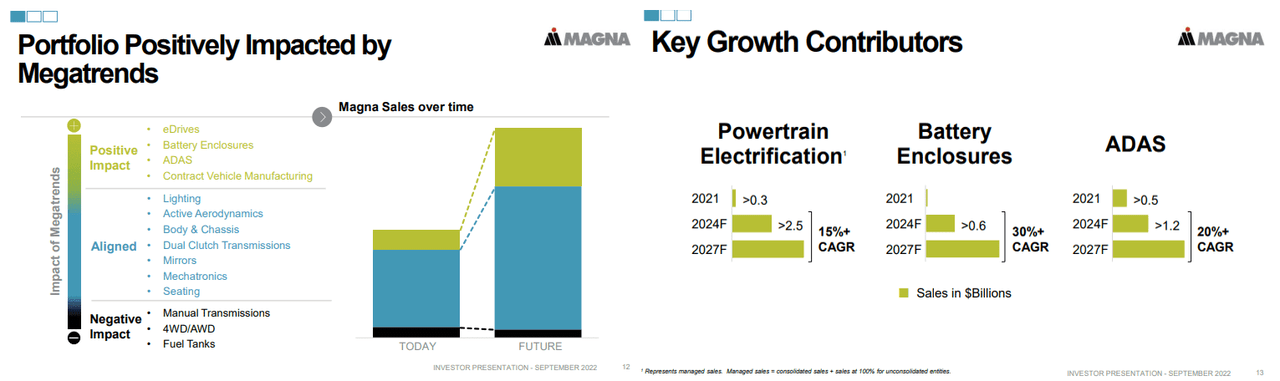
Despite today’s profitability weakness, Magna International can accommodate growing opportunities in connected mobility, especially considering the recovery of the global economy. In fact, its new acquisition, YULU businesses, enhanced its manufacturing operation in India. Additionally, this acquisition enhances the company’s Mobility-as-a-Service (MaaS) and Battery-as-a-Service (BaaS) businesses.
MGA has an improving operation in its China region. It entered a joint venture with Guangdong Huatie-Tongda Express Train Systems Inc. (Huatie) to develop innovative seating solutions primarily in China. Additionally, they remain a leading eDrive system supplier in China, supporting MGA’s positive outlook in China’s light vehicle production in FY ’22.
…we reduced our free cash flow projections to the range of $400 million to $600 million. This mainly reflects expected lower earnings and higher working capital, partially offset by lower capital spending. Source: Q3 ’22 Earnings Call Transcript
Finally, despite the decreasing free cash flow outlook in FY ’22, MGA has a strong buyback catalyst that allows it to repurchase 10% of its outstanding public float until November 2023. To summarize, MGA has a short-term profitability risk that makes it unappealing at the time of writing. However, I might reconsider entering at a lower price.
Thank you for reading. Cheers!
Be the first to comment