

FinkAvenue
Lyft (NASDAQ:LYFT) reported Q4 2022 results after the market close on February 9th, missing the consensus on earnings, but beating on revenue (up 21% YoY). The shares dropped 36% on February 10th, due to the Q4 results and management’s lower forward-looking guidance. The shares are now down 75.5% over the past 12 months and have annualized 3-year return of -42.3% per year. At their peak at the end of March of 2019, right after the IPO, LYFT closed above $78 per share, as compared to Friday’s closing price of $10.31.
12-month price history and basic statistics for LYFT (Seeking Alpha)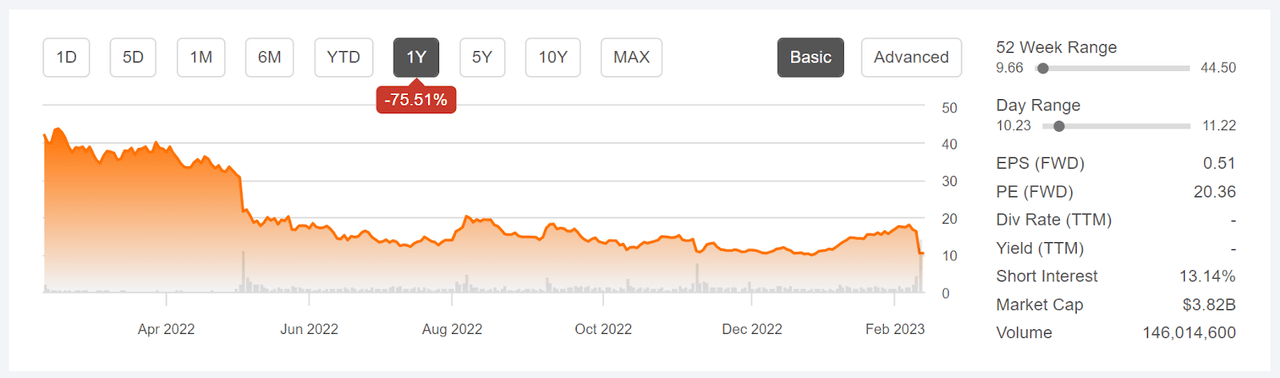
The number of people using LYFT, including rideshares, scooters, and bikes, rose to 20.4 million in Q4, very slightly higher than in Q3 and up 9% YoY. Q4 revenue was the highest for any quarter so far. The company also reported important improvements in the software interface that benefit drivers and riders. For riders, upfront pricing information is now available for all trips. Drivers can now screen for passengers (“Stay Nearby” filter) who are within a certain radius, allowing them to manage their drives to and from providing a ride. These positive developments were, however, overshadowed by management’s revenue guidance of $975 Million vs. the consensus expectation at $1.1 Billion. The analyst response to the Q4 results was, predictably, rather harsh, with a number of downgrades.
Active riders and revenue per rider (Lyft Investor Presentation)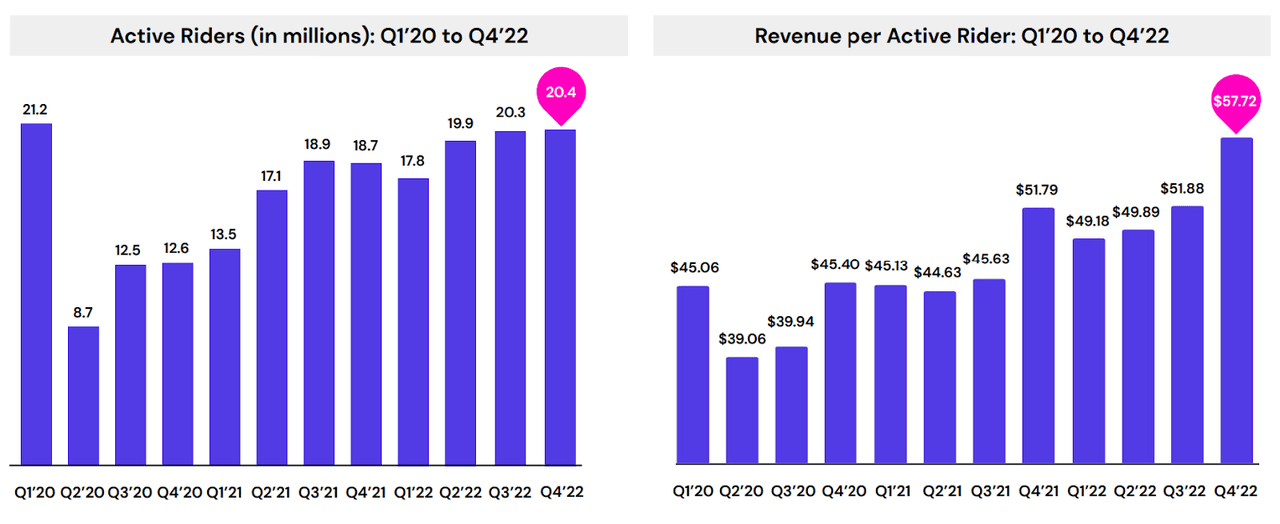
Earnings are expected to be slightly lower in 2023 than in 2022. ETrade reports that EPS for 2023 is projected to come in at $0.59 vs. $0.60 in 2022. The consensus outlook has 2024 EPS at $1.03 and 2025 at $1.38. The problem with having the expected growth relatively far into the future is that (1) there is more uncertainty with a longer time horizon and (2) the sensitivity of the share valuation to interest rates is higher. Simply put, given the substantial negative surprises over the past year, evidenced by sudden 30% drops in the share price in May and last week, it is very hard to have faith in predictions of huge earnings increases that are more than a year into the future.
Trailing (3 years) and estimated future quarterly EPS for LYFT. Green (red) values are amounts by which EPS beat (missed) the consensus estimate. (ETrade)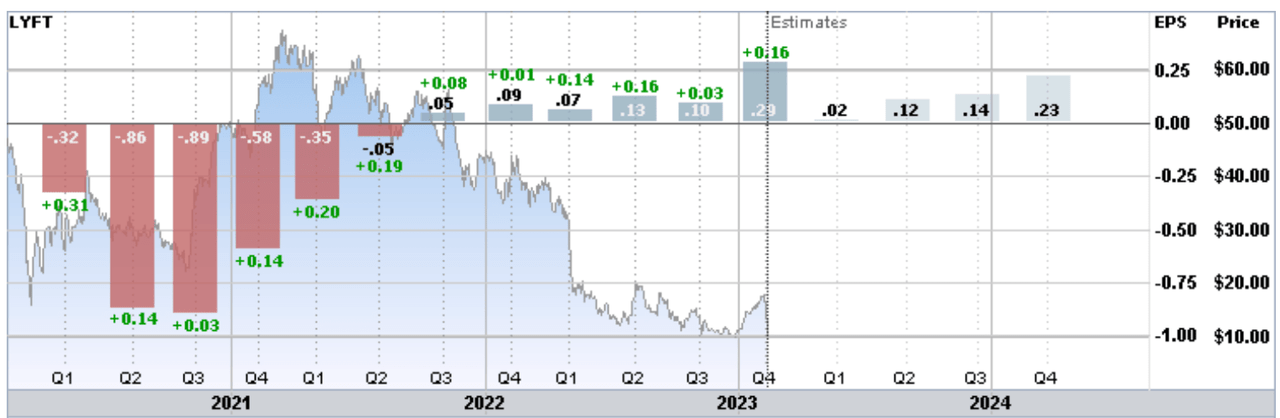
I last wrote about LYFT on May 9, 2022, at which time I assigned a sell rating on the shares. The situation was somewhat similar to today. LYFT reported weak quarterly results, albeit slightly beating earnings expectations, and the share price abruptly dropped 30% in a day. After this drop, LYFT was trading at around $20.50. The shares reached a 12-month low closing price of $9.87 on December 27, 2022, but subsequently rallied along with the broader market in January. At the time of this post, the Wall Street consensus rating on LYFT was a buy, and the consensus 12-month price target was about 120% above the share price. The Wall Street consensus outlook also had a major warning sign, however. Research has shown that there is predictive value in the consensus price target only when the spread among the individual analyst price targets is fairly low. When the dispersion between individual price targets is high, however, there tends to be a negative correlation between the return implied by the consensus price target and subsequent realized return. In other words, a high expected return from the consensus price target along with high dispersion, which was the case for LYFT, is actually a bearish indicator. As a rule of thumb, I consider the consensus to be questionable if the highest individual price target is more than twice the lowest. For LYFT, this spread was larger than a factor of 3.
Another negative indicator for LYFT came from the market-implied outlook, a probabilistic price forecast that represents the consensus view from the options market. The market-implied outlook was substantially bearish for the 8.4-month period from May 9th to January 20th, 2023. The expected volatility calculated from this outlook was very high, 68% (annualized).
With the bearish indication from the large spread in analyst options, along with the bearish market-implied outlook and the substantial challenges facing the company, a bearish rating was the obvious choice. LYFT is currently trading at about 44.6% below the closing price on May 9th.
For readers who are unfamiliar with the market-implied outlook, a brief explanation is needed. The price of an option on a stock reflects the market’s consensus estimate of the probability that the stock price will rise above (call option) or fall below (put option) a specific level (the option strike price) between now and when the option expires. By analyzing the prices of call and put options at a range of strike prices, all with the same expiration date, it is possible to calculate the probable price forecast that reconciles the options prices. This is the market-implied outlook. For a deeper discussion than is provided here and in the previous link, I recommend this outstanding monograph published by the CFA Institute.
As we have now passed the period for which the previous outlook was calculated, I have generated updated market-implied outlooks for LYFT and I have compared these with the current Wall Street consensus outlook in revisiting my rating.
Wall Street Consensus Outlook for LYFT
Seeking Alpha calculates the Wall Street consensus outlook for LYFT by aggregating the views of 42 analysts who have published ratings and price targets over the past 90 days. The consensus rating is a hold, as it has been for all of the past year. The consensus 12-month price target is 67.7% above the current share price. As I observed in my previous post, the spread in the individual price targets is very high. Seeking Alpha’s chart does not show a number for the lowest individual price target, but it appears to be around $10. In this case, the spread between the highest and lowest price targets would be about a factor of 6X. The ratio of the highest price target to the consensus value is higher than 3X. This level of spread in the price targets means that the consensus price target supports a bearish outlook.
Wall Street consensus outlook and 12-month price target for LYFT (Seeking Alpha)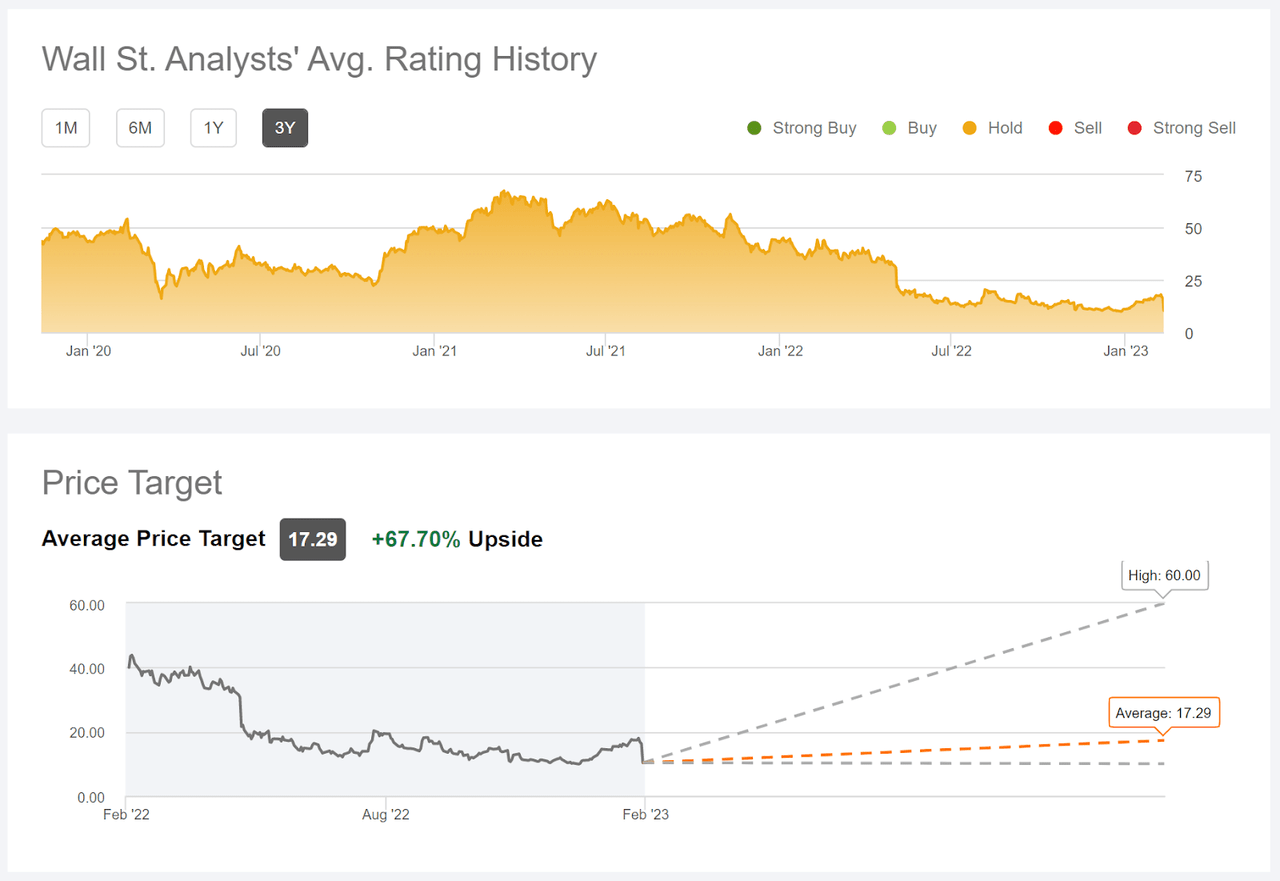
As of May 9th, ETrade’s version of the Wall Street consensus outlook had a buy rating on LYFT, while Seeking Alpha’s has been a hold for all year. Currently, ETrade continues to calculate a consensus buy rating on LYFT, with a consensus 12-month price target that is 40.6% above the closing price on Friday, May 10th. The spread between the highest and lowest price targets is a factor of 3X.
Market-Implied Outlook for LYFT
I have calculated the market-implied outlook for LYFT for the 4.1-month period from now until June 16, 2023 and for the 11.2-month period from now until January 19, 2024, using the prices of call and put options that expire on this date. I selected these specific expiration dates to provide a view to the middle of 2023 and through the entire year. I pulled the options quotes for this analysis at about 1:30 EST on Friday, February 10th, when the shares were trading at $10.40, a drop of 36% from the previous close.
The standard presentation of the market-implied outlook is a probability distribution of price return, with probability on the vertical axis and return on the horizontal.
Market-implied price return probabilities for LYFT for the 4.1-month period from now until June 16, 2023 (Author’s calculations using options quotes from ETrade)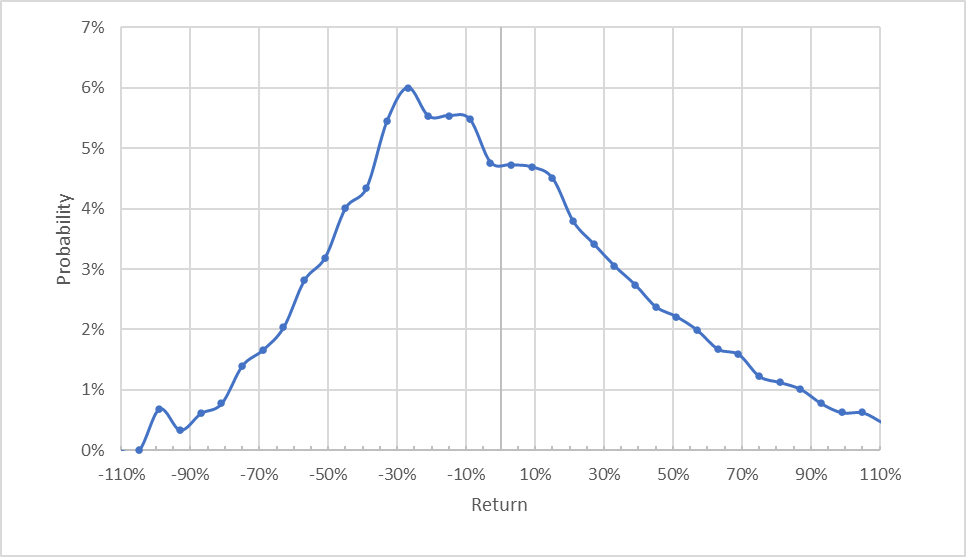
The market-implied outlook to the middle of 2023 is substantially tilted to favor negative returns. The peak in probability corresponds to a price return of -27% over this period. This distribution is strongly positively skewed, with a very long positive tail. There is the potential for very large positive returns, but the overall probability is small. The expected volatility calculated from this distribution is very high, at 86% (annualized). This type of outlook is common to high growth companies that are richly valued. Examples of stocks that have had similar outlooks include Teladoc (TDOC) in early 2021 and Peloton (PTON) in early 2021, and Tesla (TSLA) in early 2021, and there are many others. An academic study found that stocks with this type of positive skewness tend to underperform.
To make it easier to compare the relative probabilities of positive and negative returns, I rotate the negative return side of the distribution about the vertical axis (see chart below).
Market-implied price return probabilities for LYFT for the 4.1-month period from now until June 16, 2023. The negative return side of the distribution has been rotated about the vertical axis (Author’s calculations using options quotes from ETrade)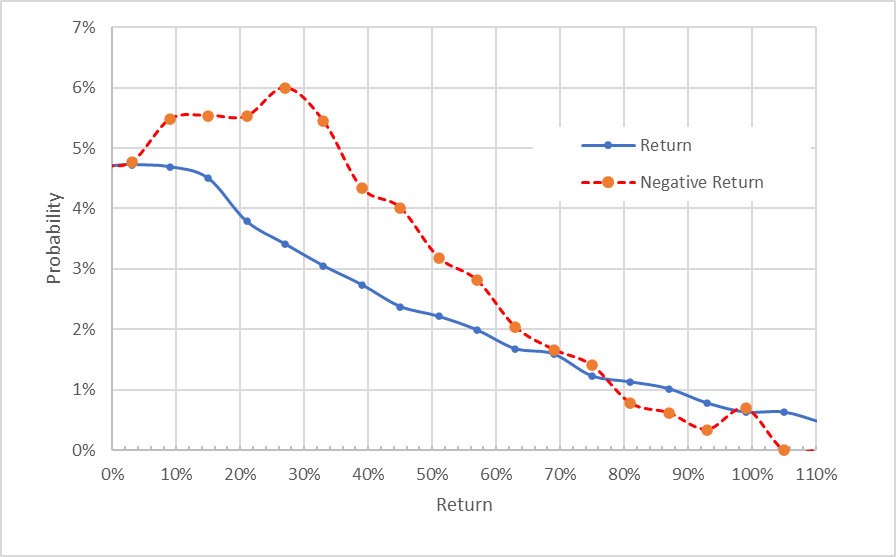
This view makes it easy to see that the probability of a negative return is markedly higher than the probability of a negative return of the same size, across a wide range of the most-probable outcomes (the dashed red line is well above the sold blue line over the left ¾ of the chart above). This is a bearish outlook.
Theory indicates that the market-implied outlook is expected to have a negative bias because investors, in aggregate, are risk averse and thus tend to pay more than fair value for downside protection. There is no way to measure the magnitude of this bias, or whether it is even present, however.
The market-implied outlook for LYFT for the 11.2-month period to January 19, 2024 is also bearish, consistent with the shorter-term outlook. In this case, the maximum probability corresponds to a price return of -47% and the expected volatility is 78% (annualized). For this longer outlook, there is a notable secondary peak in probability at a return of -100%, which reflects the implied probability that the shares go to zero. The market-implied probability is not a reliable way to estimate default probabilities, although there is a well-documented relationship between option implied volatility and the costs of credit default swaps.
Market-implied price return probabilities for LYFT for the 11.2-month period from now until January 19, 2024. The negative return side of the distribution has been rotated about the vertical axis (Author’s calculations using options quotes from ETrade)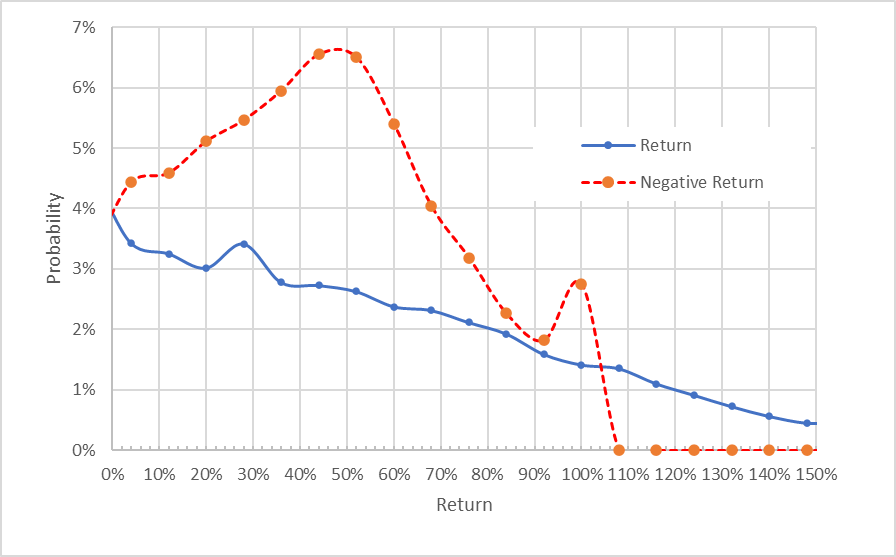
The market-implied outlooks for LYFT to the middle of 2023 and the start of 2024 are consistently bearish and qualitatively similar to the results from May 9, 2022, with maximum probabilities at negative returns and a long positive tail.
Summary
LYFT is a major player in the disruption in ride hailing, with traditional taxi services being displaced by individuals who can sign up to provide rides in their personal vehicles, with dispatch services provided using phone apps. While Uber (UBER), the dominant global firm, recently reported strong results, LYFT appears to be struggling. One of the challenges for companies competing for market share in great upheavals is that valuations depend on fairly heroic growth rates. When growth expectations falter, the share prices can collapse, which is LYFT’s current situation. The Wall Street consensus rating for LYFT is either a hold (Seeking Alpha) or a buy (ETrade), with a consensus 12-month price target that is 40%-67% above the current share price, but the spread in individual analyst price targets is a major red flag. The market-implied outlooks for LYFT continue to be substantially bearish, and this is after the big drop following Q4 results (the shares were trading at $10.40 when I pulled the options quotes). The value of a stock like LYFT is sensitive to outlooks because so much of the share price comes from earnings that are predicted to occur well into the future. The Wall Street consensus outlook and the market-implied outlook both support maintaining a sell rating.
Be the first to comment