

wildpixel
This dividend exchange-traded fund (“ETF”) article series aims at evaluating products regarding the relative past performance of their strategies and quality of their current portfolios. As holdings and their weights change over time, reviews may be updated when necessary.
LVHD strategy and portfolio
The Franklin U.S. Low Volatility High Dividend Index ETF (NASDAQ:LVHD) has been tracking the QS Low Volatility High Dividend Index since 12/28/2015. As of writing this, LVHD has 96 holdings, a 12-month distribution yield of 3.23%, and a net expense rate of 0.27%. Distributions are paid quarterly.
As described in the prospectus available on Franklin Templeton website:
Stocks in the Underlying Index must have demonstrated profitability over the last four fiscal quarters as a whole. Stocks whose yields are not supported by earnings are excluded from the Underlying Index. The methodology calculates a composite “stable yield” score, with the yield of stocks with relatively higher price volatility and earnings volatility adjusted downward and the yield of stocks with relatively lower price volatility and earnings volatility adjusted upward. Franklin Advisers anticipates that the number of component securities in the Underlying Index will range from 50 to 100. At the time of each reconstitution, no individual component of the Underlying Index will exceed 2.5% of the Underlying Index, no individual sector will exceed 25% of the Underlying Index, and real estate investment trust (“REIT”) components as a whole will not exceed 15% of the Underlying Index. The Underlying Index’s components are reconstituted annually and rebalanced quarterly.
The fund’s benchmark is the Russell 3000 index, which is represented in this article by the iShares Russell 3000 ETF (IWV). During the most recent fiscal year, the portfolio had a turnover of 14% of its average value. The fund invests mostly in U.S. companies (98.4% of asset value) of the large cap (56%) and mid-cap (35%) segments.
The heaviest sectors are utilities (23%) and consumer staples (21.7%). Other sectors are below 11%. Compared to the Russell 3000, LVHD massively overweights the top two sectors and real estate. It greatly underweights technology, healthcare, and ignores consumer discretionary and energy.
Sector breakdown (chart: author; data: Fidelity)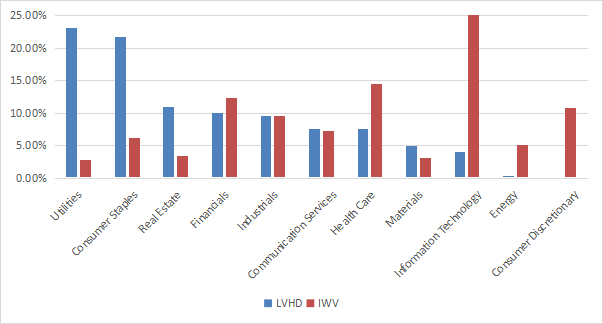
The top 10 holdings, listed in the next table with some fundamental ratios, represent 25.4% of asset value. The largest holding weighs 2.85%, so risks related to individual stocks are low.
|
Ticker |
Name |
Weight% |
EPS growth %TTM |
P/E TTM |
P/E fwd |
Yield% |
|
Philip Morris International, Inc. |
2.85% |
-0.20 |
17.61 |
16.59 |
4.96 |
|
|
Realty Income Corp. |
2.55% |
-15.75 |
62.51 |
48.94 |
4.46 |
|
|
Cummins, Inc. |
2.54% |
3.60 |
16.34 |
12.91 |
2.54 |
|
|
Duke Energy Corp. |
2.53% |
-32.68 |
29.78 |
17.56 |
4.06 |
|
|
The Coca-Cola Co. |
2.53% |
12.24 |
26.14 |
23.94 |
2.95 |
|
|
Verizon Communications, Inc. |
2.53% |
-4.94 |
7.91 |
8.46 |
6.52 |
|
|
Kimberly-Clark Corp. |
2.52% |
6.65 |
22.55 |
21.65 |
3.66 |
|
|
Lockheed Martin Corp. |
2.47% |
-4.65 |
22.15 |
17.84 |
2.50 |
|
|
Procter & Gamble Co. |
2.45% |
0.63 |
24.28 |
23.70 |
2.64 |
|
|
General Mills, Inc. |
2.44% |
31.80 |
15.90 |
18.39 |
2.84 |
Historical performance
Since 1/1/2016, LVHD has underperformed IWV by 2.14 percentage points in annualized return, with a lower volatility (standard deviation of monthly returns), but a slightly deeper drawdown. LVHD has also lagged two popular dividend-oriented ETFs: the Schwab U.S. Dividend Equity ETF (SCHD), with a similar dividend yield, and the Vanguard Dividend Appreciation Index Fund (VIG), with a lower yield.
|
Total Return |
Annual.Return |
Drawdown |
Sharpe ratio |
Volatility |
|
|
LVHD |
95.08% |
9.84% |
-37.32% |
0.68 |
14.14% |
|
IWV |
123.75% |
11.98% |
-35.22% |
0.74 |
16.76% |
|
SCHD |
151.44% |
13.83% |
-33.37% |
0.86 |
15.69% |
|
VIG |
132.14% |
12.56% |
-31.72% |
0.84 |
14.51% |
Data calculated with Portfolio123.
LVHD vs IWV, SCHD, VIG, total return since 1/1/2016 (Seeking Alpha)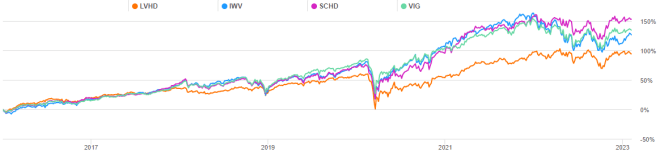
However, LVHD has been the best performer in the last 12 months, by a short margin. The low-volatility strategy has worked quite well in this very volatile year, showing shallow drawdowns compared to the benchmark and competitors (see next chart).
LVHD vs IWV, SCHD, VIG, total return trailing 12 months (Seeking Alpha)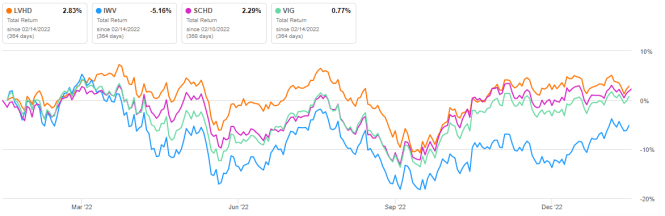
The sum of annualized distribution was $0.71 per share in 2016 and $1.26 in 2022. The annualized distribution growth rate was about 10% in this period. It is not exceptional, but quite good for a fund that is not aiming at dividend growth. Most of this dividend growth happened in 2017 and in 2022.
Scanning the current portfolio
LVHD holds 95 stocks. It is cheaper than the Russell 3000 regarding the usual valuation ratios (see next table).
|
LVHD |
IWV |
|
|
Price / Earnings TTM |
16.49 |
19.19 |
|
Price / Book |
2.26 |
3.47 |
|
Price / Sales |
2.26 |
2.17 |
|
Price / Cash Flow |
12.37 |
14.49 |
In previous articles, I have shown how three factors may help cut the risk in a dividend portfolio: Return on Assets, Piotroski F-score, Altman Z-score. My core portfolio holds 14 stocks selected using these quality metrics (more info at the end of this post). I consider that risky stocks are companies with at least 2 red flags among: bad Piotroski score, negative ROA, unsustainable payout ratio, bad or dubious Altman Z-score, excluding financials and real estate where these metrics are less relevant. With these assumptions, 11 holdings are risky in the current holdings of LVHD. They weigh 14.9% of asset value. It is not very good, but still acceptable.
Based on my calculation, the aggregate Piotroski F-score and return on assets are above the values of IWV. These metrics point to a portfolio quality slightly superior to the benchmark.
|
LVHD |
IWV |
|
|
Piotroski F-score |
5.33 |
5.08 |
|
ROA % TTM |
6.53 |
3.63 |
Takeaway
LVHD holds 95 dividend stocks of profitable U.S. companies, selected based on yield, price volatility, and earnings volatility. Valuation and quality metrics look more attractive than the benchmark (Russell 3000 index). Almost 45% of asset value is in two defensive sectors: utilities and consumer staples. The total return since inception is disappointing compared to the Russell 3000 and to dividend ETFs like SCHD or VIG. However, it may be too early to judge it with only 7 years of data, mostly in a strong bull market.
In the last 12 months, Franklin U.S. Low Volatility High Dividend Index ETF has done quite well, mitigating drawdowns and beating SCHD and VIG by a short margin. The bear market of 2022 was a successful proof of concept for the fund. For transparency, my equity investments are split between a passive ETF allocation (LVHD is not part of it) and an actively managed stock portfolio, whose positions and trades are disclosed in Quantitative Risk & Value.
Be the first to comment