

Ridofranz
Healthcare REIT’s have outperformed the REIT average thus far this year. According to Hoya Capital Income Builder, the average total return for Healthcare REITs this year is (-7.81)%, while the Equity REIT Index currently stands at (-15.41)%
Hoya Capital Income Builder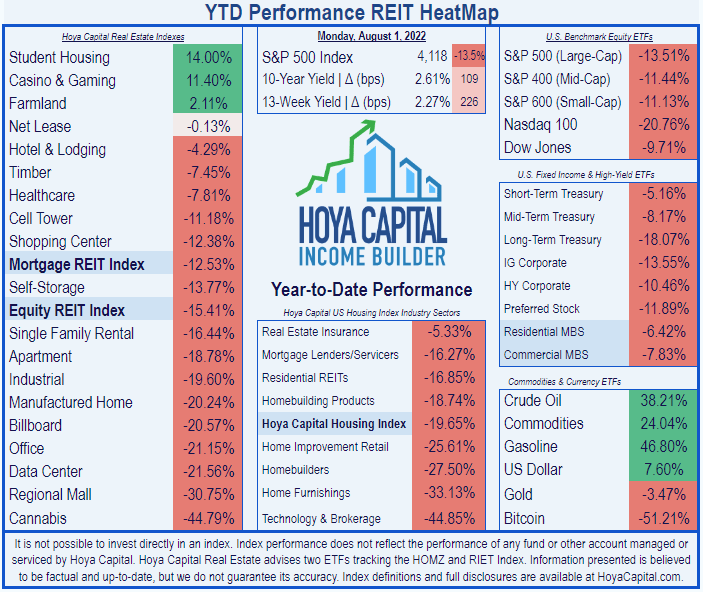
LTC Properties (NYSE:LTC) has been a standout in 2022, outperforming the Healthcare REIT sector and REITs overall by a wide margin. One of relatively few REITs actually making positive returns this year, LTC’s share price is up a sizzling 23.35% YTD (year-to-date).
Seeking Alpha Premium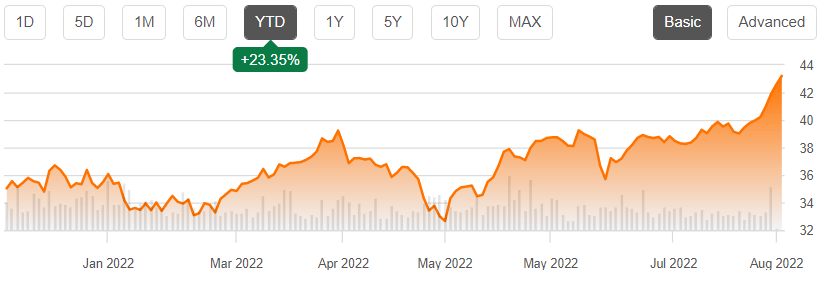
What explains this rocket ride, and will it continue?
Meet the company
LTC Properties
Founded in 1992 and headquartered in Westlake Village, California, this 30-year-old REIT specializes in senior housing and skilled nursing facilities, earning its revenue mostly through triple-net leases and mortgage and mezzanine loans. The company owns 153 properties, and has loan investments in 49 others.
The owned portfolio represents about three-quarters of their investments, with mortgage loans accounting for just over 20%. Those loans have a weighted average maturity of 15.7 years. The company also enters occasionally into joint ventures, but such investments account for only 1% of their holdings.
Company Q2 2022 Supplemental Data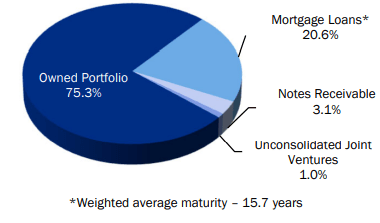
Of the company’s revenue, 71% comes from the owned properties, 26% from loans, with the remaining 3% from notes receivable and joint ventures.
Company Q2 2022 Supplemental Data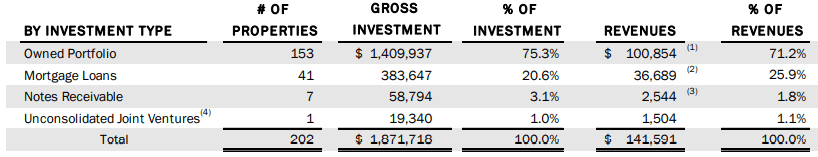
Nearly all of LTC investments go almost equally into two types of properties: ALFs (assisted living facilities) which account for 50% of their investments, and SNFs (skilled nursing facilities), which account for 48%. Occupancy rate for the ALFs is currently only 75%, with SNF occupancy reported at 70%.
The average age of the company’s SNFs is 21 years, and the average age of the ALFs is 14 years. Reducing the average age of the portfolio is one of LTC’s goals going forward. Contractual rent and mortgage collection through H1 2022 was 95%, with 3% abated and 2% deferred, as operators emerge from the first two years of COVID.
Company Q2 2022 Supplemental Data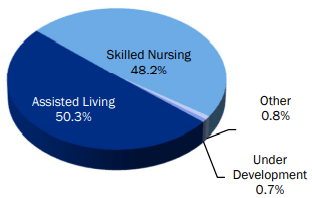
Similarly, these two types of properties account for approximately equal shares of the company’s rental revenue, with ALFs comprising 37% and from SNFs accounting for 34%.
Company Q2 2022 Supplemental Data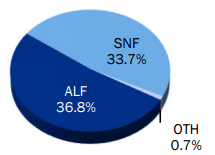
However, the interest income is predominantly from SNFs (23%), with only 2.4% from ALFs.
Company Q2 2022 Supplemental Data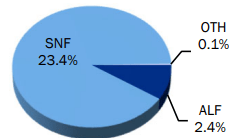
Lease and loan expirations are pretty well spread out. Leases accounting for 12% of revenue expire in 2023, and 11.5% in 2026, but between now and 2029, that figure averages only 4.25% in the other years, with only 3.6% expiring this year. Loan expirations are even more favorable, with the vast bulk of those revenues expiring after 2029.
Company Q2 2022 Supplemental Data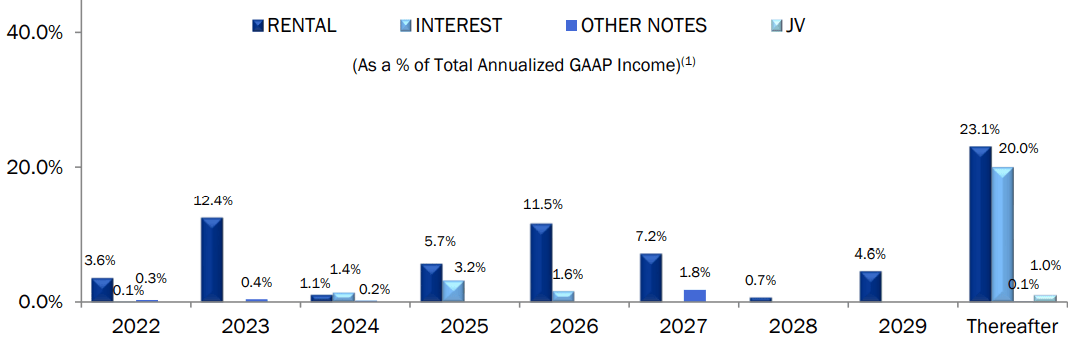
The company’s investments are spread out over 32 operators in 29 U.S. states, with the largest concentrations in Texas, Michigan, North Carolina, Colorado, and Florida.
Company Q2 2022 Supplemental Data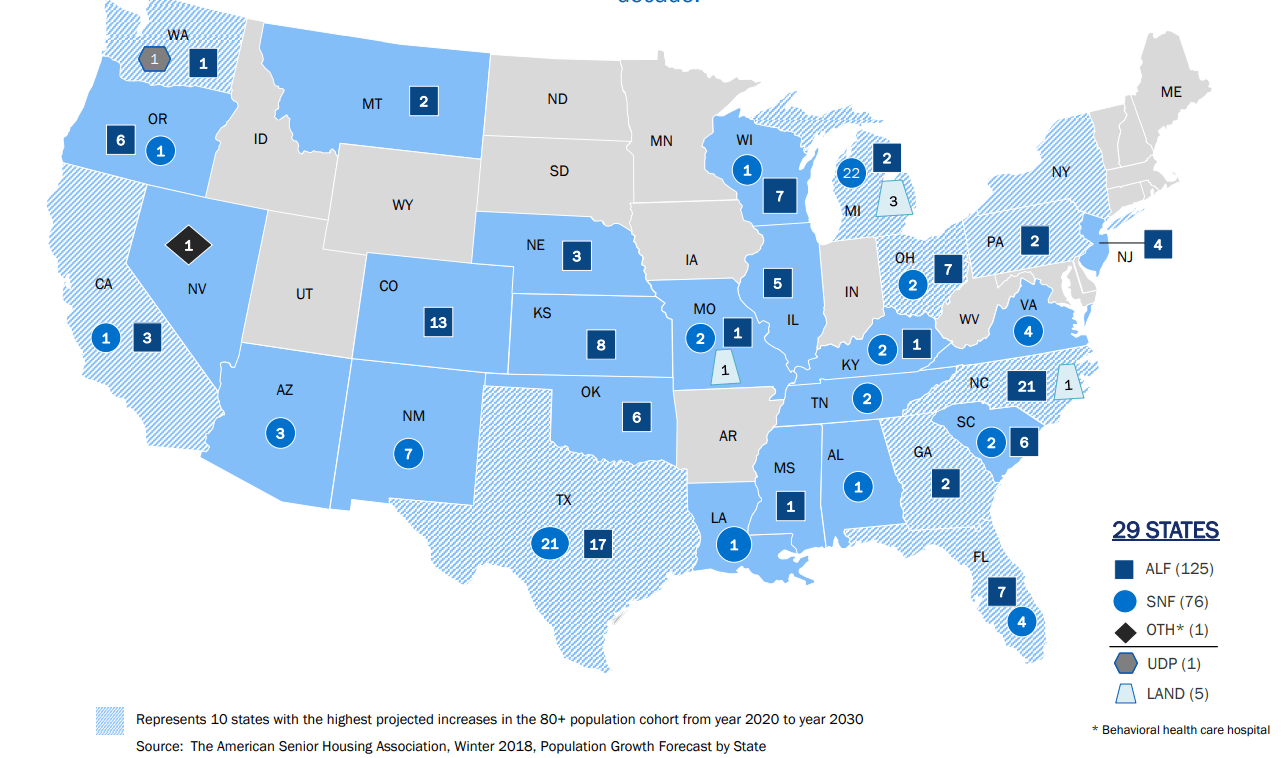
The tenant roster is not ideally diversified, as Prestige Healthcare’s 24 properties account for about 18% of cash income, with Brookdale Senior Living accounting for 9.8%, Carespring Health Care Management 6.8%, and the top 10 combining for a whopping 73%.
Company Q2 2022 Supplemental Data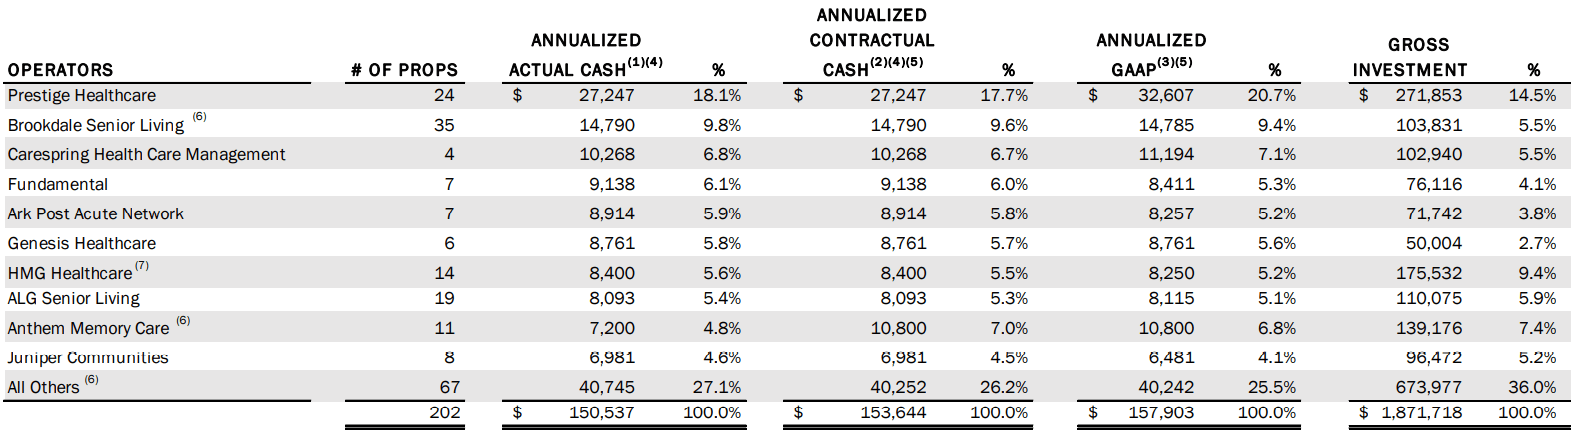
About half of LTC’s portfolio is located in the top 31 MSAs (metropolitan statistical areas), with the remaining half in secondary markets. This is a plus, as there has been a well-documented population shift over the past two years, toward secondary and Sunbelt cities.
Company Q2 2022 Supplemental Data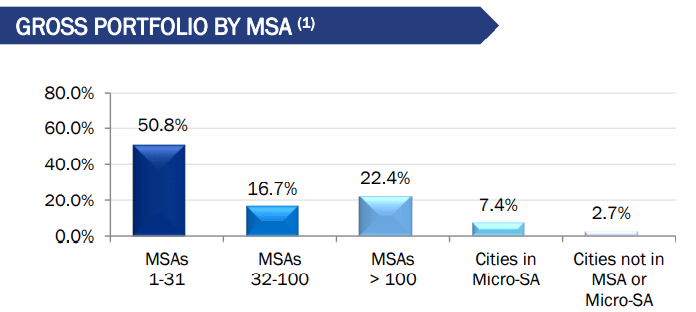
According to the company’s Q2 Supplemental, thus far in 2022, LTC has
- acquired 4 more properties, all senior housing facilities in Texas, for a total investment of $51.5 million, at a cap rate of 8.0%,
- made two new 7.25% loans, totaling $35.9 million, to ALG Senior Living for facilities in North Carolina, and
- made five new 8.0% mezzanine loans The Springs Living centers in Oregon and Montana, totaling $25 million.
Quarterly results in good health
LTC reported quarterly results last Friday, July 29. Chairman and CEO Wendy Simpson mentioned on the Q2 conference call that LTC has divested $72 million worth of properties thus far in 2022. She went on to say this:
while there is still some heavy lifting needed by our operators to return to a pre-pandemic environment, including occupancy and rent increases, a more permanent solution to ongoing staffing issues, and an easing of the inflationary pressures being felt by us all, we are steadfastly moving in the right direction with a strong sense of hope for the future. . . I believe our industry and LTC specifically is successfully emerging from the worst of the COVID crisis.
Here are the financial highlights:
- Total revenue $43.0 million, up 12.8% YoY (year-over-year)
- Total revenue for H1 2022 of $83.8 million, up 6.9% YoY
- Net income of $54.5 million, almost tripling YoY
- Net income per share of $1.37, compared to $0.46 this time last year.
- FFO per share of $0.64, up 12.3% YoY
- Funds available for distribution $26.8 million, up 17.5% YoY
These increases should be taken with a grain of salt, since the comparables from a year ago were COVID-blighted.
Growth metrics
Here are the 3-year growth figures for FFO (funds from operations), TCFO (total cash from operations), and market cap.
| Metric | 2018 | 2019 | 2020 | 2021 | 3-year CAGR |
| FFO (millions) | $121.2 | $122.7 | $94.6 | $86.2 | — |
| FFO Growth % | — | 1.2 | (-23.0) | (-8.9) | (-10.74) |
| FFO per share | $3.06 | $3.08 | $2.41 | $2.20 | — |
| FFO per share growth % | — | 0.6 | (-21.8) | (-8.7) | (-10.42) |
| TCFO (millions) | $115.5 | $122.5 | $116.1 | $91.1 | — |
| TCFO Growth % | — | 6.1 | (-5.2) | (-21.5) | (-16.32) |
| Market Cap (billions) | $1.65 | $1.77 | $1.52 | $1.34 | — |
| Market Cap Growth % | — | 7.3 | (-14.1) | (-11.8) | (-6.70) |
Source: TD Ameritrade, CompaniesMarketCap.com, and author calculations
COVID hit LTC hard, and while the company is recovering, it is still well below 2019 levels of revenue and cash flow.
LTC escaped small-cap status in 2014, but has not grown much since then. In 2021, the company briefly fell slightly under the $1.4 billion threshold, but thanks to the run-up in share prices, market cap now stands at $1.73 billion, slightly smaller than direct competitor CareTrust (CTRE).
Meanwhile, here is how the stock price has done over the past 3 twelve-month periods, compared to the REIT average as represented by the Vanguard Real Estate ETF (VNQ).
| Metric | 2019 | 2020 | 2021 | 2022 | 3-yr CAGR |
| LTC share price Aug. 1 | $46.06 | $37.15 | $37.85 | $43.21 | — |
| LTC share price Gain % | — | (-19.3) | 1.9 | 14.2 | (-2.11) |
| VNQ share price Aug. 1 | $88.89 | $81.39 | $106.29 | $98.16 | — |
| VNQ share price Gain % | — | (-8.4) | 30.6 | (-7.6) | 3.36 |
Source: MarketWatch.com and author calculations
LTC took a heavier blow than the average REIT in 2020, and hardly benefitted at all from the roaring REIT bull market of 2021, so although it is outperforming thus far this year, it has significantly underperformed the VNQ.
Balance sheet metrics
Here are the key balance sheet metrics. LTC’s liquidity and Debt/EBITDA ratios are slightly better than both the Healthcare REIT average and the overall REIT average, but its debt ratio lags both.
| Company | Liquidity Ratio | Debt Ratio | Debt/EBITDA | Bond Rating |
| LTC | 2.04 | 35% | 6.3 | — |
Source: Hoya Capital Income Builder, TD Ameritrade, and author calculations
The company’s total debt comes to just under $737 million, with a weighted average interest rate of 3.9%. The vast majority of this debt is held in senior unsecured notes at a weighted average 4.3% interest.
Company Q2 2022 Supplemental Data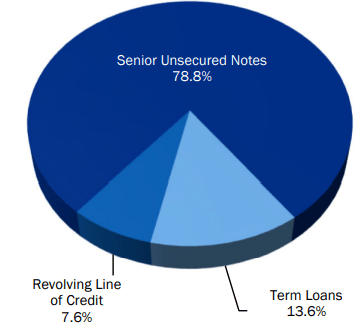
Debt maturities are nicely spread out, with an average of about 7% coming due each year, except in 2025 and 2026, when maturities jump to 21% and 14%, respectively.
Company Q2 2022 Supplemental Data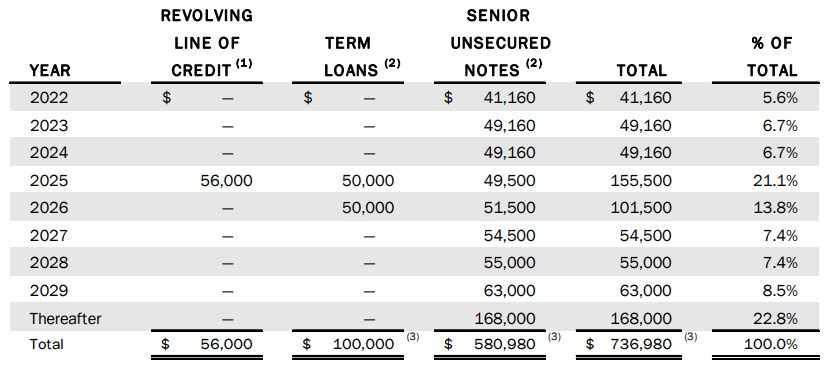
Dividend metrics
LTC Properties is a strong payer, and did not cut its dividend in response to the COVID crisis, as most Healthcare REITs did. So despite no dividend growth in the past 3 years, LTC earns a much higher Dividend Score than the average REIT overall and the average Healthcare REIT.
| Company | Div. Yield | 3-yr Div. Growth | Div. Score | Payout | Div. Safety |
| LTC | 5.33% | 0.0% | 5.33 | 90% | D |
Source: Hoya Capital Income Builder, TD Ameritrade, Seeking Alpha Premium
Last December 1, the stock price had fallen to $31.36, so shares were yielding 7.3%, which helps explain the run-up in share prices. The payout ratio of 90% is a little scary, and helps explain why Seeking Alpha Premium assigns the company a somewhat shaky Dividend Safety grade of D. CEO Wendy Simpson acknowledged on the Q2 earnings call that this payout ratio is considerably higher than their target of 80%.
Dividend Score projects the Yield three years from now, on shares bought today, assuming the Dividend Growth rate remains unchanged.
Valuation metrics
LTC is reasonably priced, very near the Healthcare REIT average, but sells at a 29.6% premium to NAV. This means they can issue shares accretively to fuel external growth, but most value investors see this as a red flag.
| Company | Div. Score | Price/FFO ’22 | Premium to NAV |
| LTC | 5.33 | 16.7 | 29.6% |
Source: Hoya Capital Income Builder, TD Ameritrade, and author calculations
What could go wrong?
The biggest challenge for LTC is the shortage of skilled nurses. Bedside RN turnover rose to an all-time high of 18.6% in 2020, and in a survey in May 2021, another 22% of nurses reported strongly eyeing the exits.
It’s no wonder so many nurses quit the profession as a result of the COVID pandemic. As McKinsey’s Gretchen Berlin writes:
. . . increasing demands placed on healthcare workers created both a physical strain on those working on the frontlines, and a psychological strain for those losing patients, or in some tragic cases, coworkers and loved ones.
The ANA (American Nurses Association) predicts another 500,000 nurses will leave the profession in 2022, leaving a shortage of 1.1 million. The remaining nurses will be in a strong position to negotiate salary and benefits, if they are so inclined, raising LTC’s cost of operation and that of their tenants.
According to the ANA:
During the pandemic, demand for RNs surged. This combined with other existing factors to considerably worsen the nursing shortage and expose the workplace challenges nurses face. Nurses are under immense stress and feel the full weight of an overburdened, poorly functioning health care system.
It will take years for the supply of new nurses to meet the demand for their services. The aging of the U.S. population, which is a tailwind for most Medical REITs, works against LTC to some extent, because it intensifies the demand for skilled nurses. According to the ANA, more registered nurse jobs will be available through 2022 than any other profession in the United States.
There is always the possibility of another wave of COVID, although with wider vaccination and herd immunity, hopefully any future wave will be less deadly than past surges.
LTC Properties also competes directly with slightly larger CareTrust, which I named in March as the best bet for long-term investment in Healthcare REITs. CTRE shares have run up more than 30% over the past three months.
Investor’s bottom line
LTC Properties is recovering nicely from the COVID gut-punch, and will probably continue, but is still not back to pre-COVID levels of revenue or cash flow, and is not expected to reach those levels in the next two years. The company has benefitted from pent-up demand for senior housing and assisted living, and from the stampede to high-yielding securities in general. While continued strengthening is likely, there are better bets in the Healthcare REIT space, even if LTC manages to continue avoiding a dividend cut. I view LTC as a Hold.
This puts me in company with other Seeking Alpha authors and Wall Street analysts, as well as The Street and Ford Equity Research. The average Wall Street analyst price target is $40.00, implying downside of (-7.4)%.
However, the Seeking Alpha Quant ratings show the company as a Strong Buy, mightily impressed with its momentum and revisions. As you might expect, revisions-sensitive Zacks concurs with this more optimistic view, as does TipRanks, impressed by the company’s 16.68% return on equity and 11.42% asset growth over the past 12 months.
Seeking Alpha Premium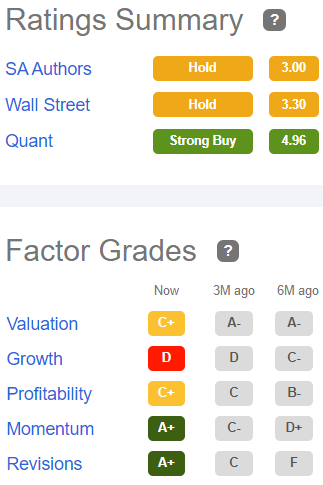
So as usual, it’s anybody’s guess.
Be the first to comment