

Jose Luis Pelaez Inc/DigitalVision via Getty Images
Achieving your financial dreams is not as hard as you might think.
- Buy the right companies
- At the right prices
- Within a diversified and prudently risk-managed portfolio
- And wait for trustworthy and dependable companies to make you rich
It’s really as simple as that.
Today, I want to highlight Lowe’s (NYSE:LOW), which is my single highest priority in all future market downturns.
I and other Dividend Kings analysts have been pounding the table about Lowe’s in recent weeks.
- I’ve personally bought more… three times
Why? Because LOW is potentially the best dividend stock on earth.
Reasons To Potentially Buy Lowe’s
- 100% quality low-risk 13/13 Ultra SWAN Dividend King
- Very safe 1.6% yield (100% safety score)
- 0.5% approximate average recession dividend cut risk
- 1% approximate severe recession dividend cut risk
- 59-year dividend growth streak
- 26% conservatively undervalued (potential very strong buy)
- Fair Value: $274.92 (20x earnings)
- 14.7x earnings vs. 19 to 21 historical
- BBB+ stable outlook credit rating = 5% 30-year bankruptcy risk
- Risk management consensus 87th industry percentile = Very Good, bordering on exceptional
- 13% to 24% CAGR margin-of-error growth consensus range
- 20.5% CAGR median growth consensus
- 5-year consensus total return potential: 20% to 25% CAGR
- Base-case 5-year consensus return potential: 22% CAGR (6.5x market consensus)
- Consensus 12-month total return forecast: 38% (18.0 P/E, very reasonable)
- Fundamentally Justified 12-Month Returns: 37% CAGR
Lowe’s offers absolutely stunning long-term return potential.
How strong is my conviction in LOW?
Lowe’s Is 25% Of My Future Correction Buying Plan
(Source: DK Correction Planning Tool)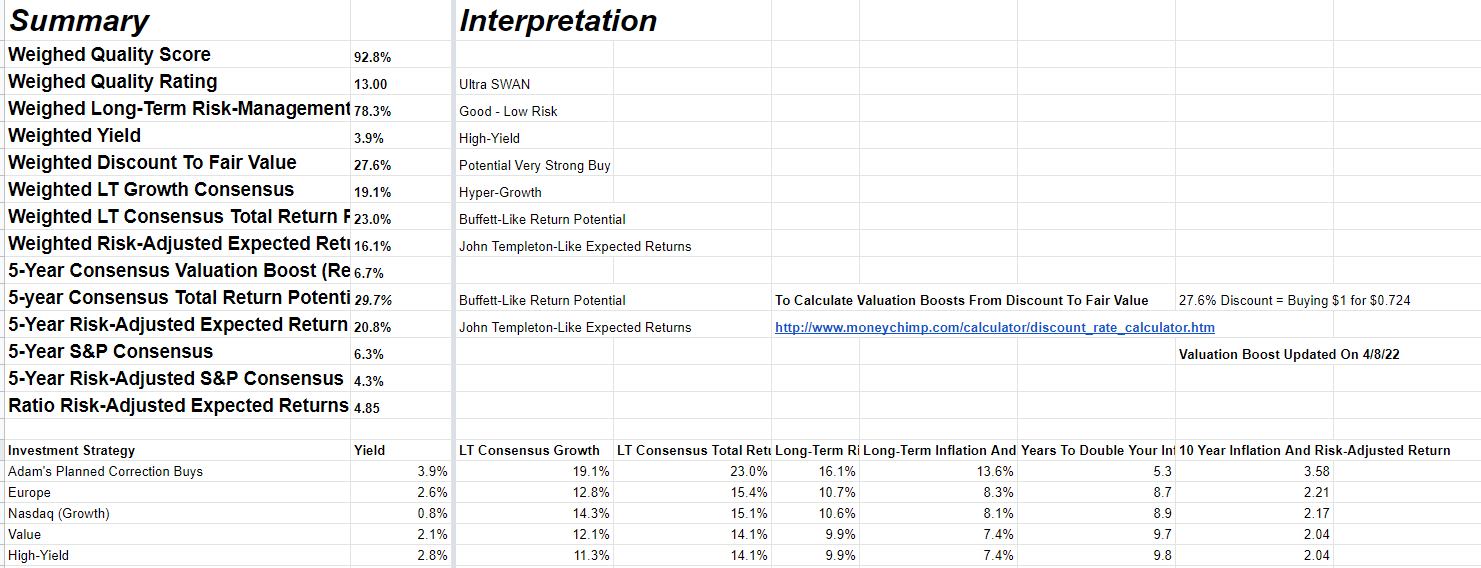
LOW is at the heart of my pure Ultra SWAN correction/bear market plan which generates 3.9% yield from the world’s best Ultra SWAN quality blue-chips.
Yield almost as high as junk bonds, from companies analysts expect to grow at 19% over time, for a Buffett-like 23% long-term return potential.
- 16.1% CAGR risk-adjusted expected returns are better than John Templeton’s 15.8% long-term returns
Basically, Lowe’s is the heart of my high-yield/fast-dividend growth future portfolio plans.
And here’s why.
| Investment Strategy | Yield | LT Consensus Growth | LT Consensus Total Return Potential | Long-Term Risk-Adjusted Expected Return | Long-Term Inflation And Risk-Adjusted Expected Returns | Years To Double Your Inflation & Risk-Adjusted Wealth |
10 Year Inflation And Risk-Adjusted Return |
| Lowe’s | 1.6% | 20.5% | 22.1% | 15.5% | 13.0% | 5.5 | 3.39 |
| Adam’s Planned Correction Buys | 3.9% | 19.1% | 23.0% | 16.1% | 13.6% | 5.3 | 3.58 |
| Nasdaq (Growth) | 0.8% | 14.3% | 15.1% | 10.6% | 8.1% | 8.9 | 2.17 |
| Dividend Aristocrats | 2.2% | 8.9% | 11.1% | 7.8% | 5.3% | 13.6 | 1.67 |
| S&P 500 | 1.4% | 8.5% | 9.9% | 7.0% | 4.5% | 16.1 | 1.55 |
(Sources: Morningstar, FactSet, YCharts)
Lowe’s is an absolute safe dividend growth powerhouse.
YCharts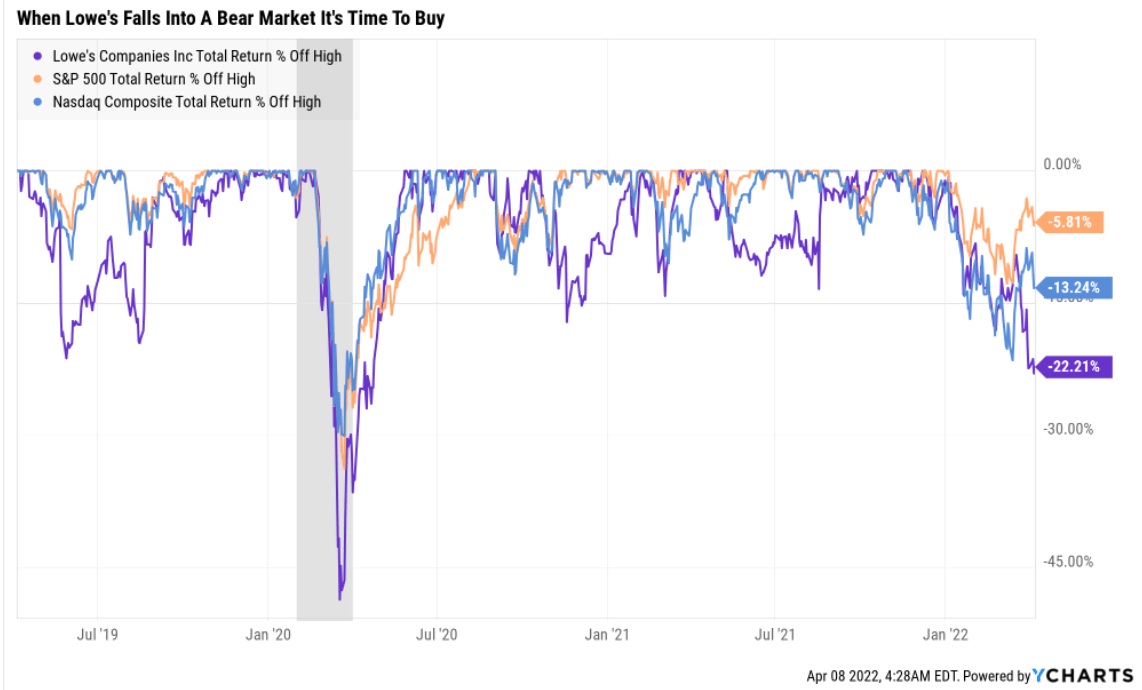
LOW is in a bear market for no good fundamental reason.
Lowe’s Rolling Returns Since 1986
(Source: Portfolio Visualizer Premium)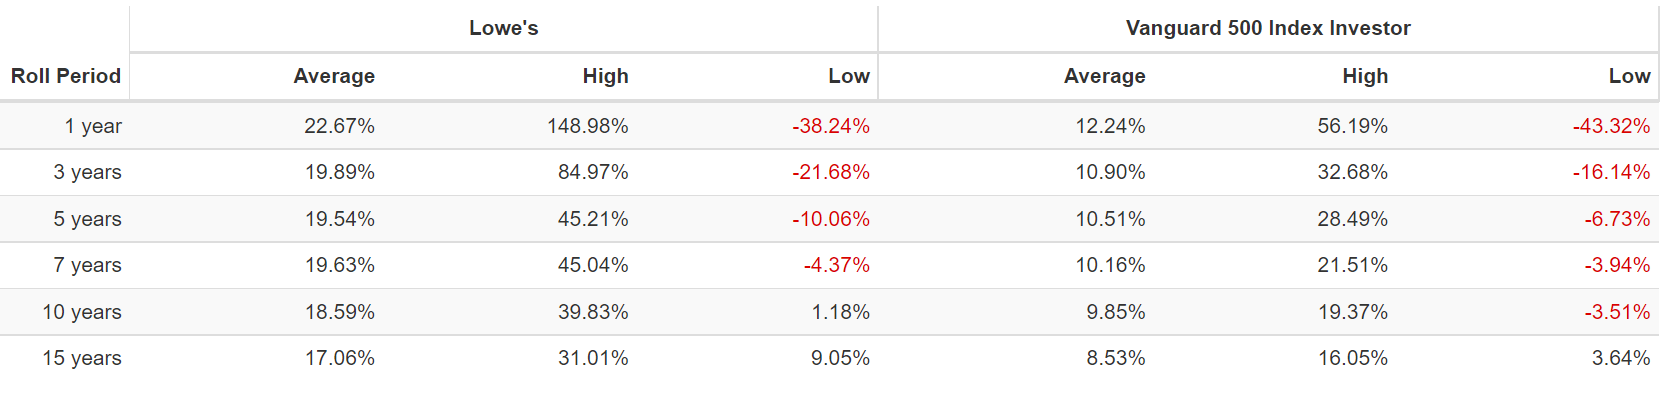
Lowe’s has historically delivered 17% to 19% annual returns but from bear market lows as much as 31% annually for the next 15 years.
- As much as 57.5x returns in 15 years
LOW’s 2025 Consensus Total Return Potential
(Source: FAST Graphs, FactSet)
Over the next few years, analysts think LOW’s could deliver Buffett-like 21% annual returns.
LOW’s 2028 Consensus Total Return Potential
(Source: FAST Graphs, FactSet)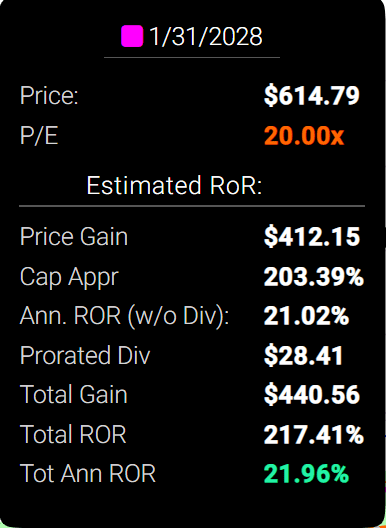
Through January 2028, analysts think LOW could deliver 22% annual returns, more than tripling your money.
- Approximately 6.5x the S&P 500’s consensus return potential
But wait, it gets better.
LOW Inflation-Adjusted Consensus Total Return Potential: $1,000 Initial Investment
| Time Frame (Years) | 7.4% CAGR Inflation-Adjusted S&P Consensus | 8.6% Inflation-Adjusted Aristocrat Consensus | 19.6% CAGR Inflation-Adjusted Low Guidance | Difference Between Inflation Adjusted LOW And S&P Consensus |
| 5 | $1,429.63 | $1,511.29 | $2,448.15 | $936.85 |
| 10 | $2,043.84 | $2,284.01 | $5,993.42 | $3,709.41 |
| 15 | $2,921.94 | $3,451.81 | $14,672.78 | $11,220.97 |
| 20 | $4,177.29 | $5,216.70 | $35,921.11 | $30,704.41 |
| 25 | $5,971.97 | $7,883.98 | $87,940.16 | $80,056.18 |
| 30 | $8,537.71 | $11,915.01 | $215,290.42 | $203,375.41 |
(Source: DK Research Terminal, FactSet)
Even a modest investment in Low’s today could turn into a significant, life-changing fortune in the decades to come.
| Time Frame (Years) | Ratio Aristocrats/S&P | Ratio Inflation-Adjusted Low Consensus Vs. S&P Consensus |
| 5 | 1.06 | 1.71 |
| 10 | 1.12 | 2.93 |
| 15 | 1.18 | 5.02 |
| 20 | 1.25 | 8.60 |
| 25 | 1.32 | 14.73 |
| 30 | 1.40 | 25.22 |
(Source: DK Research Terminal, FactSet)
Potentially even delivering 25x the inflation-adjusted wealth of the S&P 500.
Think I and analysts are being overly optimistic?
Historical Returns Since 1986
(Source: Portfolio Visualizer Premium)
(Source: Portfolio Visualizer Premium)
LOW has delivered 154x inflation-adjusted returns since 1986 or almost 9x better than the S&P 500.
Maybe Lowe’s can’t grow at 20.5% for decades, but the point is this is one of the fattest pitches on Wall Street today.
Wait for a fat pitch and swing for the fences.” – Warren Buffett
So let me show you the three reasons why I and Dividend Kings’ analysts are so bullish on Lowe’s.
Simply put, the world’s best dividend growth stock could help you retire in safety and splendor.
Reason One: Exceptional Quality You Can Trust In All Economic Conditions
The Dividend King’s overall quality scores are based on a 248 point model that includes:
-
Dividend safety
-
Balance sheet strength
-
Credit ratings
-
Credit default swap medium-term bankruptcy risk data
-
Short and long-term bankruptcy risk
-
Accounting and corporate fraud risk
-
Profitability and business model
-
Growth consensus estimates
-
Management growth guidance
-
Historical earnings growth rates
-
Historical cash flow growth rates
-
Historical dividend growth rates
-
Historical sales growth rates
-
Cost of capital
-
GF Scores
-
Long-term risk-management scores from MSCI, Morningstar, FactSet, S&P, Reuters’/Refinitiv, and Just Capital
-
Management quality
-
Dividend friendly corporate culture/income dependability
-
Long-term total returns (a Ben Graham sign of quality)
-
Analyst consensus long-term return potential
In fact, it includes over 1,000 fundamental metrics including the 12 rating agencies we use to assess fundamental risk.
- Credit and risk management ratings make up 41% of the DK safety and quality model
- Dividend/balance sheet/risk ratings make up 82% of the DK safety and quality model
How do we know that our safety and quality model works well?
During the two worst recessions in 75 years, our safety model predicted 87% of blue-chip dividend cuts, the ultimate baptism by fire for any dividend safety model.
And then there’s the confirmation that our quality ratings are very accurate.
DK Zen Phoenix: Superior Fundamentals Lead To Superior Long-Term Results
| Metric | US Stocks | 190 Real Money DK Phoenix Recs |
| Great Recession Dividend Growth | -25% | 0% |
| Pandemic Dividend Growth | -1% | 6% |
| Positive Total Returns Over The Last 10 Years | 42% | 99.5% (Greatest Investors In History 60% to 80% Over Time) |
| Lost Money/Went Bankrupt Over The Last 10 Years | 47% | 0.5% |
| Outperformed Market Over The Last Decade (290%) | 36% | 46% |
| Bankruptcies Over The Last 10 Years | 11% | 0% |
| Permanent 70+% Catastrophic Decline Since 1980 | 44% | 0.5% |
| 100+% Total Return Over The Past 10 Years | NA | 87% |
| 200+% Total Return Over The Past 10 Years | NA | 66% |
| 300+% Total Return Over The Past 10 Years | NA | 44% |
| 400+% Total Return Over The Past 10 Years | NA | 35% |
| 500+% Total Return Over The Past 10 Years | NA | 27% |
| 600+% Total Return Over The Past 10 Years | NA | 23% |
| 700+% Total Return Over The Past 10 Years | NA | 20% |
| 800+% Total Return Over The Past 10 Years | NA | 18% |
| 900+% Total Return Over The Past 10 Years | NA | 18% |
| 1000+% Total Return Over The Past 10 Years | NA | 16% |
| Sources: Morningstar, JPMorgan, Seeking Alpha |
Basically, historical market data confirms that the DK safety and quality model is one of the most comprehensive and accurate in the world.
This is why I entrust 100% of my life savings to this model and the DK Phoenix blue-chip strategy.
How does LOW score on one of the world’s most comprehensive and accurate safety and quality models?
LOW Dividend Safety
| Rating | Dividend Kings Safety Score (151 Point Safety Model) | Approximate Dividend Cut Risk (Average Recession) |
Approximate Dividend Cut Risk In Pandemic Level Recession |
| 1 – unsafe | 0% to 20% | over 4% | 16+% |
| 2- below average | 21% to 40% | over 2% | 8% to 16% |
| 3 – average | 41% to 60% | 2% | 4% to 8% |
| 4 – safe | 61% to 80% | 1% | 2% to 4% |
| 5- very safe | 81% to 100% | 0.5% | 1% to 2% |
| LOW | 100% | 0.5% | 1.0% |
| Risk Rating | Low Risk (87th industry percentile risk-management consensus) | BBB+ stable outlook credit rating 5% 30-year bankruptcy risk | 20% OR LESS Max Risk Cap Recommendation |
Long-Term Dependability
| Company | DK Long-Term Dependability Score | Interpretation | Points |
| Non-Dependable Companies | 21% or below | Poor Dependability | 1 |
| Low Dependability Companies | 22% to 60% | Below-Average Dependability | 2 |
| S&P 500/Industry Average | 61% (58% to 70% range) | Average Dependability | 3 |
| Above-Average | 71% to 80% | Very Dependable | 4 |
| Very Good | 81% or higher | Exceptional Dependability | 5 |
| LOW | 100% | Exceptional Dependability | 5 |
Overall Quality
| LOW | Final Score | Rating |
| Safety | 100% | 5/5 very safe |
| Business Model | 100% | 3/3 wide moat |
| Dependability | 100% | 5/5 exceptional |
| Total | 100% | 13/13 Ultra SWAN dividend king |
| Risk Rating | 3/3 Low Risk | |
| 20% OR LESS Max Risk Cap Rec |
5% Margin of Safety For A Potentially Good Buy |
LOW: #1 Highest Quality Master List Company (Out of 508) = 100th Percentile
The DK 500 Master List includes the world’s highest quality companies including:
-
All dividend champions
-
All dividend aristocrats
-
All dividend kings
-
All 13/13 Ultra Swans (as close to perfect quality as exists on Wall Street)
- 49 of the world’s best growth stocks
LOW’s 100% quality score means its similar in quality to such blue-chips as
- Mastercard (MA)
- Microsoft (MSFT)
- Colgate-Palmolive (CL) – dividend king
- Adobe (ADBE)
- Visa (V)
- V.F. Corp (VFC) – dividend king
- S&P Global (SPGI) – dividend king
- Novartis – global aristocrat
- NIKE (NKE)
- Allianz SE (OTCPK:ALIZY)
Basically,
- From the perspective of dividend growth investors, Lowe’s is arguably the highest quality company on earth
- A leader among the world’s premier blue-chips by all other standards
Why I Trust Lowe’s With My Retirement Savings And So Can You
Lowe’s was founded in 1946 in North Carolina.
- Raising its dividend every year since 1963
- Through eight recessions
- 2 economic crises
- The housing crisis
- Oil prices as high as $147
- Inflation as high as 15%
- Interest rates as high as 20%
- Six bear markets
- Dozens of corrections and pullbacks
Basically, Lowe’s is built to last and will likely outlive us all.
- The ultimate buy-and-hold forever dividend growth blue-chip
Here are the highlights.
(Source: investor 2022 update)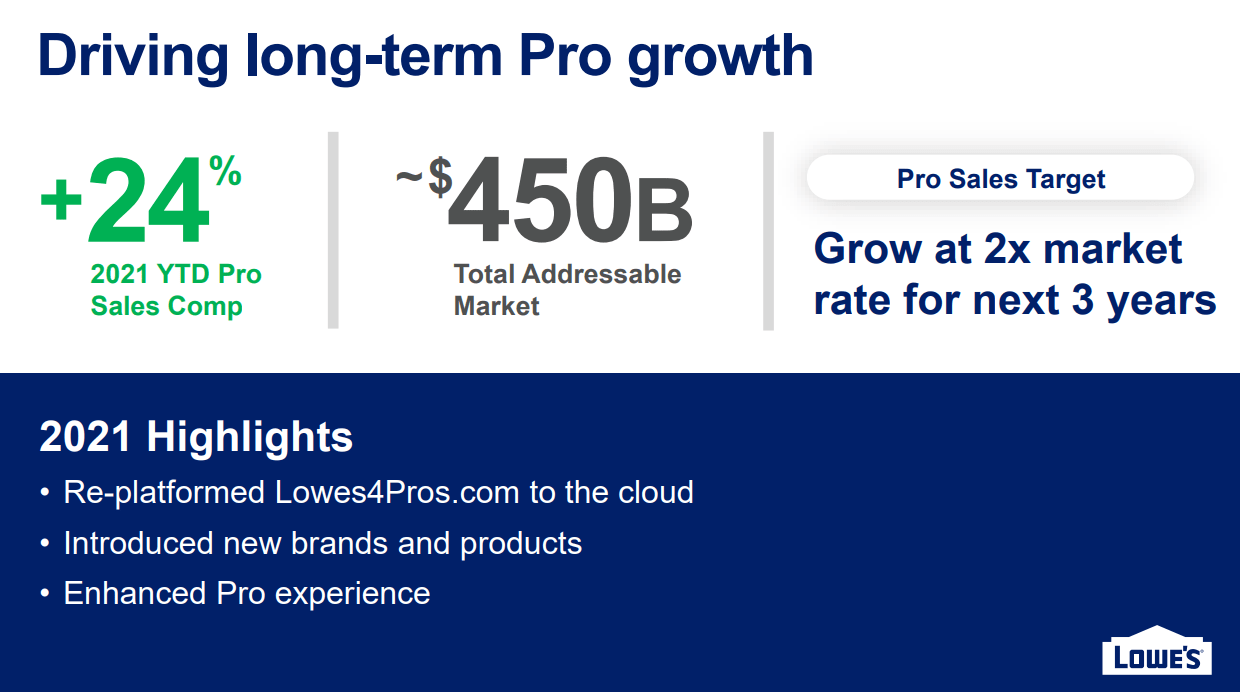
LOW is focused on expanding its market share in professionals who buy larger amounts on a more predictable schedule.
- This is a $450 billion addressable market
- Growing at 2x the market’s rate
- 24% Pro sales growth in 2021
- Lowe’s revamped its Pro sites and platform in 2021 to great success
(Source: investor 2022 update) (Source: investor 2022 update)

Lowe’s is streamlining its logistical supply chain from eight steps to four.
- Consumers get their products faster, more conveniently, and at better prices
(Source: investor 2022 update)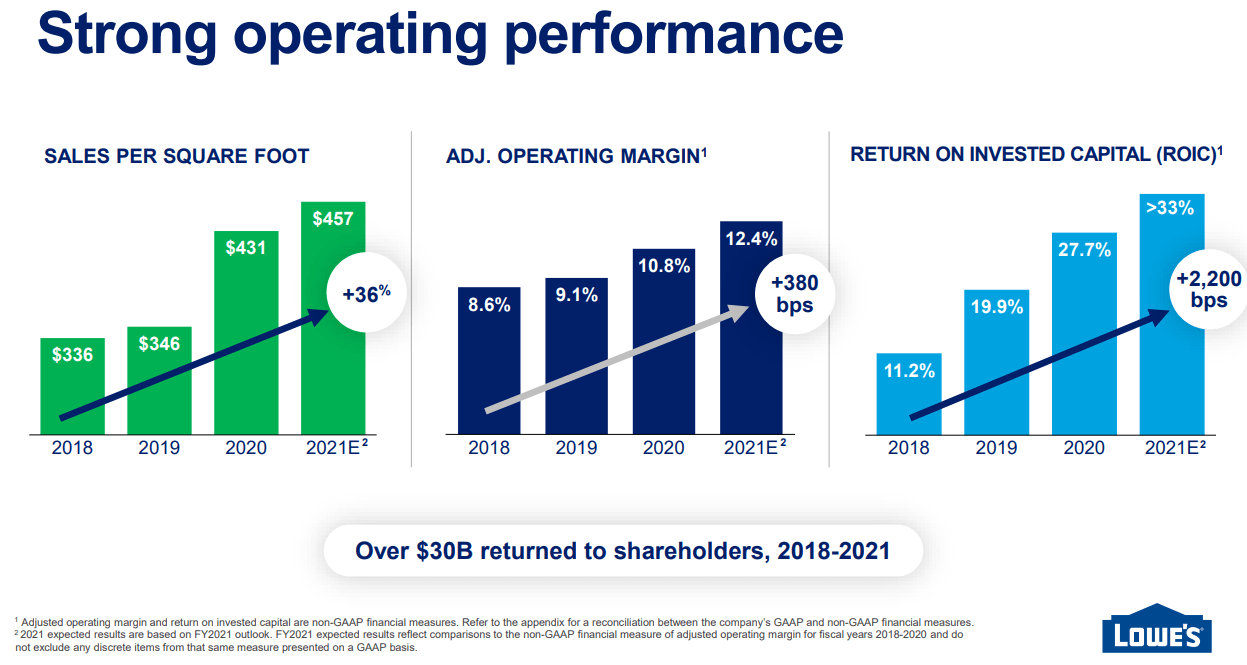
LOW’s execution of its profitability improvement plan has been exceptional.
- Since 2018, sales per square foot up 36%
- Operating margins up 3.8%
- Returns on invested capital up 22% from 11.2% to over 33%
(Source: FactSet Research Terminal)
Analysts expect continued strong growth in LOW’s fundamentals in the coming years.
- Same-store sales growth stable at 3.7% to 4% after the pandemic (+24.2% in 2020 and +8.5% in 2021)
- Sales per square foot growing to $499 by 2024
(Source: investor 2022 update)
LOW has around $98 billion in annual sales vs. a $900 billion addressable market.
- 11% market share despite the 2nd best economies of scale
- 75% DIY and 25% Pro vs. 50/50 overall market
(Source: investor 2022 update)
For 2022, management is guiding for:
- 0% to -3% comps
- $12 billion in buybacks = 9% of shares
- 35% returns on invested capital
- $2 billion in growth spending
(Source: investor 2022 update)
LOW plans to return $40 billion to shareholders over the next three years while retaining its BBB+ stable credit rating.
- Buyback authorization was recently raised to $20 billion
- Targeting a long-term 35% payout ratio vs. 60% safe for this industry
During the fourth quarter, we paid $551 million in dividends and repurchased approximately 16 million shares for $4 billion. This brought the total to $13.1 billion in share repurchases for the year, ahead of our expectations of $12 billion. This reflected better than expected financial performance and our commitment to return excess cash to shareholders.” – CFO Q4 conference call
Investment Thesis Summary: All About Margin Expansion, Hyper-Growth, And A 10 to 20-Year Housing Boom
(Source: investor 2022 update)
- Secular mega-trend in housing for the next 20 years
- 2nd best economies of scale
- Leading to industry-leading profit expansion
- 11% market share despite being the #2 home improvement retailer
- 87th industry percentile risk-management
- A proven management team that’s great at capital allocation
Management You Can Trust
- “Since Marvin Ellison took the helm in 2018, a full overhaul of Lowe’s C-suite, board, and merchandising team has ensued.” – Morningstar
- “Our Capital Allocation rating for Lowe’s is Exemplary.” – Morningstar
- Since the beginning of 2018, Lowe’s hired a new CEO, a new chief digital officer (from Amazon), as well as heads of merchandising (Chevron), stores (J.C. Penney, Home Depot), and supply chain (Walmart), and a new CFO (CVS Health).
We define exceptional management quality as a company as:
- Sustains a wide moat for 20+ years
- 20+ year dividend growth streak
- Thus we agree with Morningstar that LOW has an exceptional management team and a very friendly dividend culture
Daily Shot
The US has a shortfall of 5 to 6 million homes and 150 million Millennials and Gen Zers starting families and looking to buy homes.
- Even with rising interest rates and soaring home prices, new housing starts are expected to keep rising steadily through at least 2023 according to Moody’s
Daily Shot 
The current supply of homes on the US market is 470,000, the lowest in recorded history.
- Adjusted for population absolutely the lowest in history
Homebuilders are facing a shortage of labor and building materials.
- Even if housing demand starts to cool, supply is likely to remain below demand for many years
Morgan Stanley estimates a 10 to 20-year housing boom is underway.
- Lowe’s benefits from new home sales but also home repairs
Hoya Capital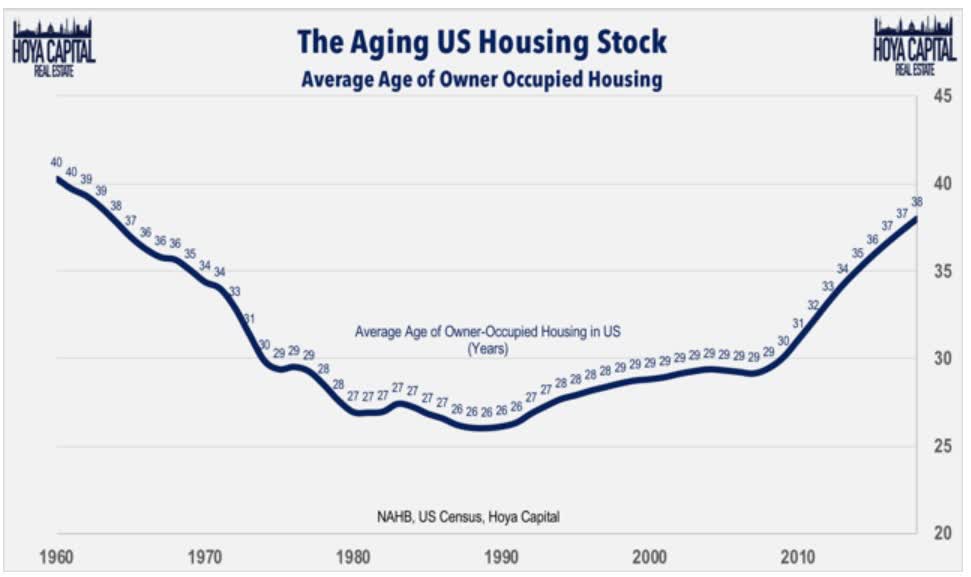
The average US house is now about 40 years old.
- Most houses are built to last 80 years
Housing repair and refurbishment and a steady supply of new homes that sell quickly should create a boom-time for Lowe’s industry.
LOW’s Credit Ratings
| Rating Agency | Credit Rating | 30-Year Default/Bankruptcy Risk | Chance of Losing 100% Of Your Investment 1 In |
| S&P | BBB+ stable | 5.00% | 20.0 |
| Moody’s | Baa1 (BBB+ equivalent) stable | 5.00% | 20.0 |
| DBRS (Canada’s Biggest Rating Agency) | BBB High (BBB+ equivalent) stable | 5.00% | 20.0 |
| Consensus | BBB+ stable | 5.00% | 20.0 |
(Source: S&P, Moody’s)
LOW’s fundamental risk is about 5%, a 1 in 20 chance of losing all your money over the next 30 years.
Low’s Leverage Consensus Forecast
| Year | Debt/EBITDA | Net Debt/EBITDA (3.0 Or Less Safe According To Credit Rating Agencies) |
Interest Coverage (8+ Safe) |
| 2020 | 1.97 | 1.57 | 11.25 |
| 2021 | 1.79 | 1.98 | 13.48 |
| 2022 | 2.02 | 2.03 | 12.41 |
| 2023 | 2.25 | 2.16 | 11.44 |
| 2024 | 2.35 | 2.23 | 13.77 |
| 2025 | 2.41 | NA | NA |
| 2026 | 2.51 | 2.47 | NA |
| 2027 | NA | NA | NA |
| Annualized Change | 4.11% | 7.81% | 5.19% |
(Source: FactSet Research Terminal)
LOW’s is targeting 2.75x debt/EBITDA over the long term as it ramps up growth spending and buybacks.
- Consistent with its BBB+ credit rating
By 2026, analysts expect 2.5x debt/EBITDA but falling interest costs to actually improve interest coverage.
Low’s Balance Sheet Consensus Forecast
| Year | Total Debt (Millions) | Cash | Net Debt (Millions) | Interest Cost (Millions) | EBITDA (Millions) | Operating Income (Millions) | Average Interest Rate |
| 2020 | $21,575 | $4,354 | $17,234 | $836 | $10,968 | $9,406 | 3.87% |
| 2021 | $24,429 | $1,434 | $26,996 | $882 | $13,641 | $11,887 | 3.61% |
| 2022 | $29,202 | $1,751 | $29,356 | $1,015 | $14,439 | $12,600 | 3.48% |
| 2023 | $33,830 | $1,976 | $32,573 | $1,148 | $15,057 | $13,134 | 3.39% |
| 2024 | $37,856 | NA | $35,873 | $1,014 | $16,116 | $13,966 | 2.68% |
| 2025 | $42,426 | NA | NA | NA | $17,625 | $15,710 | NA |
| 2026 | $47,434 | $714 | $46,720 | NA | $18,932 | $17,028 | NA |
| Annualized Growth | 14.03% | -26.02% | 18.08% | 4.94% | 9.52% | 10.40% | -8.82% |
(Source: FactSet Research Terminal)
LOW Bond Profile
(Source: FactSet Research Terminal)
(Source: FactSet Research Terminal)
- $5.4 billion in liquidity
- 100% unsecured bonds (maximum financial flexibility)
- Well-staggered bond maturities (no trouble refinancing debt)
- 3.14% average borrowing cost vs. bond market’s 2.2% long-term inflation forecast
- LOW’s effective real interest rate is 0.9% vs. 36% cash return on invested capital
- Returns on investment are 40x its real borrowing cost
- The bond market is so confident in LOW’s business plans, it’s willing to lend to it for nearly 29 years at 3.9% (1.7% real interest rate)
- Lowe’s announces $5B notes offering
- 5-year bonds at 3.35%
- 10-year bonds at 3.75%
- 30-year bonds at 4.25%
- 40-year bonds at 4.75%
LOW plans to maximize safe leverage with very high investment spreads.
LOW Credit Default SWAPs: Bond Market’s Real-Time Fundamental Risk-Assessment
(Source: FactSet Research Terminal)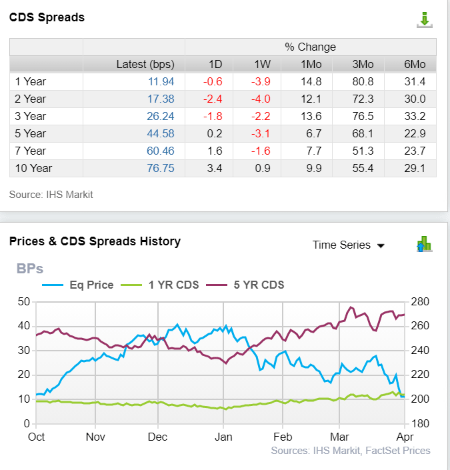
Credit default SWAPs are the insurance bond investors take out in case a company defaults on its debt.
These provide daily updates to a company’s fundamental risk based on real money bets from the smart money on Wall Street.
- LOW’s CDS are consistent with an A- rated company (2.3% 30-year default risk)
- Fundamental risk has been rising modestly over the last six months
- Analysts, management, rating agencies, and the bond market all agree LOW’s investment thesis is still intact
Profitability: Wall Street’s Favorite Quality Proxy
(Source: GuruFocus Premium)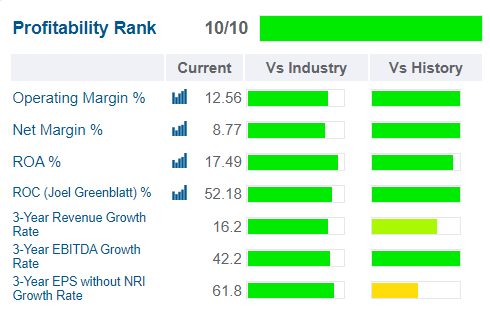
Historically LOW’s profitability is right at the top of its industry peer group.
- Up from 8/10 profitability last quarter
LOW Trailing 12-Month Profitability Vs. Peers
| Metric | Industry Percentile | Major Cyclical Retailers More Profitable Than LOW (Out Of 1,098) |
| Operating Margin | 83.65 | 180 |
| Net Margin | 80.00 | 220 |
| Return On Equity | 93.90 | 67 |
| Return On Assets | NA | NA |
| Return On Capital | 87.43 | 138 |
| Average | 86.25 | 151 |
(Source: GuruFocus Premium)

LOW’s industry-leading profitability has been relatively stable or improving for the last 30 years confirming a wide and stable moat.
Low’s Profit Margin Consensus Forecast
| Year | FCF Margin | EBITDA Margin | EBIT (Operating) Margin | Net Margin | Return On Capital Expansion |
Return On Capital Forecast |
| 2020 | 9.9% | 12.4% | 10.7% | 7.3% | 1.18 | |
| 2021 | 8.7% | 14.3% | 12.4% | 8.6% | TTM ROC | 52.18% |
| 2022 | 9.1% | 14.7% | 12.8% | 8.8% | Latest ROC | 31.49% |
| 2023 | 9.3% | 14.9% | 13.0% | 8.9% | 2027 ROC | 61.76% |
| 2024 | 9.8% | 15.4% | 13.3% | 9.2% | 2027 ROC | 37.27% |
| 2025 | 10.7% | 15.9% | 14.1% | 9.8% | Average | 49.51% |
| 2026 | 11.2% | 16.4% | 14.7% | 10.2% | Industry Median | 11.59% |
| 2027 | NA | NA | NA | NA | LOW/Industry Median | 4.27 |
| Annualized Growth | 2.17% | 4.65% | 5.49% | 5.63% | Vs S&P | 3.39 |
| Annualized Growth (Ignoring Pandemic) | 5.22% | 2.77% | 3.43% | 3.45% |
(Source: FactSet Research Terminal)
If we ignore the pandemic, which benefited LOW immensely, analysts still expect very impressive margin growth in the coming years.
Return on capital is pre-tax profit/operating capital (the money it takes to run the business).
- Joel Greenblatt’s gold standard proxy for quality and moatiness
- Analysts are expecting 50% long-term ROC
- The average investment pays for itself in two years vs. 7 for the S&P 500
- Over 4x the industry’s ROC
- Over 3x the S&P 500’s ROC

LOW’s ROC has been trending higher at a gradual pace for nearly 30 years, confirming its wide and stable moat, and exceptional quality.
Low’s Dividend Growth Consensus Forecast
| Year | Dividend Consensus | FCF/Share Consensus | Payout Ratio | Retained (Post-Dividend) Free Cash Flow | Buyback Potential | Debt Repayment Potential |
| 2021 | $2.87 | $11.86 | 24.2% | $6,023 | 4.50% | 24.7% |
| 2022 | $3.33 | $14.33 | 23.2% | $7,370 | 5.50% | 30.2% |
| 2023 | $3.53 | $16.19 | 21.8% | $8,482 | 6.33% | 29.0% |
| 2024 | $3.73 | $20.07 | 18.6% | $10,948 | 8.18% | 32.4% |
| 2025 | $5.06 | $24.73 | 20.5% | $13,179 | 9.84% | 34.8% |
| 2026 | $6.13 | $28.79 | 21.3% | $15,182 | 11.34% | 35.8% |
| Total 2021 Through 2026 | $24.65 | $115.97 | 21.3% | $61,184.40 | 45.69% | 250.46% |
| Annualized Rate | 16.39% | 19.41% | -2.53% | 20.31% | 20.31% | 7.73% |
(Source: FactSet Research Terminal)
60% FCF payout ratios are the safety guideline for this industry according to rating agencies.
LOW’s payout ratio is expected to fall to 21% despite impressive 16% annual dividend growth.
Its $55 billion in retained FCF (after dividends) from 2022 through 2026 is enough to pay off more than all of its debt or buy back about 40% of its stock management wanted to.
Low’s Buyback Consensus Forecast
| Year | Consensus Buybacks ($ Millions) | % Of Shares (At Current Valuations) | Market Cap |
| 2022 | $11,438.0 | 8.5% | $133,900 |
| 2023 | $10,373.0 | 7.7% | $133,900 |
| 2024 | $8,733.0 | 6.5% | $133,900 |
| 2025 | $10,976.0 | 8.2% | $133,900 |
| 2026 | $11,200.0 | 8.4% | $133,900 |
| Total 2022-2026 | $52,720.00 | 39.4% | $133,900 |
| Annualized Rate | 9.53% | Average Annual Buybacks | $10,544.00 |
(Source: FactSet Research Terminal)
Analysts expect LOW to buy back $53 billion in stock over the next five years, or an average of $10.5 billion per year.
- 7% to 9% per year of its shares is one of the highest buyback rates on Wall Street
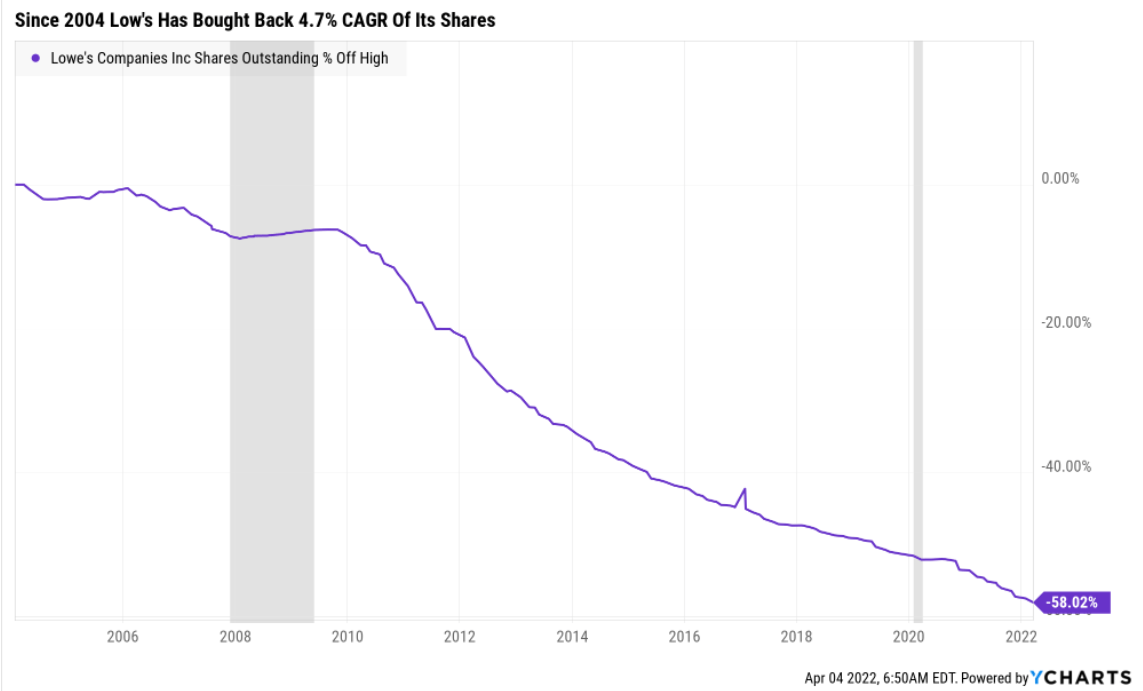
LOW has bought back 58% of its shares since 2004, a rate of nearly 5% per year.
| Time Frame (Years) | Net Buyback Rate | Shares Remaining | Net Shares Repurchased | Each Share You Own Is Worth X Times More (Not Including Future Growth And Dividends) |
| 5 | 4.7% | 78.61% | 21.39% | 1.27 |
| 10 | 4.7% | 61.79% | 38.21% | 1.62 |
| 15 | 4.7% | 48.57% | 51.43% | 2.06 |
| 20 | 4.7% | 38.18% | 61.82% | 2.62 |
| 25 | 4.7% | 30.01% | 69.99% | 3.33 |
| 30 | 4.7% | 23.59% | 76.41% | 4.24 |
(Source: FactSet Research Terminal)
If LOW were to continue at its historical buyback rate, within 30 years it could repurchase 76% of its shares and make each share you own today worth more than 4x more.
- Not including future growth or dividends
And what if LOW’s buyback stock is at 6.5%, the low end of the analyst consensus range for the future?
| Time Frame (Years) | Net Buyback Rate | Shares Remaining | Net Shares Repurchased | Each Share You Own Is Worth X Times More (Not Including Future Growth And Dividends) |
| 5 | 6.5% | 71.46% | 28.54% | 1.40 |
| 10 | 6.5% | 51.06% | 48.94% | 1.96 |
| 15 | 6.5% | 36.49% | 63.51% | 2.74 |
| 20 | 6.5% | 26.08% | 73.92% | 3.84 |
| 25 | 6.5% | 18.63% | 81.37% | 5.37 |
| 30 | 6.5% | 13.32% | 86.68% | 7.51 |
(Source: FactSet Research Terminal)
If LOW buys back 6.5% of its shares each year for three decades, then even with zero growth you’d make 7.5x your money.
Factoring in steady growth in its top and bottom line, you can see why LOW is my favorite company in the world.
Reason Two: Incredible Growth Prospects For Years To Come
We’ve already seen how LOW has a potential 20-year housing mega-trend ahead of it and is executing brilliantly on a plan to significantly expand margins.
- As well as buy back its undervalued shares at a rate that puts even Apple (AAPL) to shame
What do analysts expect this to mean as far as medium-term growth?
Low’s Medium-Term Growth Consensus Forecast
| Year | Sales | Free Cash Flow | EBITDA | EBIT (Operating Income) | Net Income |
| 2020 | $88,136 | $8,713 | $10,968 | $9,406 | $6,460 |
| 2021 | $95,664 | $8,343 | $13,641 | $11,887 | $8,219 |
| 2022 | $98,188 | $8,959 | $14,439 | $12,600 | $8,660 |
| 2023 | $100,882 | $9,341 | $15,057 | $13,134 | $9,003 |
| 2024 | $104,677 | $10,248 | $16,116 | $13,966 | $9,604 |
| 2025 | $111,156 | $11,845 | $17,625 | $15,710 | $10,862 |
| 2026 | $115,788 | $13,022 | $18,932 | $17,028 | $11,786 |
| Annualized Growth | 4.65% | 6.93% | 9.52% | 10.40% | 10.54% |
| Annualized Growth (Ignoring Pandemic | 3.89% | 9.31% | 6.78% | 7.45% | 7.48% |
(Source: FactSet Research Terminal)
Modest sales growth combined with impressive margin expansion is expected to drive high single-digit bottom-line growth.
- Buybacks are then expected to drive this to hyper-growth levels
| Metric | 2021 Growth Consensus | 2022 Growth Consensus | 2023 Growth Consensus | 2024 Growth Consensus (Potential Recession Year) | 2025 Growth Consensus |
2026 Growth Consensus |
| Sales | 29% | 15% | 6% | 3% | 4% | 4% |
| Dividend | 9% | 33% | 16% (60-year streak) | 6% | 36% | 21% |
| EPS | 55% | 35% | 13% | 11% | 12% | 17% |
| Operating Cash Flow | 167% | -2% | 15% | -2% | 19% | NA |
| Free Cash Flow | 242% | -4% | 17% | 2% | 9% | 16% |
| EBITDA | 59% | 21% | 2% | 5% | 6% | NA |
| EBIT (operating income) | 72% | 21% | 7% | 5% | 4% | NA |
(Source: FAST Graphs, FactSet Research)
By 2026, LOW’s rapidly growing dividend is expected to hit a 62-year dividend growth streak.
What about the long-term?
LOW’s Long-Term Growth Outlook
(Source: FactSet Research Terminal)
- 14.5% to 22.3% CAGR growth consensus range (from five sources)
- Individual analyst LT growth range: 7% to 34% CAGR
- Median growth consensus from all 32 analysts: 20.5% CAGR


- Smoothing for outliers 5% margins of error to the upside and downside
- 13% to 24% CAGR margin-of-error adjusted growth consensus range
- 70% statistical probability that LOW grows at 13% to 24% CAGR over the long term
Over the last 20 years, LOW has grown at 13% to 45% CAGR and analysts expect long-term growth to be similar to the last 12 years.
So we have world-class safety and quality, incredible opportunities, and a 59-year dividend growth streak proving LOW is one of the world’s most dependable income growth blue-chips.
And, thanks to its bear market, LOW is crazy, stupid, cheap.
Reason Three: A Wonderful Company At A Wonderful Price
For 20 years, outside of bear markets and bubbles, billions of dividend growth investors have determined that LOW is worth 19 to 21x earnings.
- 91% statistical probability that LOW is worth about 20x earnings
| Metric | Historical Fair Value Multiples (15-year) | 2021 | 2022 | 2023 | 2024 | 2025 |
12-Month Forward Fair Value |
| Earnings | 20.00 | $234.00 | $267.00 | $296.40 | $337.60 | $432.60 | |
| Average | $234.00 | $267.00 | $296.40 | $337.60 | $432.60 | $274.35 | |
| Current Price | $202.64 | ||||||
|
Discount To Fair Value |
13.40% | 24.10% | 31.63% | 39.98% | 53.16% | 26.14% | |
|
Upside To Fair Value (NOT Including Dividends) |
15.48% | 31.76% | 46.27% | 66.60% | 113.48% | 35.39% (37% including dividend) | |
| 2022 EPS | 2023 EPS | 2022 Weighted EPS | 2023 Weighted EPS | 12-Month Forward EPS | 12-Month Average Fair Value Forward PE |
Current Forward PE |
|
| $13.35 | $14.82 | $10.01 | $3.71 | $13.72 | 20.0 | 14.8 |
(Source: DK Research Terminal, FactSet)
LOW is trading at 14.8x forward earnings and 11.8x cash-adjusted earnings.
- For context, pre-pandemic private equity deals were averaging 12.3x cash-adjusted earnings
LOW is literally trading at private equity valuations, for one of the world’s highest quality and fastest-growing companies.
- No long-term investor in history
- Who avoided becoming a forced seller for emotional or financial reasons
- Has ever regretted buying LOW at 14.8x earnings
- And the best available data today says there is an 80% statistical chance that today won’t be the first time
|
Analyst Median 12-Month Price Target |
Morningstar Fair Value Estimate |
| $276.59 (18 PE) | $203.00 (14.8 PE) |
|
Discount To Price Target (Not A Fair Value Estimate) |
Discount To Fair Value |
| 26.74% | 0.18% |
|
Upside To Price Target (Not Including Dividend) |
Upside To Fair Value (Not Including Dividend) |
| 36.49% | 0.18% |
|
12-Month Median Total Return Price (Including Dividend) |
Fair Value + 12-Month Dividend |
| $279.79 | $206.20 |
|
Discount To Total Price Target (Not A Fair Value Estimate) |
Discount To Fair Value + 12-Month Dividend |
| 27.57% | 1.73% |
|
Upside To Price Target ( Including Dividend) |
Upside To Fair Value + Dividend |
| 38.07% | 1.76% |
(Source: DK Research Terminal, FactSet, Morningstar)
Morningstar’s discounted cash flow model estimates LOW is worth less than 15 P/E.
Morningstar’s Fair Value Estimate Says LOW Is Only Ever Fairly Valued During Recessionary Bear Markets… And Now
(Source: FAST Graphs, FactSet)
The market has proven Morningstar’s fair value model wrong.
- 91% probability LOW is worth 19 to 21x earnings
Analysts expect LOW to roar 38% in the next year.
And that forecast is 100% justified by fundamental and incredible valuation.
Essentially LOW is already priced as if a recession has already happened.
Creating a very attractive margin of safety.
| Rating | Margin Of Safety For Low-Risk 100% quality 13/13 Ultra SWAN Companies | 2022 Price | 2023 Price |
12-Month Forward Fair Value |
| Potentially Reasonable Buy | 0% | $267.00 | $296.40 | $274.35 |
| Potentially Good Buy | 0% | $267.00 | $296.40 | $274.35 |
| Potentially Strong Buy | 10% | $240.30 | $266.76 | $246.92 |
| Potentially Very Strong Buy | 20% | $213.60 | $237.12 | $219.48 |
| Potentially Ultra-Value Buy | 30% | $186.90 | $207.48 | $192.05 |
| Currently | $202.64 | 24.10% | 31.63% | 26.14% |
| Upside To Fair Value (Not Including Dividends) | 31.76% | 46.27% | 35.39% |
(Source: DK Research Terminal)
For anyone comfortable with its risk profile, LOW is a potentially very reasonable and prudent investment today.
LOW Investment Decision Score
DK
(Source: DK Automated Investment Decision Tool)
For anyone comfortable with its risk profile, LOW is a potentially good hyper-growth dividend king investment.
- 26% discount vs. 15% market premium = 41% better valuation
- Far superior fundamental quality and safety
- 120% higher long-term return potential than S&P 500 over time
- Almost 4x the risk-adjusted expected return for the next five years
The biggest potential reason not to buy Lowe’s right now is the low 1.6% yield.
- LOW + MMP = 5.0% very safe yield and 17.0% CAGR long-term return potential
- LOW + BTI = 4.3% very safe yield and 18.5% CAGR long-term return potential
Risk Profile: Why Lowe’s Isn’t Right For Everyone
There are no risk-free companies and no company is right for everyone. You have to be comfortable with the fundamental risk profile.
What Could Cause LOW’s Investment Thesis To Break
- Safety falls to 40% or less
- Balance sheet collapses
- Business model completely disrupted
- Management’s margin boosting efforts fail
- Growth outlook falls to less than 8.4% for eight years
- LOW’s role in my portfolio is to deliver long-term 10+% returns with minimal fundamental risk
- Like all non-defensive sectors (anything that’s not REITs, utilities, midstream, healthcare, telecom, consumer staples), I target 10+% long-term return potential for all recommendations
How long it takes for a company’s investment thesis to break depends on the quality of the company.
| Quality |
Years For The Thesis To Break Entirely |
| Below-Average | 1 |
| Average | 2 |
| Above-Average | 3 |
| Blue-Chip | 4 |
| SWAN | 5 |
| Super SWAN | 6 |
| Ultra SWAN | 7 |
| 100% Quality Companies (LOW and MA) | 8 |
These are my personal rule of thumb for when to sell a stock if the investment thesis has broken.
LOW is highly unlikely to suffer such catastrophic declines in fundamentals.
LOW’s Risk Profile Summary
Lowe’s operates in a cyclical retail environment in which sales are driven in large part by consumers’ spending on their homes. With existing-home prices still rising and interest rates low, we don’t see imminent concern about a significant slowdown in the housing market; however, with interest rates that could move higher, uncertainty around the direction of the economic environment, and the lack of lower-priced inventory, turnover could slow. Existing home sales growth had stabilized at the beginning of 2020 until COVID-19 struck, sending existing-home sales tumbling at a double-digit pace between April and June 2020, before achieving a sustained recovery. However, any future stagnation in housing turnover, spike in unemployment, predatory pricing tactics, or slowdown in consumer confidence could reduce revenue and profitability.
In the near term, little impairment risk remains as Lowe’s continues to adjust the strategy of its Rona banners within the enterprise (with the firm taking a nearly $1 billion write-down in its fourth quarter of 2018 and more than another $175 million in charges during the fourth quarter of 2019), as it continues to operate both corporate and dealer-owned locations in Canada. But expansion in the maintenance, repair, and operations space via wholly owned Central Wholesalers and Maintenance Supply Headquarters remains uncertain as the firm focuses primarily on the core business.
Additionally, in our opinion, Lowe’s has only minimal environmental, social, and governance, or ESG, risk. While there is some risk associated with product sourcing and potential data theft, the biggest issue we foresee on the horizon is in consumer’s shifting preferences to sustainable product offerings. We expect Lowe’s to adapt, and as such, do not see any material financial impact from such exposure.” – Morningstar
LOW’s Risk Profile Includes
- Cyclical business tied to the health of the economy and the US housing market
- Supply chain disruption risk
- Margin expansion plan execution risk
- M&A execution risk (in the future)
- Labor retention risk (tightest job market in over 50 years and finance is a high paying industry)
- The rising leverage ratio will create less financial flexibility in the future
- Buyback valuation risk: much of LOW’s growth is expected to come from buybacks and management might overpay for shares
- Cybersecurity risk: hackers and ransomware
Recession Watch
LOW’s business model is highly sensitive to economic cycles.
| Bonds | Yield |
| 3-Month Treasury Yield | 0.72% |
| 2-Year Treasury Yield | 2.52% |
| 10-Year Treasury Yield | 2.68% |
| 10-3M Curve (Most Accurate Recession Forecasting Tool) | 1.97% |
| 10-2 Curve (Most Popular Yield Curve Followed By Wall Street) | 0.17% |
| Potential Historically Average Recession Start If Curve Inverts Now (Curve Inverted March 31st) | October 31st, 2023 |
| Potential Historically Average Bear Market Start If Curve Inverts Now (Curve Inverted March 31st) | September 8th, 2023 |
| Potential Historically Average Bear Market Bottom (Curve Inverted March 31st) | September 8th, 2024 |
| Potential Historically Average New Record High (Curve Inverted March 31st) | December 8th, 2025 |
(Source: DK S&P 500 Valuation & Total Return Tool) NOT For Market Timing Purposes
The 10-2 curve is the most closely watched by Wall Street but a study from the NY Fed finds that the 10-3 curve is the most accurate at forecasting recessions.
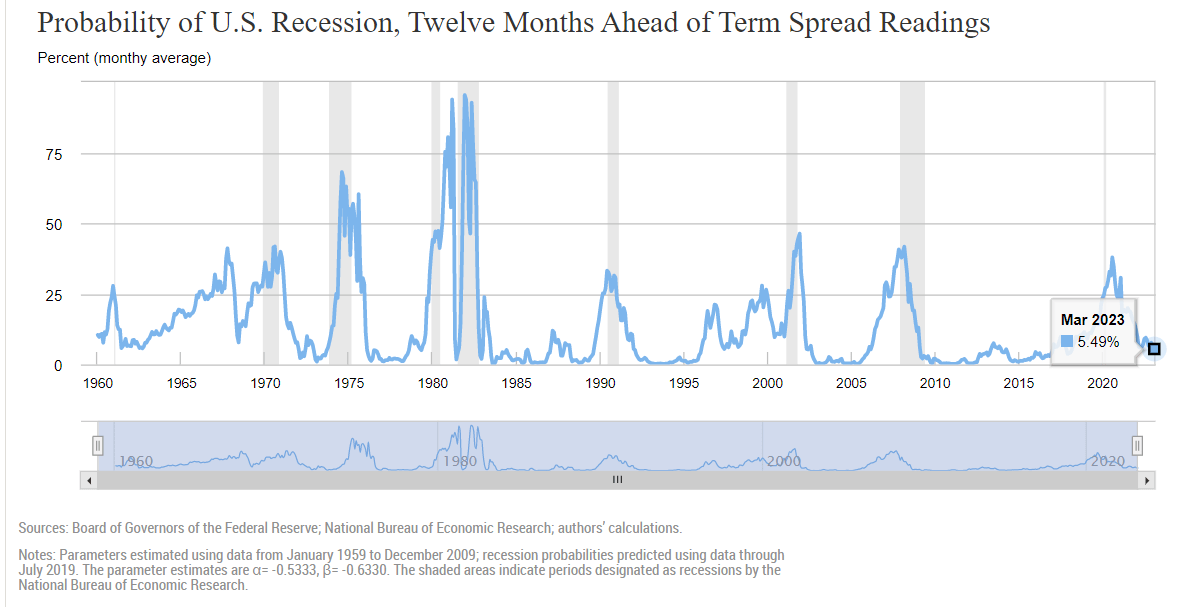
The NY Fed estimates a 5.5% risk of a recession beginning within a year.
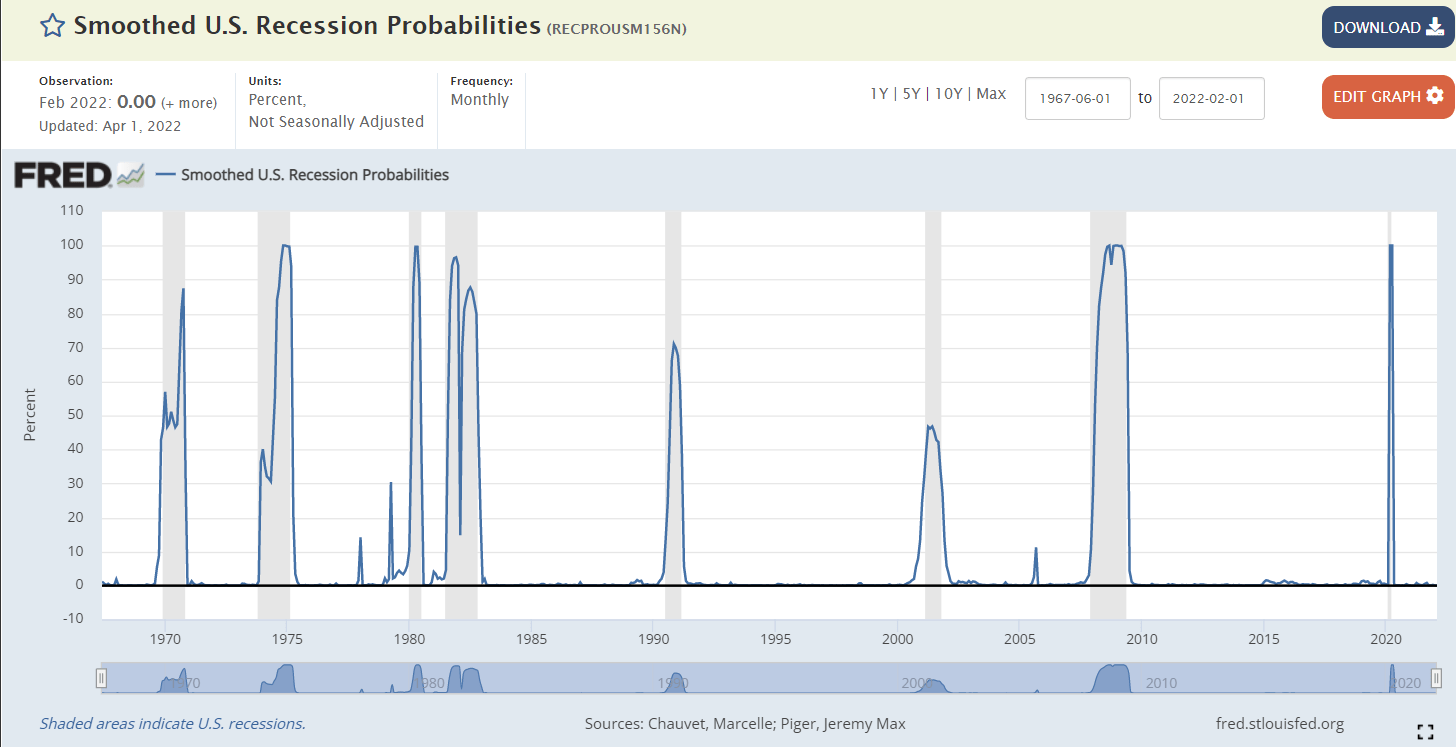
The St. Louis Fed’s model, based on four economic metrics, estimates a 0.0% chance we’re in a recession right now.
Currently, the bond market is mildly concerned about recession risk and we are monitoring the situation closely each day and week.

David Rice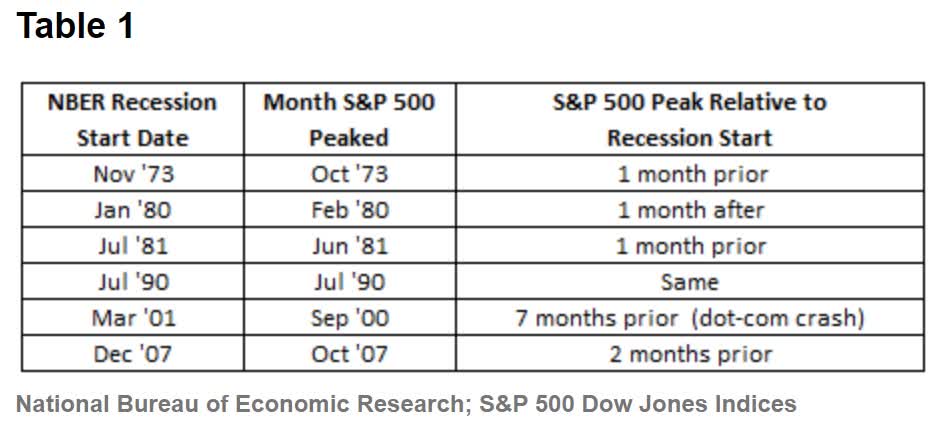
The good news is that stocks historically don’t begin bear markets until approximately 50 days before recessions begin.
Jeff Miller, Bloomberg 
- A recession scare could occur in 2022
- Yield curve + BaR economic grid makes it very likely that we’ll see a recession coming at least 10 months out
- So DK members can be prepared emotionally and financially for the next recession and bear market
How do we quantify, monitor, and track such a complex risk profile? By doing what big institutions do.
Material Financial ESG Risk Analysis: How Large Institutions Measure Total Risk
- 4 Things You Need To Know To Profit From ESG Investing
- What Investors Need To Know About Company Long-Term Risk Management (Video)
Here is a special report that outlines the most important aspects of understanding long-term ESG financial risks for your investments.
- ESG is NOT “political or personal ethics based investing”
- It’s total long-term risk management analysis
ESG is just normal risk by another name.” Simon MacMahon, head of ESG and corporate governance research, Sustainalytics” – Morningstar
ESG factors are taken into consideration, alongside all other credit factors, when we consider they are relevant to and have or may have a material influence on creditworthiness.” – S&P
ESG is a measure of risk, not of ethics, political correctness, or personal opinion.
S&P, Fitch, Moody’s, DBRS (Canadian rating agency), AM Best (insurance rating agency), R&I Credit Rating (Japanese rating agency), and the Japan Credit Rating Agency have been using ESG models in their credit ratings for decades.
- Credit and risk management ratings make up 41% of the DK safety and quality model
- Dividend/balance sheet/risk ratings make up 82% of the DK safety and quality model
Dividend Aristocrats: 67th Industry Percentile On Risk Management (Above-Average, 24/100 Medium Risk)
LOW Long-Term Risk Management Consensus
| Rating Agency | Industry Percentile |
Rating Agency Classification |
| MSCI 37 Metric Model | 96.0% |
AA, Industry Leader, Positive Trend |
| Morningstar/Sustainalytics 20 Metric Model | 96.5% |
11.5/100 Low-Risk |
| Reuters’/Refinitiv 500+ Metric Model | 98.5% | Excellent |
| S&P 1,000+ Metric Model | 48.0% |
Average, Stable Trend |
| Just Capital 19 Metric Model | 96.2% | Exceptional |
| FactSet | 60.0% |
Below-Average, Negative Trend |
| Morningstar Global Percentile (All 15,000 Rated Companies) | 97.3% | Exceptional |
| Just Capital Global Percentile (All 954 Rated US Companies) | 92.7% | Exceptional |
| Consensus | 87% |
Low-Risk, Very Good Risk-Management, Stable Trend, |
(Sources: Morningstar, Reuters’, Just Capital, S&P, FactSet Research)
LOW’s Long-Term Risk Management Is The 23rd Best In The Master List (96th Percentile)
| Classification | Average Consensus LT Risk-Management Industry Percentile |
Risk-Management Rating |
| S&P Global (SPGI) #1 Risk Management In The Master List | 94 | Exceptional |
| Lowe’s | 87 | Very Good – Bordering On Exceptional |
| Strong ESG Stocks | 78 |
Good – Bordering On Very Good |
| Foreign Dividend Stocks | 75 | Good |
| Ultra SWANs | 71 | Good |
| Low Volatility Stocks | 68 | Above-Average |
| Dividend Aristocrats | 67 | Above-Average |
| Dividend Kings | 63 | Above-Average |
| Master List average | 62 | Above-Average |
| Hyper-Growth stocks | 61 | Above-Average |
| Monthly Dividend Stocks | 60 | Above-Average |
| Dividend Champions | 57 | Average |
(Source: DK Research Terminal)
LOW’s risk-management consensus is in the top 4% of the world’s highest quality companies and similar to that of such other companies as
- 3M (MMM) – dividend king
- Enbridge (ENB) – global aristocrat
- Allianz SE (OTCPK:ALIZY)
- Bank of Nova Scotia (BNS)
- Texas Instruments (TXN)
- Microsoft (MSFT)
The bottom line is that all companies have risks, and LOW is very good, bordering on exceptional at managing theirs.
How We Monitor LOW’s Risk Profile
- 32 analysts
- 3 credit rating agencies
- 8 total risk rating agencies
- 40 experts who collectively know this business better than anyone other than management
- And the bond market for real-time fundamental risk-assessments
When the facts change, I change my mind. What do you do sir?” – John Maynard Keynes
There are no sacred cows at iREIT or Dividend Kings. Wherever the fundamentals lead, we always follow. That’s the essence of disciplined financial science, the math behind retiring rich and staying rich in retirement.
Bottom Line: Lowe’s Is A Buffett-Style Dividend Aristocrat Bargain That Could Potentially Triple In The Next 5 Years
Inflation is expected to hit 8.4% in the April 12th CPI report.
The Fed is expected to hike rates to 3% by March 2023 (Goldman thinks 3.25%).
Economic growth is expected to slow to 2% by 2023 and Deutsche Bank’s base case is we’ll get a mild recession next year.
The war in Ukraine rages on and JPMorgan thinks this could push up commodity prices another 30% to 40%.
JPMorgan thinks peak inflation might be in June, at about 10%.
There are a lot of risks facing the market right now.
Nobody can predict interest rates, the future direction of the economy or the stock market. Dismiss all such forecasts and concentrate on what’s actually happening to the companies in which you’ve invested.” — Peter Lynch
But fortunately, smart long-term investors need to be concerned with market timing or Wall Street’s crazy daily swings.
Fortunes are made by buying right and holding on.” – Tom Phelps, 100 to 1 In The Stock Market
Today LOW represents one of the lowest-risk and easiest ways to take charge of your financial destiny and retire rich and stay rich in retirement.
- 26% undervalued Ultra SWAN quality dividend king
- Growing at 20.5% CAGR
- Trading at 11.8x cash-adjusted earnings
- With 22% CAGR consensus return potential over the next 5 years
- 6.5x more than the S&P 500
- 15.5% CAGR risk-adjusted expected return
- 4x more than the S&P 500
If you want maximum safety and quality, consider buying LOW today.
If you want dividend aristocrat income dependability, LOW has a 59-year dividend growth streak to meet your needs.
If you want maximum growth and total returns, LOW is what you’re potentially looking for.
Luck is what happens when preparation meets opportunity.” – Roman Philosopher Seneca the younger
If you’re looking to take charge of your financial destiny, and make your own luck on Wall Street, then Buffett-style “fat pitch” LOW is one of the best blue-chips you can buy today.
That’s why I just bought LOW for the 3rd time in the last two weeks, and why it’s 25% of my future correction buying plan.
Be the first to comment