


imagedepotpro/E+ via Getty Images
For understandable reasons, most investors fear recessions and the bear markets that almost always go with them.
However, remember what Warren Buffett, the greatest investor of all time, famously said: “Be fearful when others are greedy, and greedy when others are fearful.”
Recently, according to Bank of America and AAII, investor sentiment hit levels not seen outside of the Pandemic and Great Recession. And why shouldn’t investors be terrified?
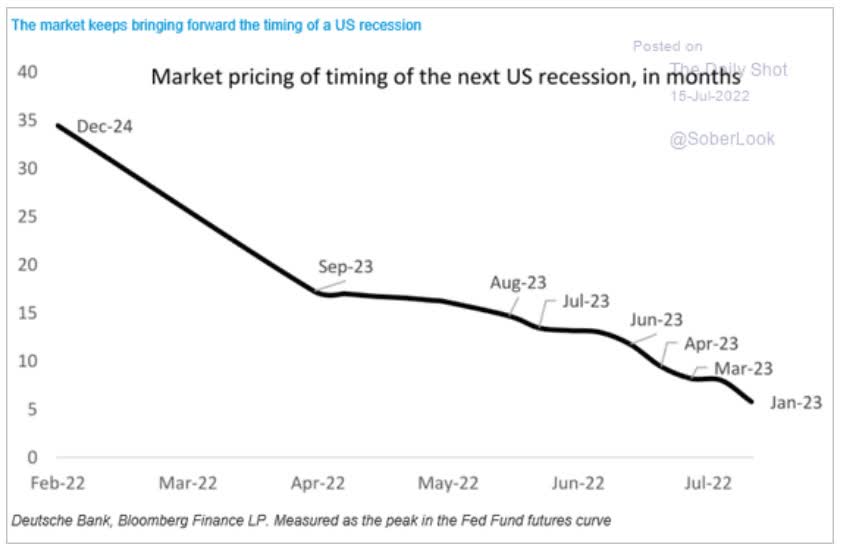
Daily Shot
The bond market is now pricing in a recession beginning in January 2023.
Bank of America thinks it’s coming in Q4 2024, and the economic data says it might be arriving in about five months, agreeing with both.
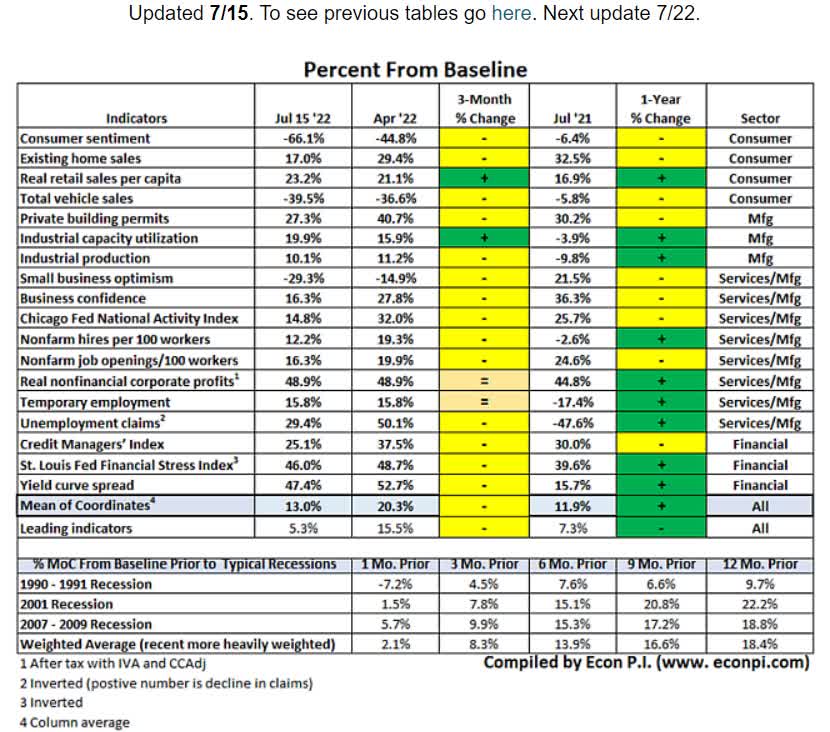
David Rice
With recessions comes rising unemployment, falling earnings, and crashing stock prices.
But guess what? Not every recession is the Great Recession or the pandemic crash. Yes, some blue-chip economists think a recession is coming, but not all of them.
- Morgan Stanley estimates a 36% probability
- Goldman Sachs 34%
- Moody’s 40%
Those who think one is likely think it will be both short and mild.
How mild? Bank of America’s latest 2023 US GDP economic growth forecast:
- -0.2%
- vs. -0.5% Deutsche Bank
- vs. 2001’s -0.4% (the mildest recession in US history thus far )
Moody’s expects US job growth to fall steadily to 175K within 12 months.
- potentially the first recession ever to see falling unemployment
- Moody’s also expects US home prices to remain flat for three to four years
- no big housing crash
What does this mean for your portfolio? Especially after we just had the worst start to the year since 1872, according to Bank of America?
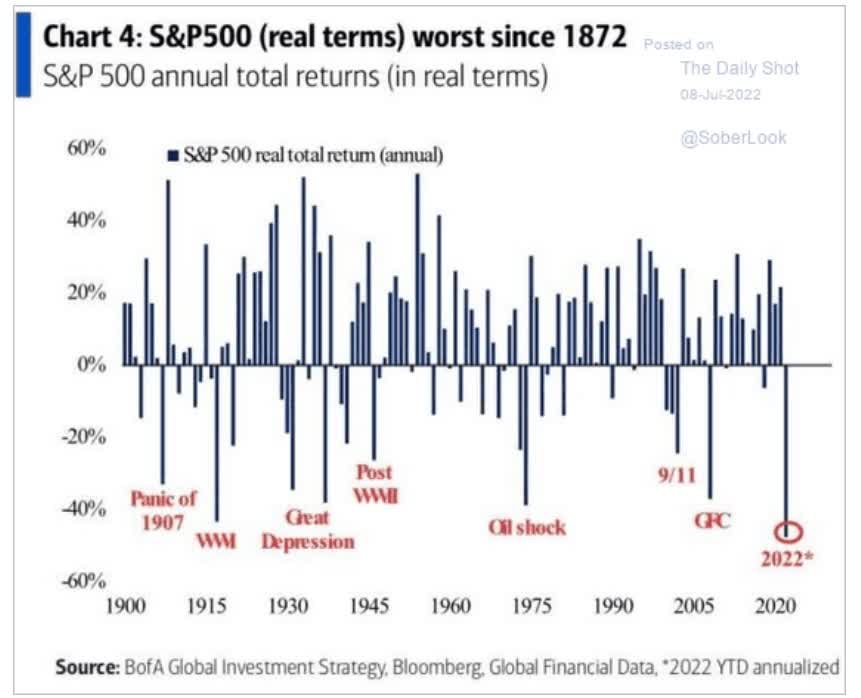
Daily Shot
That blue-chip bargains are now available that could change your life and set your portfolio on fire in a very good way.
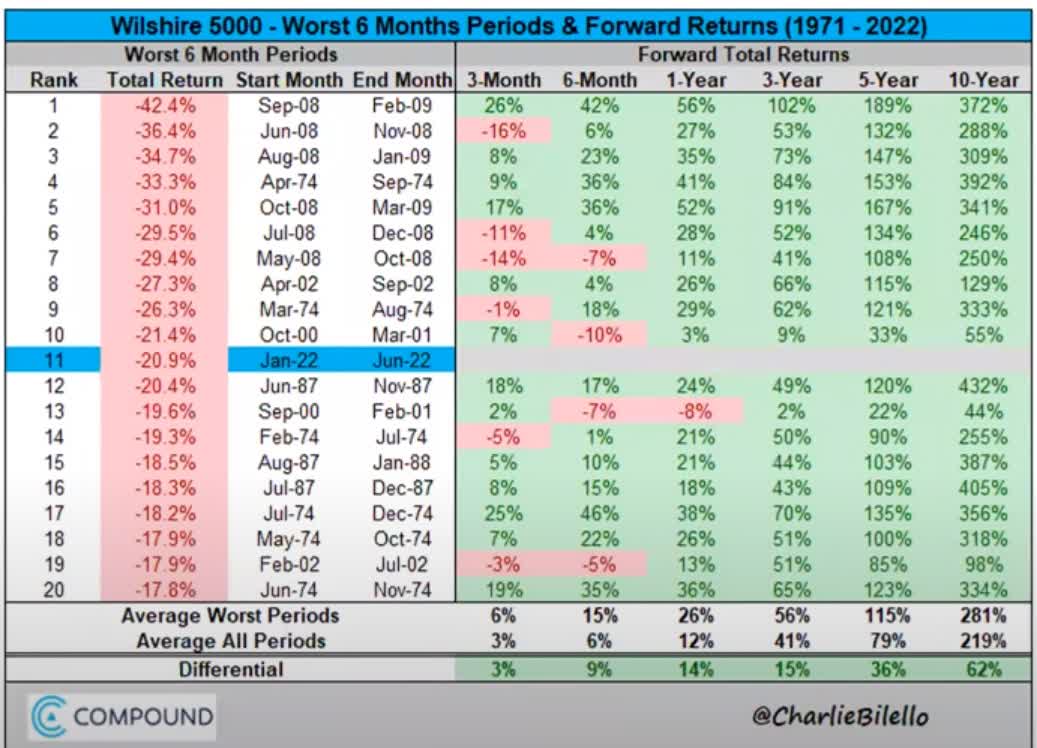
Charlie Bilello
- buying stocks after a terrible 6 months historically results in 4% to 6% higher annual returns for the next decade
- an average 281% 10-year total return = 14.3% CAGR = returns on par with the greatest investors in history
- almost quadruple your money over the next decade
- if you can stay calm and look beyond the short-term fear, uncertainty, and doubt or FUD
I can’t tell you when this bear market will end or how far stocks will fall – only time and the economy can determine that.
But here’s what I can tell you, to paraphrase Casablanca:
If the market leaves the ground and you haven’t bought some blue-chip bargains, you’ll regret it. Maybe not today, maybe not tomorrow, but soon and for the rest of your life.”
Today I want to highlight Lowe’s (NYSE:LOW), one of my favorite Buffett-style “fat pitch” dividend king recommendations.
Wait for a fat pitch and then swing for the fences.” – Warren Buffett
Let me show you the four reasons why Lowe’s is not only one of the world’s greatest dividend growth stocks you can buy today but a potentially life-changing investment opportunity.
One that could more than triple in the next five years, on the road to delivering potentially 8X returns over the next decade.
In other words, let me show you why I just bought some more Lowe’s for my retirement portfolio and why it might be just what you need to retire in safety and splendor.
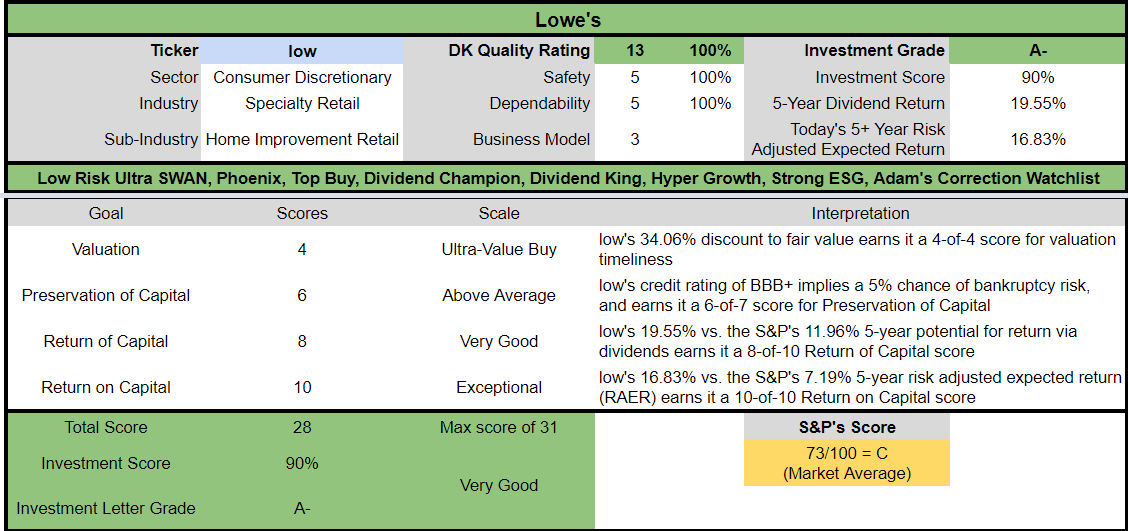
Reason One: Lowe’s Is The Complete Buffett-Style “Fat Pitch” Package
Here’s the bottom line up front on Lowe’s.
Reasons To Potentially Buy LOW Today
- 100% quality low-risk 13/13 Ultra SWAN dividend king
- 3rd highest quality company on the Master List (99th percentile)
- 100% dividend safety score
- 60-year dividend growth streak (just one unsafe FCF payout ratio in the last 20 years)
- 2.3% very safe yield
- 0.5% average recession dividend cut risk
- 1.0% severe recession dividend cut risk
- 34% historically undervalued (potential Ultra Value Buffett-style “fat pitch”)
- Fair Value: $280.14 (20.0X earnings)
- 13.2X forward earnings vs. 19X to 21X historical
- 10.7X cash-adjusted earnings
- BBB+ stable outlook credit rating = 5% 30-year bankruptcy risk
- 82nd industry percentile risk management consensus = very good
- 10% to 26% CAGR margin-of-error growth consensus range
- 22.8% CAGR median growth consensus
- 5-year consensus total return potential: 20% to 26% CAGR
- base-case 5-year consensus return potential: 24% CAGR (4X more than the S&P consensus)
- consensus 12-month total return forecast: 30%
- Fundamentally Justified 12-Month Returns: 54% CAGR
Lowe’s Is Already Pricing In A Severe Recession
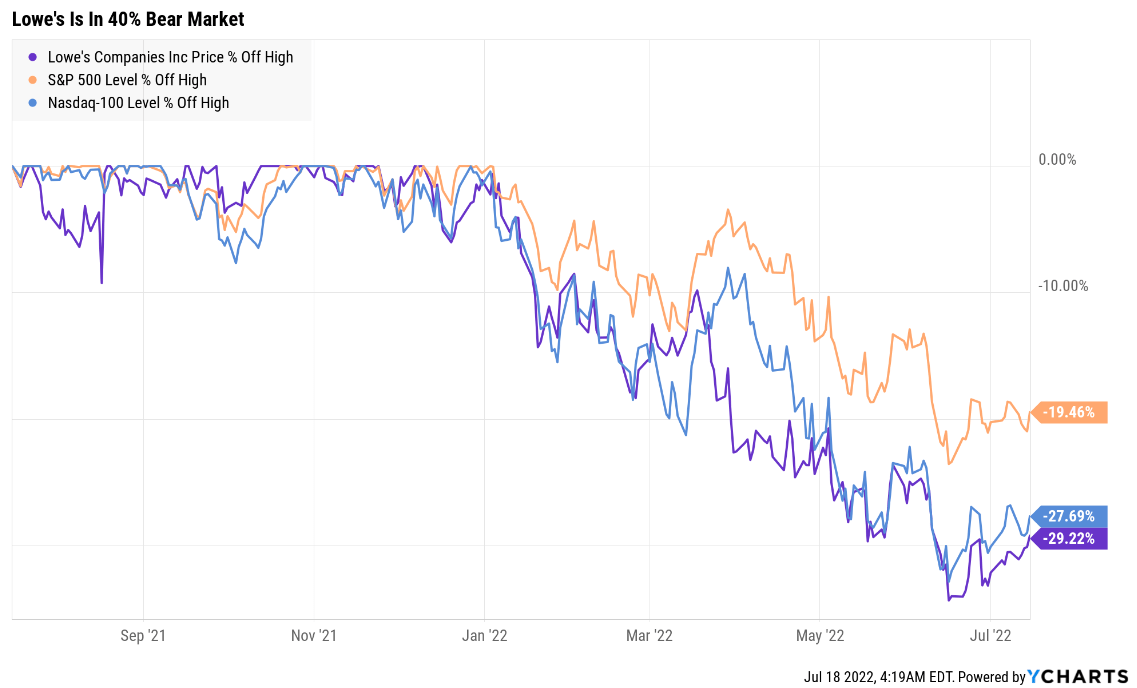
YCharts
LOW is in a 40% bear market and appears to be forming a bottom.
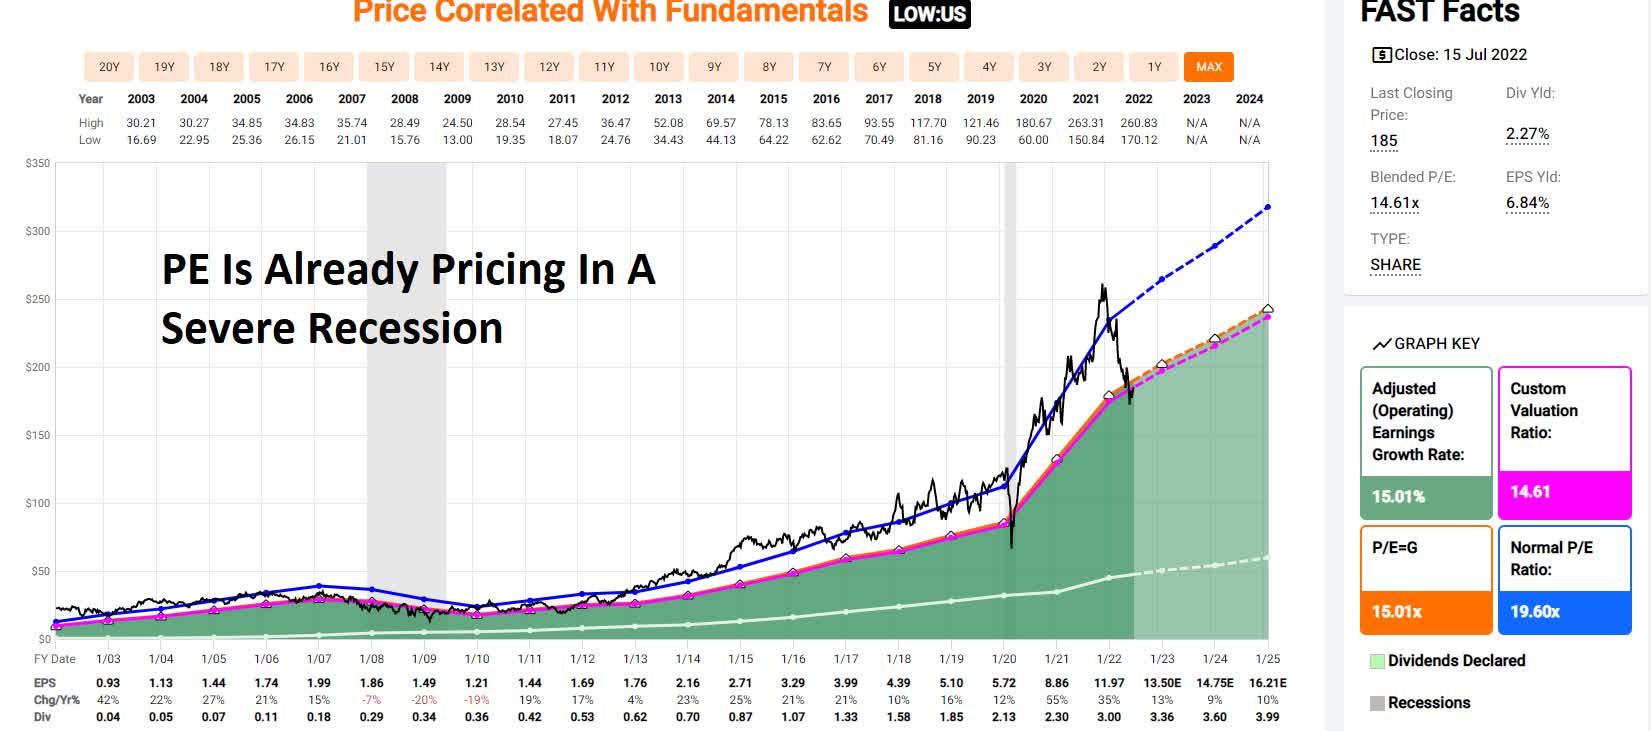
FAST Graphs, FactSet Research
LOW’s P/E is trading at levels only seen in severe recession lows.
LOW Medium-Term Growth Outlook Is Intact
| Metric | 2021 Growth | 2022 Growth Consensus | 2023 Growth Consensus | 2024 Growth Consensus | 2025 Growth Consensus | 2026 Growth Consensus |
2027 Growth Consensus |
| Sales | 29% | 15% | 8% | 1% | 3% | 4% | 5% |
| Dividend | 9% | 33% | 31% (Official) | 7% | 6% | 19% | 35% |
| EPS | 55% | 35% | 13% | 9% | 10% | 20% | 18% |
| Operating Cash Flow | 167% | -2% | 17% | 2% | 13% | NA | NA |
| Free Cash Flow | 242% | -4% | 18% | 1% | 10% | 14% | 14% |
| EBITDA | 59% | 21% | 3% | 4% | 5% | NA | NA |
| EBIT (operating income) | 72% | 21% | 9% | 3% | 4% | NA | NA |
(Source: FAST Graphs, FactSet)
So far, analysts expect a slowdown in growth to 9% to 10% but no negative growth, followed by stronger growth in 2026 and 2027.
Rolling Returns Since July 1985
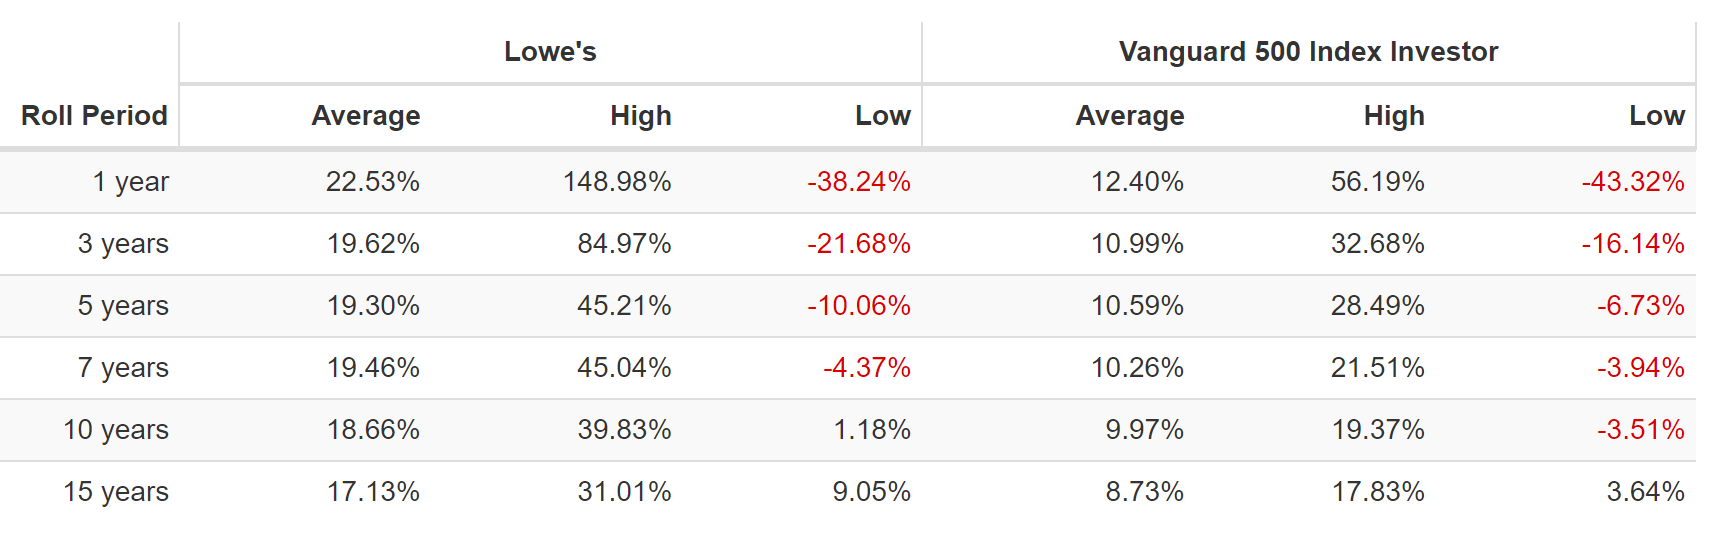
(Source: Portfolio Visualizer Premium)
LOW has consistently delivered 17% to 20% annual returns for 37 years but from bear market lows as strong as 31% for 15 years and 40% for 10 years.
- 58X return in 15 years
- 29X return in 10 years
LOW 2024 Consensus Total Return Potential
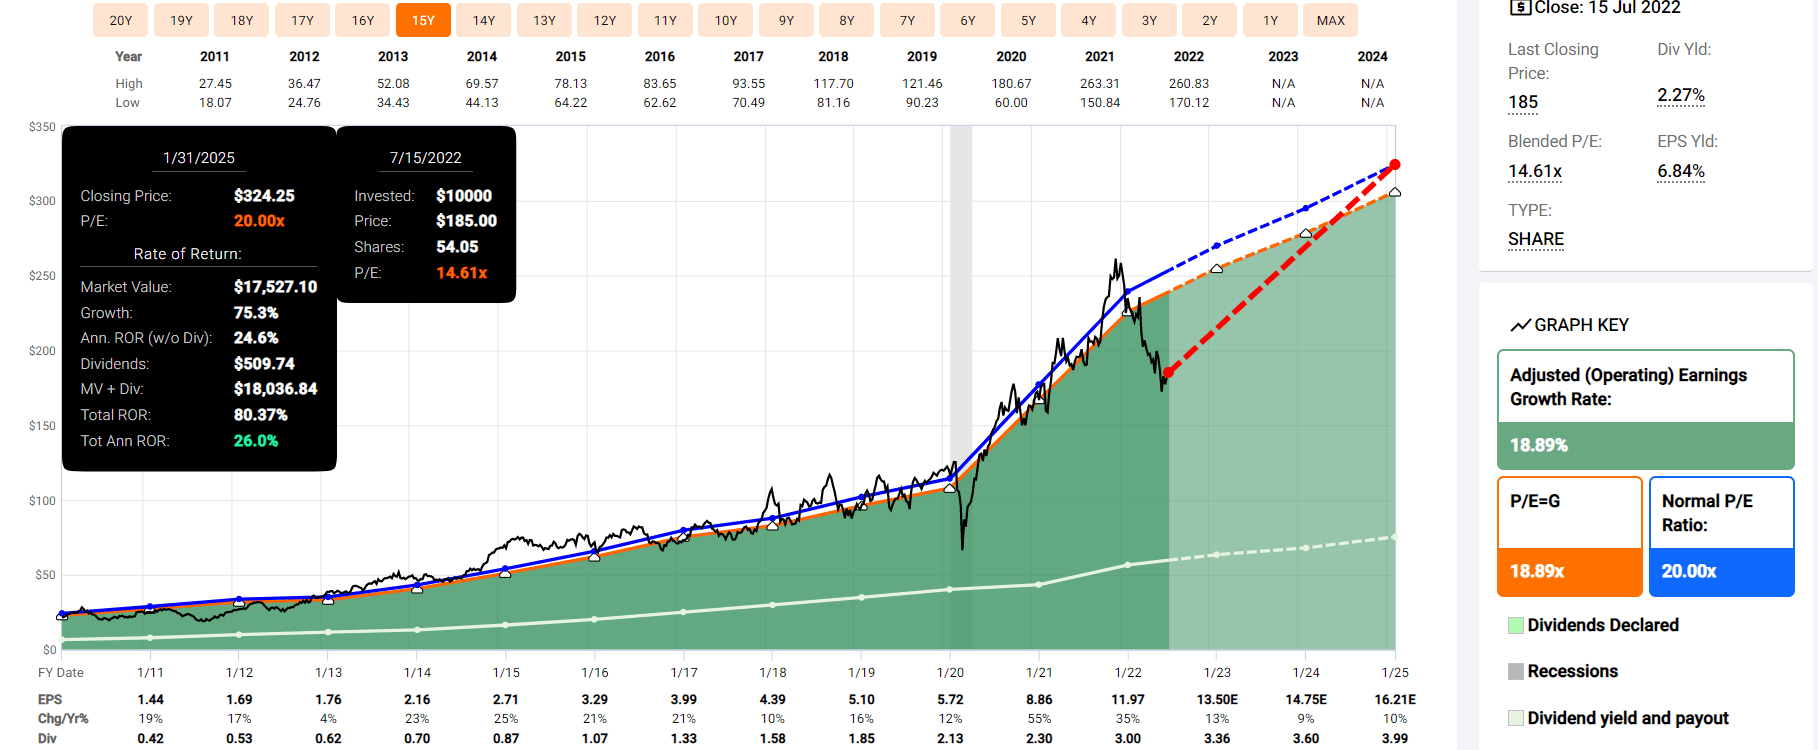
FAST Graphs, FactSet Research
FAST Graphs, FactSet Research
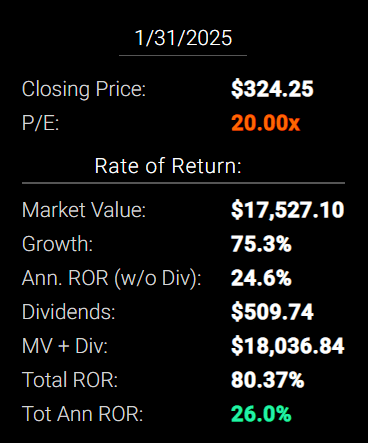
If LOW grows as analysts expect by early 2025 and returns to the mid-range of historical fair value, it could deliver 80% total returns or 26% annually.
- Buffett-like returns from an Ultra SWAN dividend king bargain hiding in plain sight.
Now compare that to the S&P 500 consensus.
S&P 2024 Consensus Total Return Potential
FAST Graphs, FactSet Research
FAST Graphs, FactSet Research
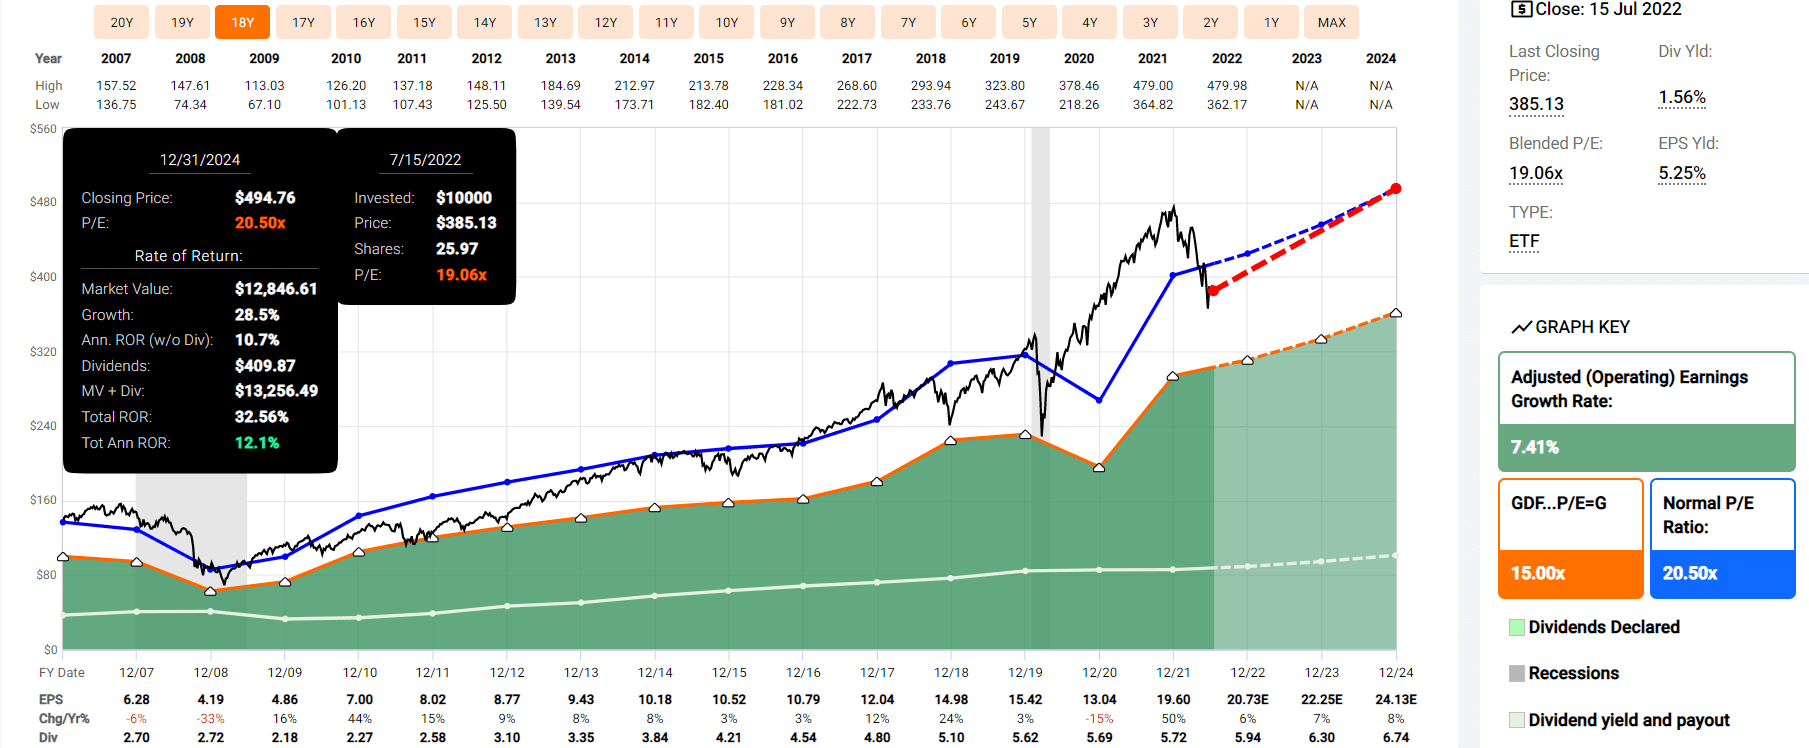
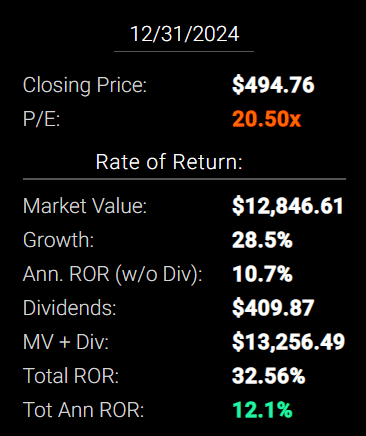
Analysts expect about 33% total returns or 12% annual returns from the S&P 500 over the next 2.5 years.
LOW 2027 Consensus Total Return Potential
FAST Graphs, FactSet Research
FAST Graphs, FactSet Research
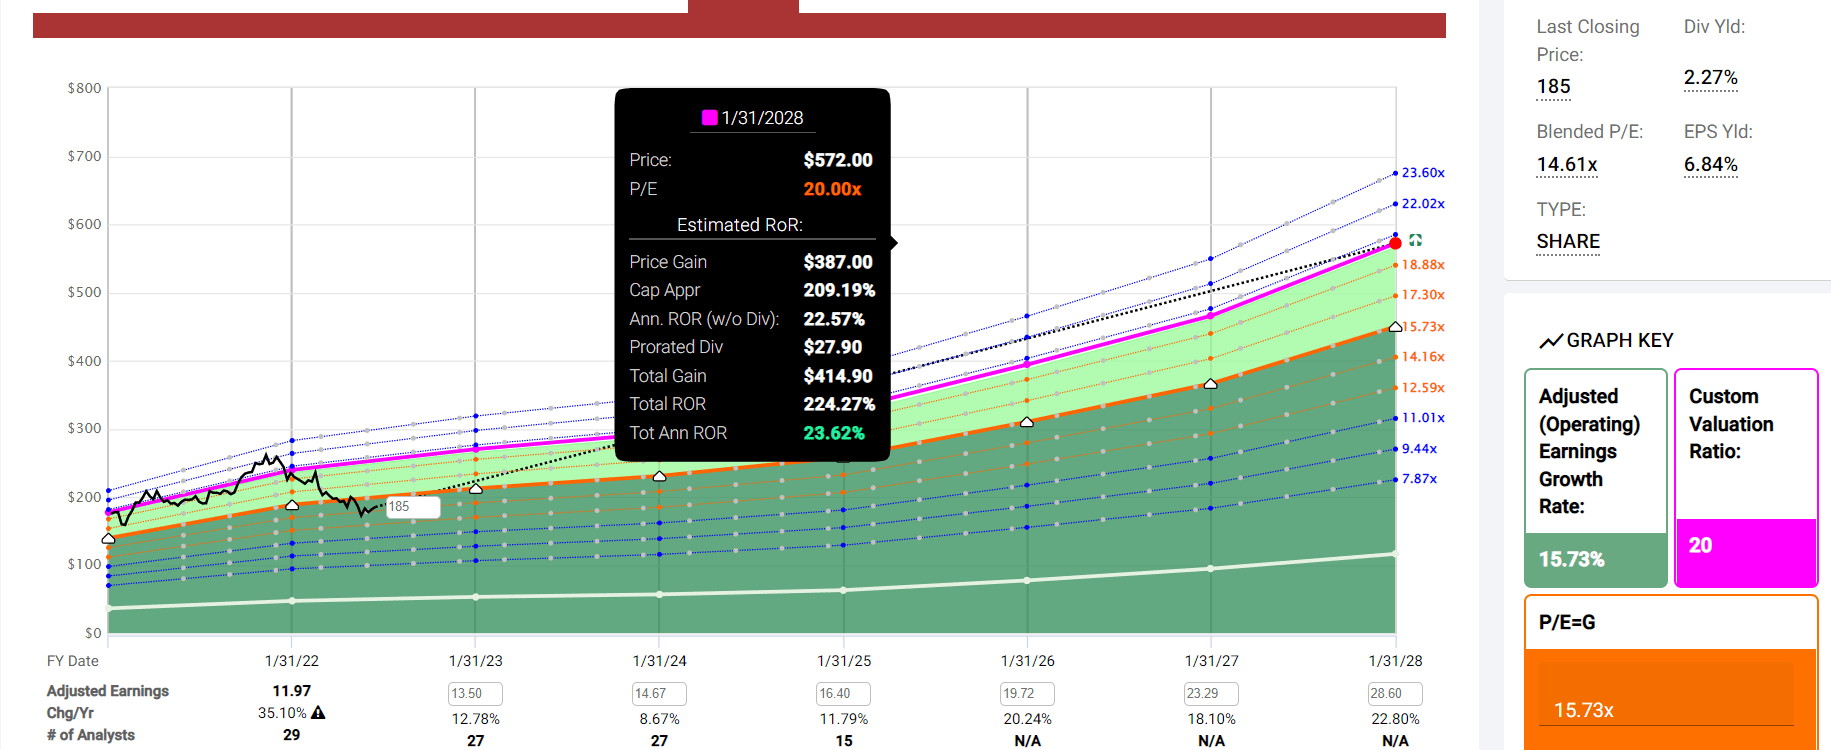
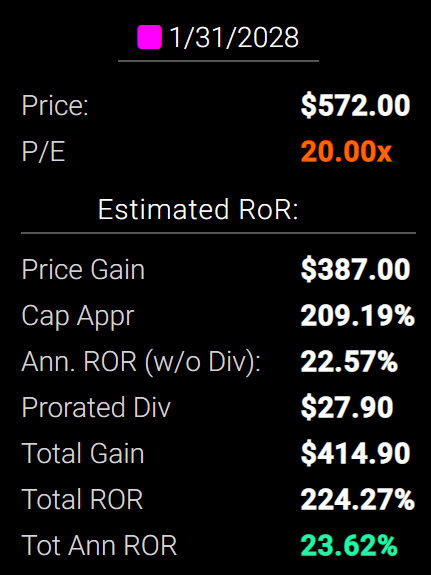
By early 2028 if LOW grows as expected and returns to historical mid-range historical fair value, it could deliver 224% total returns or 24% annually.
- about 4X the S&P 500 consensus
- Buffett-like return potential from an Ultra SWAN dividend king bargain hiding in plain sight
LOW Long-Term Consensus Total Return Potential (Ignoring Valuation Entirely, Cancels Out Over Time)
| Investment Strategy | Yield | LT Consensus Growth | LT Consensus Total Return Potential | Long-Term Risk-Adjusted Expected Return | Long-Term Inflation And Risk-Adjusted Expected Returns | Years To Double Your Inflation & Risk-Adjusted Wealth |
10-Year Inflation And Risk-Adjusted Expected Return |
| Lowe’s | 2.3% | 22.8% | 25.1% | 17.6% | 15.1% | 4.8 | 4.08 |
| Nasdaq | 1.0% | 12.7% | 13.7% | 9.6% | 7.1% | 10.1 | 1.99 |
| Dividend Aristocrats | 2.6% | 8.6% | 11.2% | 7.8% | 5.4% | 13.4 | 1.69 |
| S&P 500 | 1.7% | 8.5% | 10.2% | 7.1% | 4.7% | 15.4 | 1.58 |
(Sources: Morningstar, FactSet, YCharts)
Do I expect Lowe’s to actually deliver 25% returns over the long term? No.
- risk-adjusted returns more closely correlate with historical returns for LOW
- but 17.6% is still a lot more than the aristocrats, S&P or even the Nasdaq
LOW Total Returns Since July 1985
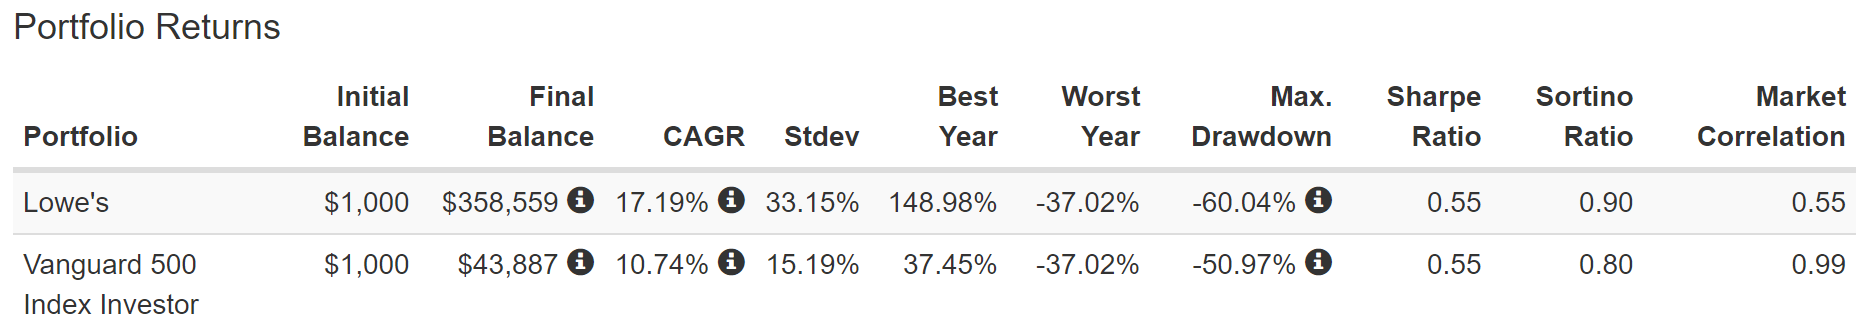
(Source: Portfolio Visualizer Premium)
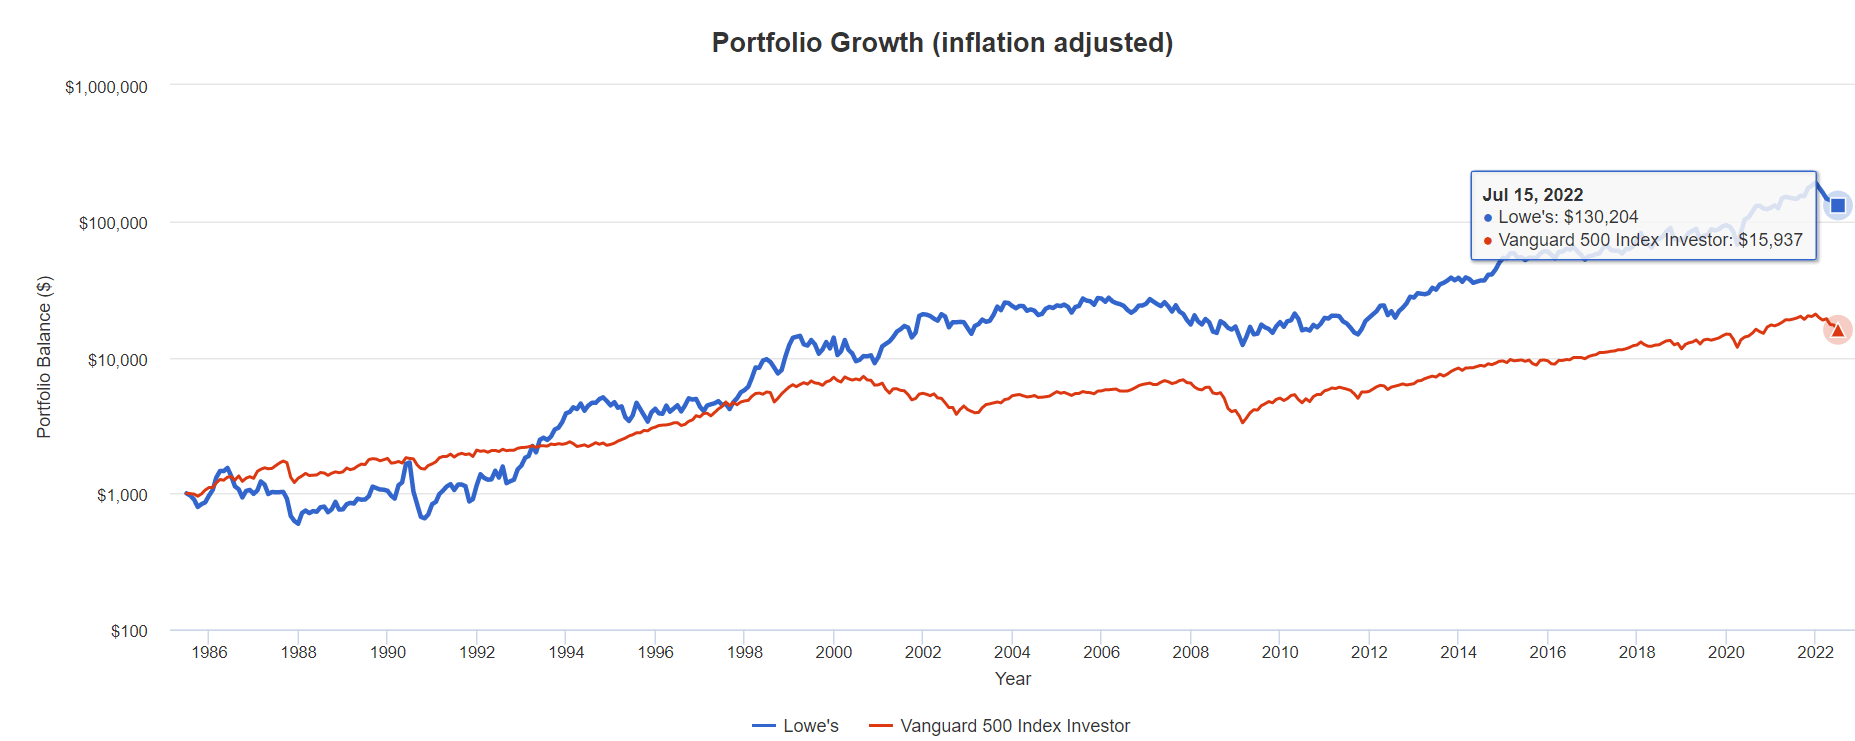
(Source: Portfolio Visualizer Premium)
LOW has delivered 358X returns since 1985.
- 130X adjusted for inflation
- S&P 500 16X
- 8.3X the market’s real returns over 37 years
A Dividend Growth Blue-Chip You Can Trust
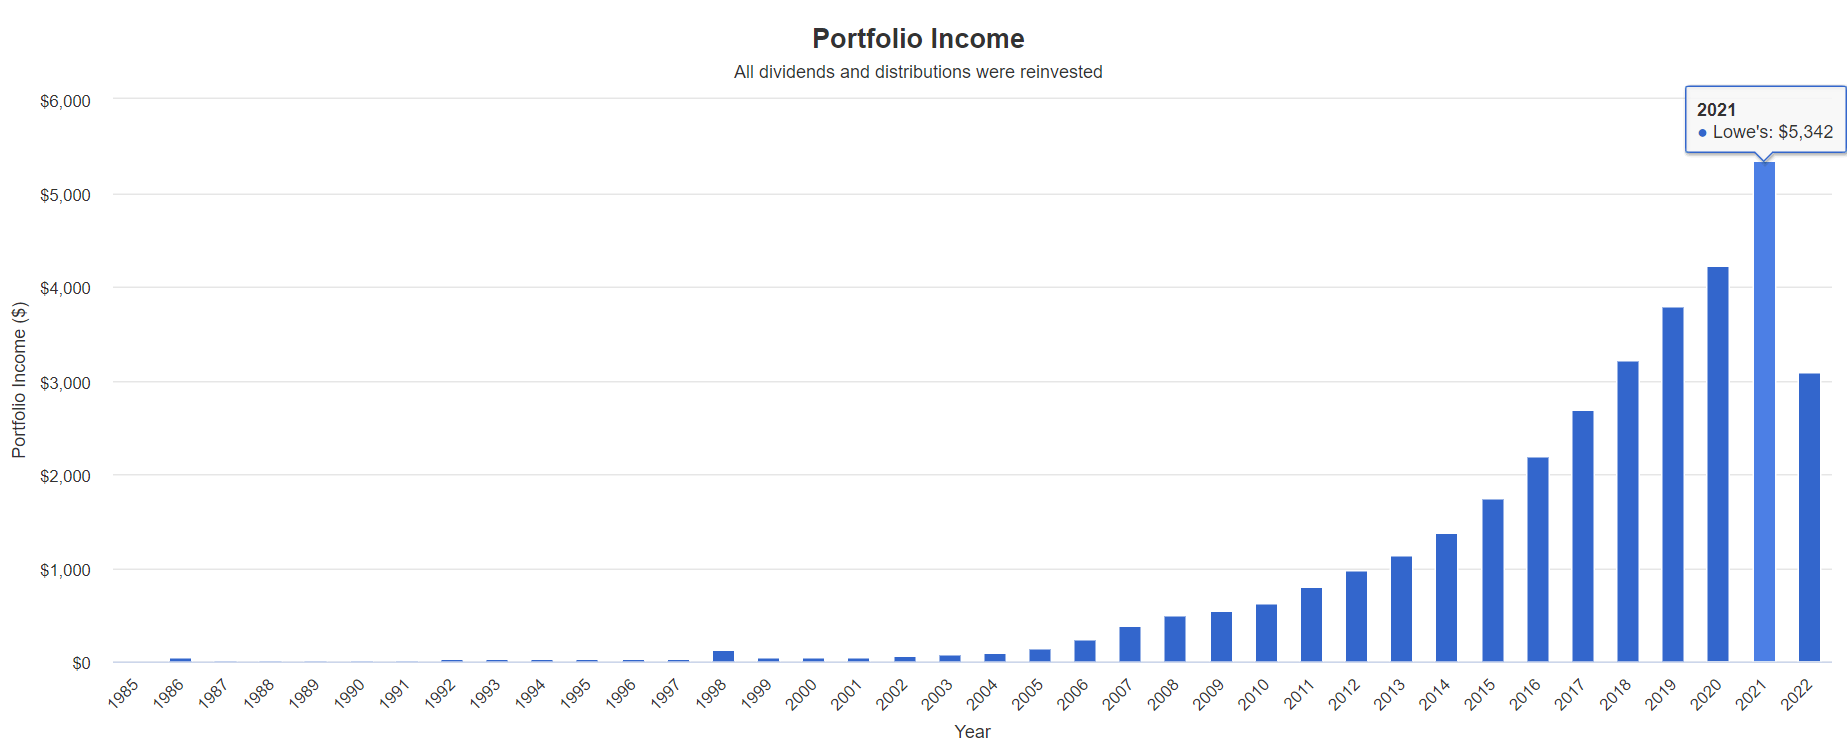
(Source: Portfolio Visualizer Premium)
| Portfolio | 1994 Income Per $1000 Investment | 2022 Income Per $1000 Investment | Annual Income Growth | Starting Yield |
2022 Yield On Cost |
| S&P 500 | $29 | $230 | 7.68% | 2.9% | 23.0% |
| Lowe’s | $12 | $2,546 | 21.09% | 1.2% | 254.6% |
(Source: Portfolio Visualizer Premium)
LOW has delivered 21% income growth over time, 3X better than the S&P 500, and turned a 1.2% yield in 1994 into a 254% yield on cost today.
- the yield on cost if bought in 1985 is now over 600%
What about the future?
| Analyst Consensus Income Growth Forecast | Risk-Adjusted Expected Income Growth | Risk And Tax-Adjusted Expected Income Growth |
Risk, Inflation, And Tax Adjusted Income Growth Consensus |
| 21.6% | 15.1% | 12.9% | 10.3% |
(Source: DK Research Terminal, FactSet)
Analysts expect 22% income growth from LOW in the future, similar to its historical income growth rate. When adjusted for the risk of it not growing as expected, inflation and taxes are about 10.3% real expected income growth.
Now compare that to what they expect from the S&P 500.
| Time Frame | S&P Inflation-Adjusted Dividend Growth | S&P Inflation-Adjusted Earnings Growth |
| 1871-2021 | 1.6% | 2.1% |
| 1945-2021 | 2.4% | 3.5% |
| 1981-2021 (Modern Falling Rate Era) | 2.8% | 3.8% |
| 2008-2021 (Modern Low Rate Era) | 3.5% | 6.2% |
| FactSet Future Consensus | 2.0% | 5.2% |
(Sources: S&P, FactSet, Multipl.com)
- 1.7% post-tax inflation-adjusted income growth from the S&P 500
- S&P 500’s historical post-tax inflation-adjusted income growth rate (current tax code) is 5.8% CAGR
What about a 60/40 retirement portfolio?
- 0.5% consensus inflation, risk, and tax-adjusted income growth.
In other words, LOW is expected to potentially generate about 6X faster real income growth than the S&P 500 and 20X faster income growth than a 60/40.
- with approximately 50% higher yield on day one (and a much safer yield at that)
What inflation-adjusted returns do analysts expect in the future?
Inflation-Adjusted Consensus Return Potential: $1,000 Initial Investment (Ignoring Valuation)
| Time Frame (Years) | 7.7% CAGR Inflation-Adjusted S&P Consensus | 8.7% Inflation-Adjusted Aristocrats Consensus | 22.6% CAGR Inflation-Adjusted LOW Consensus | Difference Between Inflation-Adjusted LOW Consensus Vs S&P Consensus |
| 5 | $1,451.05 | $1,519.66 | $2,773.22 | $1,322.16 |
| 10 | $2,105.56 | $2,309.37 | $7,690.73 | $5,585.17 |
| 15 | $3,055.27 | $3,509.46 | $21,328.04 | $18,272.77 |
| 20 | $4,433.36 | $5,333.20 | $59,147.25 | $54,713.89 |
| 25 | $6,433.04 | $8,104.66 | $164,028.08 | $157,595.04 |
| 30 | $9,334.69 | $12,316.34 | $454,885.24 | $445,550.56 |
(Source: DK Research Terminal, FactSet)
Even if LOW only grows as expected for 10 years, that’s potentially a very attractive 8X inflation-adjusted return.
| Time Frame (Years) | Ratio Aristocrats/S&P Consensus | Ratio Inflation-Adjusted LOW Consensus vs. S&P consensus |
| 5 | 1.05 | 1.91 |
| 10 | 1.10 | 3.65 |
| 15 | 1.15 | 6.98 |
| 20 | 1.20 | 13.34 |
| 25 | 1.26 | 25.50 |
| 30 | 1.32 | 48.73 |
(Source: DK Research Terminal, FactSet)
That’s potentially 3.7X the market’s return and 3.3X more than the dividend aristocrats.
LOW Investment Decision Score

DK
(Source: DK Automated Investment Decision Tool)
For anyone comfortable with its risk profile, LOW is one of the most reasonable and prudent hyper-growth aristocrats you can buy today.
- 34% discount vs 4% market discount = 30% better valuation
- 2.3% yield vs. 1.7% yield (and a much safer yield at that)
- potentially 2.5X better long-term return potential
- 2X better risk-adjusted expected return over the next five years
- 20% of your investment repaid in consensus dividends within five years, about 2X more than the S&P 500
Reason Two: One Of The World’s Greatest Companies
There are many ways to measure safety and quality and I factor in pretty much all of them.
The Dividend Kings’ overall quality scores are based on a 253-point model that includes:
-
Dividend safety
-
Balance sheet strength
-
Credit ratings
-
Credit default swap medium-term bankruptcy risk data
-
Short and long-term bankruptcy risk
-
Accounting and corporate fraud risk
-
Profitability and business model
-
Growth consensus estimates
-
Management growth guidance
-
Historical earnings growth rates
-
Historical cash flow growth rates
-
Historical dividend growth rates
-
Historical sales growth rates
-
Cost of capital
-
GF Scores
-
Long-term risk-management scores from MSCI, Morningstar, FactSet, S&P, Reuters’/Refinitiv, and Just Capital
-
Management quality
-
Dividend-friendly corporate culture/income dependability
-
Long-term total returns (a Ben Graham sign of quality)
-
Analyst consensus long-term return potential
In fact, it includes more than 1,000 fundamental metrics, including the 12 rating agencies we use to assess fundamental risk.
-
credit and risk management ratings make up 41% of the DK safety, and quality model
-
dividend/balance sheet/risk ratings make up 82% of the DK safety and quality model
How do we know that our safety and quality model works well?
During the two worst recessions in 75 years, our safety model 87% of blue-chip dividend cuts, the ultimate baptism by fire for any dividend safety model.
How does LOW score on our comprehensive safety and quality models?
Lowe’s Dividend Safety
| Rating | Dividend Kings Safety Score (162 Point Safety Model) | Approximate Dividend Cut Risk (Average Recession) | Approximate Dividend Cut Risk In Pandemic Level Recession |
| 1 – unsafe | 0% to 20% | over 4% | 16+% |
| 2- below average | 21% to 40% | over 2% | 8% to 16% |
| 3 – average | 41% to 60% | 2% | 4% to 8% |
| 4 – safe | 61% to 80% | 1% | 2% to 4% |
| 5- very safe | 81% to 100% | 0.5% | 1% to 2% |
| LOW | 100% | 0.5% | 1.0% |
| Risk Rating | Low-Risk (87th industry percentile risk-management consensus) | BBB+ stable outlook credit rating 5% 30-year bankruptcy risk | 20% OR LESS Max Risk Cap Recommendation |
Long-Term Dependability
| Company | DK Long-Term Dependability Score | Interpretation | Points |
| Non-Dependable Companies | 21% or below | Poor Dependability | 1 |
| Low Dependability Companies | 22% to 60% | Below-Average Dependability | 2 |
| S&P 500/Industry Average | 61% (61% to 70% range) | Average Dependability | 3 |
| Above-Average | 71% to 80% | Very Dependable | 4 |
| Very Good | 81% or higher | Exceptional Dependability | 5 |
| LOW | 100% | Exceptional Dependability | 5 |
Overall Quality
| LOW | Final Score | Rating |
| Safety | 104% | 5/5 very safe |
| Business Model | 100% | 3/3 wide and stable moat |
| Dependability | 100% | 5/5 exceptional |
| Total | 100% | 13/13 Ultra SWAN Dividend King |
| Risk Rating | 3/3 Low-Risk | |
| 20% OR LESS Max Risk Cap Rec |
0% Margin of Safety For A Potentially Good Buy |
LOW is the third highest quality company on the DK 500 Masterlist.
How significant is this? The DK 500 Master List is one of the world’s best watchlists, including
- every dividend aristocrat (S&P companies with 25+ year dividend growth streaks)
- every dividend champion (every company, including foreign, with 25+ year dividend growth streaks)
- every dividend king (every company with 50+ year dividend growth streaks)
- every foreign aristocrat (every company with 20+ year dividend growth streaks)
- every Ultra SWAN (wide moat aristocrats, as close to perfect quality companies as exist)
- 40 of the world’s best growth stocks
In other words, even among the world’s best companies, LOW is higher quality than 99% of them.
- all but MA and MSFT, in fact
- as close to God’s own dividend growth aristocrat as exists on Wall Street
Why I Trust Lowe’s And So Can You
Lowe’s was founded in 1946 in North Carolina.
- raising its dividend every year since 1963
- through eight recessions
- 2 economic crises
- the housing crisis
- oil prices as high as $147
- inflation as high as 15%
- interest rates as high as 20%
- six bear markets
- dozens of corrections and pullbacks
Basically, Lowe’s is built to last and will likely outlive us all.
- the ultimate buy-and-hold forever dividend growth blue-chip
Earnings Update (Q1 2022)
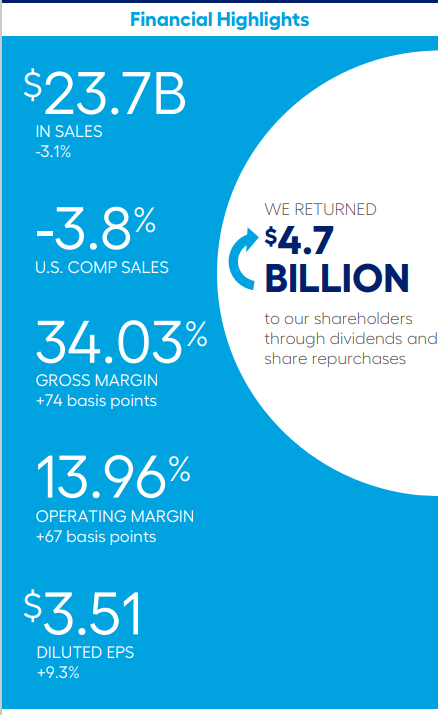
(Source: earnings presentation)
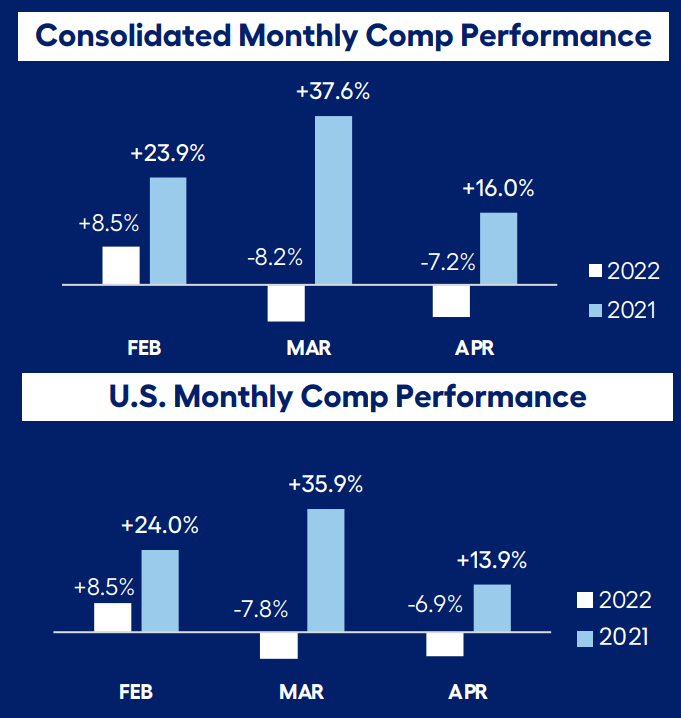
Sales were negative in Q1, but that’s not as alarming as it might seem.
- margins expanded significantly by about 7%
- EPS up 9.3%
(Source: FactSet Research Terminal)
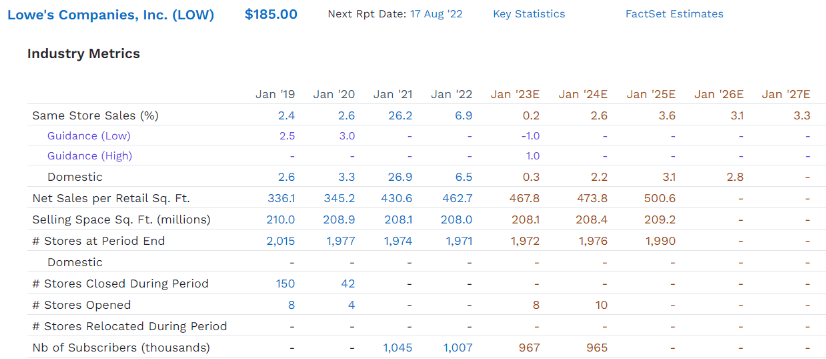
The pandemic caused an incredible 35% increase in same-store sales in two years.
- management is now guiding for flat comps this year
- analysts expect a return to historical 3% or so comps next year
(Source: earnings presentation)
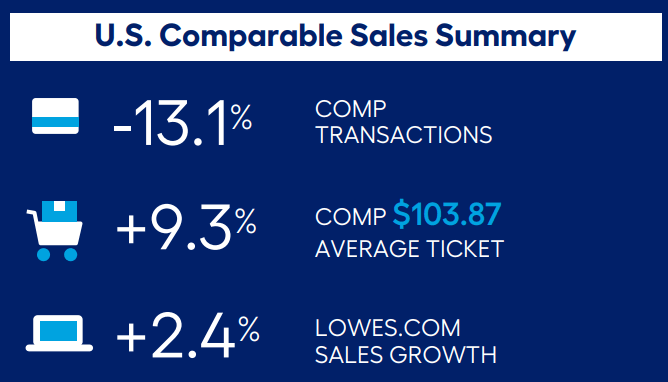
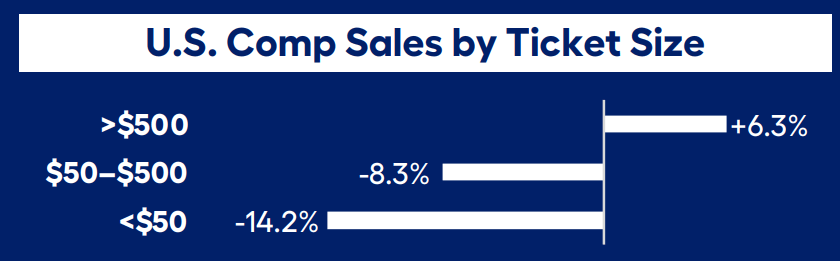
- LOW is passing on 100% of higher prices to consumers as seen by its average ticket sale up 9.3% in Q1
LOW’s online sales growth comps are 2.4% compared to -2% for AMZN.
- last year’s online sales +36%
(Source: earnings presentation)
Comps look so bad because 2021’s (Pandemic year) comps were out literally unbeatable.
- as high as 38% in March 2021
(Source: earnings presentation)
Larger purchases of more than $500 (mostly professionals) actually saw 6.3% comps growth.
(Source: earnings presentation)
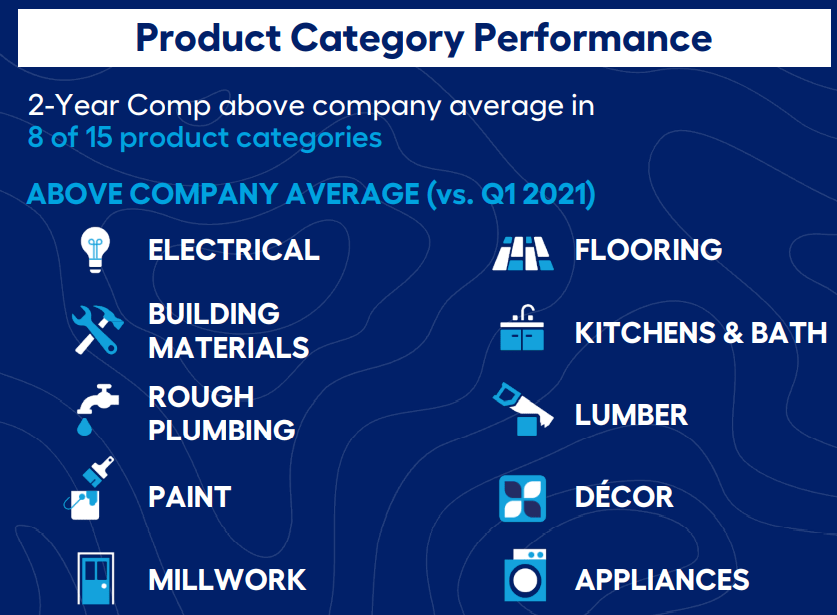
Two-year comps on over half its product categories are running ahead of its long-term company average.
(Source: earnings presentation)
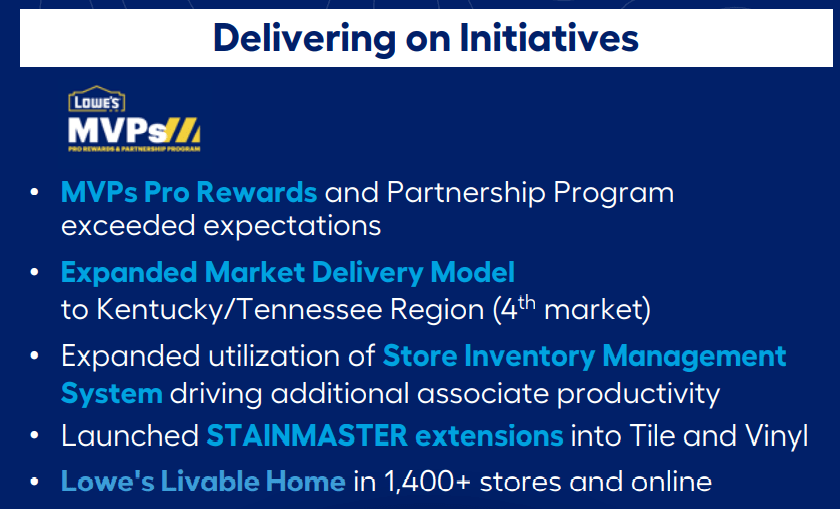
Management is executing on its long-term growth and margin expansion plan and doing a good job.
- as seen by +7% margins vs. TGT and WMT’s that were gutted by inflation
In Pro, we delivered growth of 20% (total) and 64% (US comps) on a two-year basis…
On Lowes.com, sales grew 2% on top of over 36% growth in the first quarter of 2021, which represents a two-year comp of over 39% and nearly 10% sales penetration…
In the first quarter, U.S. comparable sales declined 3.8%, but were up 19.7% on a 2-year basis. CEO, Q1 conference call
LOW continues to grow strongly, including 10% of sales now from online.
- 2 year online sales comps +39%
- 25% market share in professionals, up from 20% last year
The balance sheet remains extremely healthy, and we continue to make progress towards our target of 2.75x adjusted debt-to-EBITDAR, ending the quarter at 2.24x.” – CFO, Q1 conference call
Lowe’s plans to run its balance sheet at 2.75X leverage over the long term.
- rating agencies consider 3.0 or less safe
- 2.25X leverage in Q1
We remain committed to our disciplined capital allocation strategy with approximately $12 billion in share repurchases this year while also supporting our 35% target dividend payout ratio. Finally, we are affirming our outlook of return on invested capital above 36% for the year.” – CFO
Lowe’s plans to buy back $12 billion in shares this year and maintain a very safe 35% payout ratio vs 60% industry safety standards per rating agencies.
Returns on capital are still expected to come in at an industry-leading 36% this year.
Through a combination of both dividends and share repurchases, we returned $4.7 billion to our shareholders. During the quarter, we repurchased 19.2 million shares for $4.1 billion, and we paid $537 million in dividends at $0.80 per share.” – CFO, Q1 conference call
Lowe’s bought back $4.1 billion in stock in Q1 at an average price of $213.54.
- likely buying back a similar amount in Q2 at even lower prices
Basically, LOW’s execution of its plans in Q1 was very good, as expected from one of the best management teams in the industry.
Our Capital Allocation rating for Lowe’s is Exemplary. Forecast-adjusted returns on invested capital, including goodwill (41% on average over the next five years), are set to handily outpace our weighted cost of capital estimate (at 8%) over our entire outlook. Additionally, the balance sheet remains sound, given the company’s medium revenue cyclicality and decent operating leverage. A manageable level of debt is coming due over the next few years, and as such, we aren’t concerned with capital demands. With net debt/EBITDA that should average around 1.8 times over the next decade, there is plenty of financial flexibility on the balance sheet.” – Morningstar
Morningstar considers LOW’s management to be exemplary, and I agree, based on our definition of excellent management quality.
- maintaining a wide and stable moat for decades (75+th industry percentile profitability)
- along with a 20+ year-dividend growth streak (Ben Graham standard of excellence)
Since the beginning of 2018, Lowe’s hired a new CEO, a new chief digital officer (from Amazon), as well as heads of merchandising (Chevron), stores (J.C. Penney, Home Depot), and supply chain (Walmart), and a new CFO (internal succession). Marvin Ellison took the reins from longtime CEO Robert Niblock in July 2018. Ellison brought a tremendous amount of retail knowledge to the business, having previously held the role of CEO of J.C. Penney and acting as a longtime executive at wide-moat peer Home Depot.” – Morningstar
LOW has poached the best and brightest executives from all over Wall Street, including:
This is the all-star team that has been leading LOW for four years and has delivered exceptional results so far, and analysts are highly confident they will achieve their margin expansion goals.
Quantitative Analysis: The Math Backing Up The Investment Thesis
Ben Graham recommended combining qualitative (the story) analysis with quantitative analysis looking at the past, present, and likely future.
LOW Credit Ratings
| Rating Agency | Credit Rating | 30-Year Default/Bankruptcy Risk | Chance of Losing 100% Of Your Investment 1 In |
| S&P | BBB+ Stable Outlook | 5.00% | 20.0 |
| Moody’s | Baa1 (BBB+ equivalent) Stable Outlook | 5.00% | 20.0 |
| DBRS | BBB+ Stable Outlook | 5.00% | 20.0 |
| Consensus | BBB+ Stable Outlook | 5.00% | 20.0 |
(Source: S&P, DBRS, Moody’s)
Rating agencies estimate LOW’s fundamental risk at 5% or a one in 20 chance of losing all your money over the next 30 years.
LOW Leverage Consensus Forecast
| Year | Debt/EBITDA | Net Debt/EBITDA (3.0 Or Less Safe According To Credit Rating Agencies) |
Interest Coverage (8+ Safe) |
| 2020 | 2.42 | 2.37 | 9.14 |
| 2021 | 1.93 | 1.52 | 11.41 |
| 2022 | 1.78 | 2.01 | 13.66 |
| 2023 | 2.08 | 2.08 | 11.90 |
| 2024 | 2.28 | 2.26 | 10.72 |
| 2025 | 2.38 | 2.30 | 11.96 |
| 2026 | 2.87 | NA | NA |
| 2027 | 3.00 | NA | NA |
| Annualized Change | 3.09% | -0.60% | 5.53% |
(Source: FactSet Research Terminal)
Analysts expect LOW to achieve its leverage goal in 2026, though on a net debt/EBITDA basis remain well below it for most of this decade. Interest coverage is expected to keep climbing at a steady 5% to 6% annual rate through at least 2025.
LOW Balance Sheet Consensus Forecast
| Year | Total Debt (Millions) | Cash | Net Debt (Millions) | Interest Cost (Millions) | EBITDA (Millions) | Operating Income (Millions) |
| 2020 | $19,008 | $716 | $18,603 | $691 | $7,839 | $6,314 |
| 2021 | $21,780 | $4,690 | $17,103 | $849 | $11,256 | $9,691 |
| 2022 | $24,727 | $1,133 | $27,918 | $885 | $13,865 | $12,093 |
| 2023 | $30,147 | $2,381 | $30,242 | $1,061 | $14,510 | $12,627 |
| 2024 | $33,772 | $2,923 | $33,553 | $1,207 | $14,824 | $12,938 |
| 2025 | $37,252 | $4,414 | $35,970 | $1,130 | $15,622 | $13,511 |
| 2026 | $47,776 | $4,474 | NA | NA | $16,671 | $14,409 |
| 2027 | $52,776 | $6,142 | NA | NA | $17,587 | $15,693 |
| Annualized Growth | 15.71% | 35.94% | 14.10% | 10.34% | 12.24% | 13.89% |
(Source: FactSet Research Terminal)
Net debt is expected to grow at 14% and basically double in the next five years. Cash flows are expected to grow at low to mid-double digits.
LOW Bond Profile
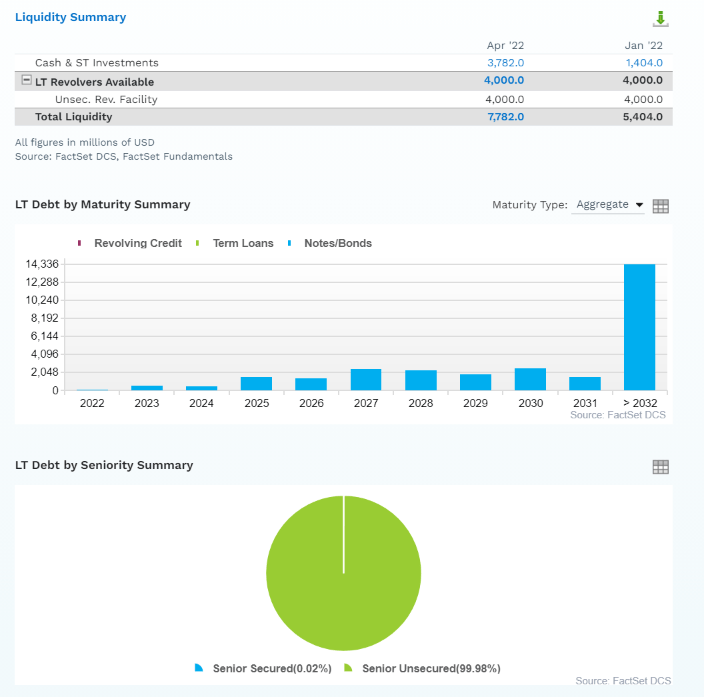
(Source: FactSet Research Terminal)
(Source: FactSet Research Terminal)
- $7.8 billion in liquidity
- well-staggered bond maturities (no problem refinancing maturing debt)
- 100% unsecured bonds for maximum financial flexibility
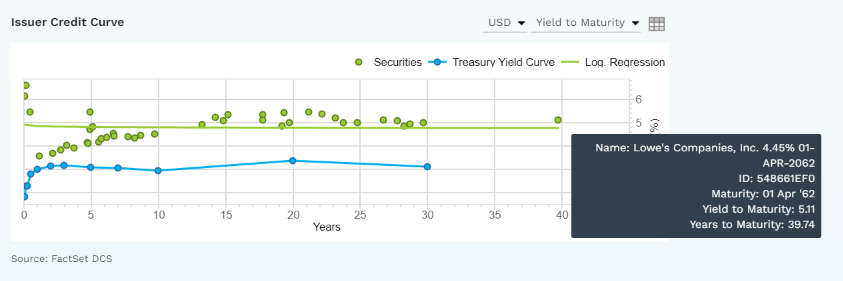
- bond investors are so confident in LOW’s long-term prospects they are willing to lend to it for 40 years at 5.1% (4.5% originally)
- the average borrowing cost is 3.11%
- 0.6% after the bond market’s 30-year inflation expectations
- 0.6% real borrowing costs vs 30.0% cash returns on invested capital
- LOW’s returns on capital are 50X higher than its real borrowing costs
LOW Credit Default SWAPs: Real-Time Fundamental Risk Analysis From The Bond Market
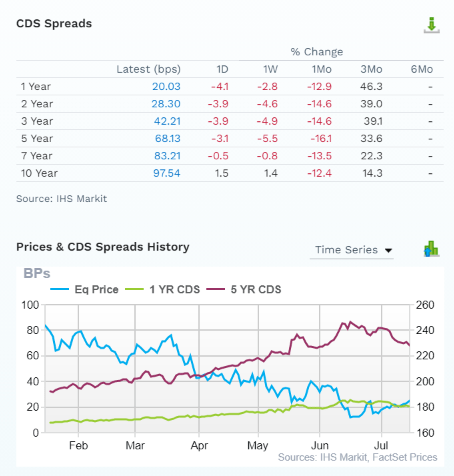
(Source: FactSet Research Terminal)
Credit default SWAPs are the insurance policies bond investors take out against default.
- they represent real-time fundamental risk assessment from the “smart money” on Wall Street
- LOW’s fundamental risk has increased modestly over the last few months
- most likely tied to the slowing housing market and declining economic outlook
- the bond market is pricing in a 3.94% 30-year default risk, which is consistent with its BBB+ credit rating
- basically, analysts, rating agencies, and the bond market all agree
- LOW’s thesis is intact
- 31 analysts, 8 rating agencies, and the bond market make up our LOW expert consensus
- 39 expert consensus + the bond market monitoring LOW’s risk profile
- how we track fundamental risk in real-time
- to ensure high-probability/low-risk investment recommendations
LOW GF Score: The Newest Addition To The DK Safety And Quality Model
The GF Score is a ranking system that has been found to be closely correlated to the long-term performances of stocks by backtesting from 2006 to 2021.” – GuruFocus
GF Score takes five key aspects into consideration. They are:
- Financial Strength
- Profitability
- Growth
- Valuation
- Momentum
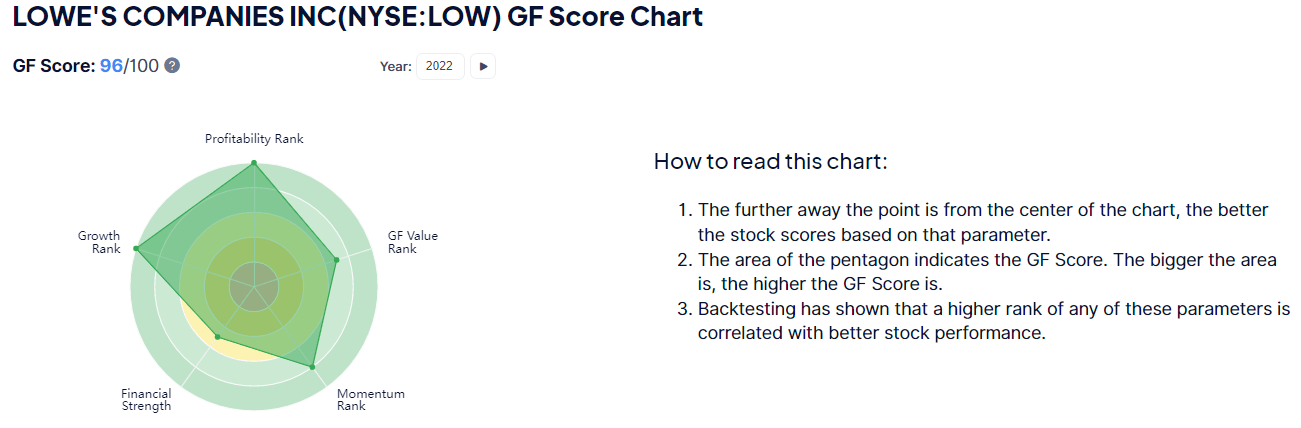
(Source: GuruFocus Premium)
LOW’s excellent score of 96/100 confirms its excellent fundamental quality and highly attractive valuation.
LOW Profitability: Wall Street’s Favorite Quality Proxy
(Source: GuruFocus Premium)
LOW’s profitability is historically in the top 5%
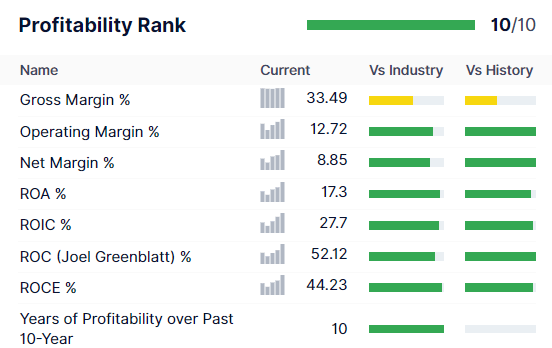
LOW Trailing 12-Month Profitability Vs. Peers
| Metric | TTM | Industry Percentile | Major Cyclical Retailers More Profitable Than LOW (Out Of 1,122) |
| Gross Margins | 33.49% | 41.53 | 656 |
| Operating Margin | 12.72% | 85.38 | 164 |
| Net Margin | 8.85% | 80.91 | 214 |
| Return On Assets | 17.30% | 94.4 | 63 |
| Returns On Invested Capital | 27.70% | 93.4 | 74 |
| Return On Capital (Greenblatt) | 52.12% | 87.81 | 137 |
| Return On Capital Employed | 44.23% | 96.58 | 38 |
| Average | 28.06% | 82.86 | 192 |
(Source: GuruFocus Premium)
In the last year, LOW’s average profitability was in the 83rd industry percentile.
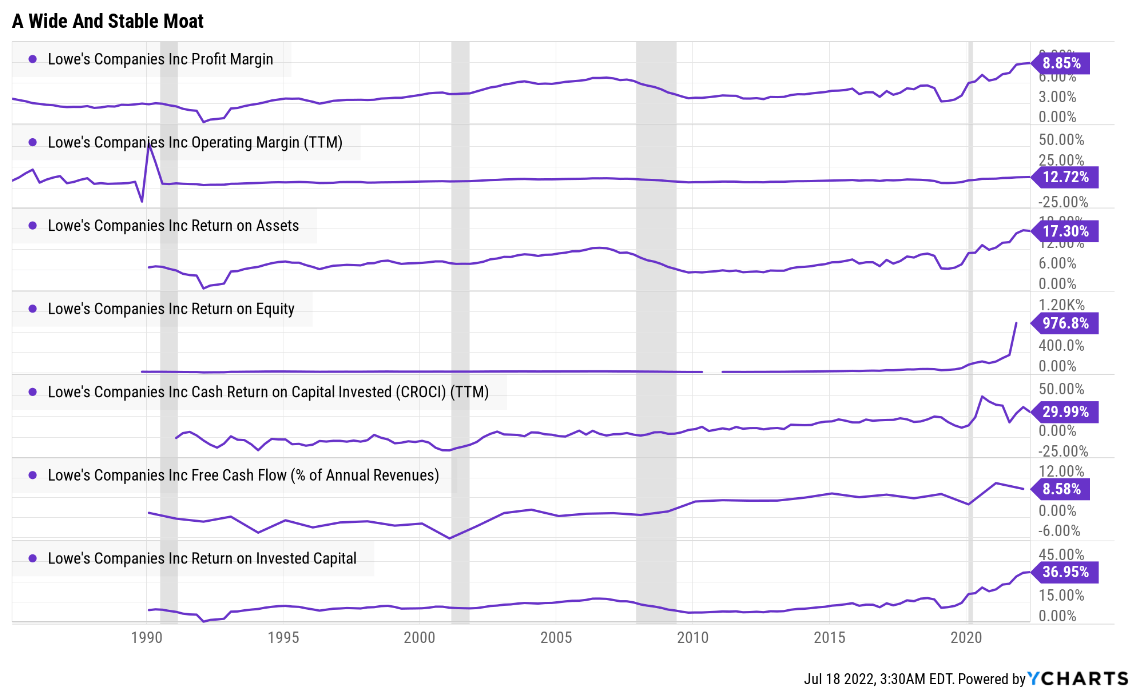
YCharts
Over the last 35 years, LOW’s industry-leading margins have remained relatively stable or improved, confirming a wide and stable moat.
LOW Profit Margin Consensus Forecast
| Year | FCF Margin | EBITDA Margin | EBIT (Operating) Margin | Net Margin | Return On Capital Expansion |
Return On Capital Forecast |
| 2020 | 3.9% | 10.9% | 8.8% | 6.2% | 1.30 | |
| 2021 | 10.3% | 12.6% | 10.8% | 7.4% | TTM ROC | 52.12% |
| 2022 | 8.6% | 14.4% | 12.6% | 8.7% | Latest ROC | 55.70% |
| 2023 | 9.3% | 14.8% | 12.9% | 8.9% | 2027 ROC | 67.70% |
| 2024 | 9.2% | 14.9% | 13.0% | 8.9% | 2027 ROC | 72.35% |
| 2025 | 9.8% | 15.2% | 13.1% | 8.9% | Average | 70.03% |
| 2026 | 9.8% | 15.6% | 13.5% | 9.2% | Industry Median | 11.49% |
| 2027 | 9.9% | 15.7% | 14.0% | 9.6% | LOW/Industry Median | 6.09 |
| Annualized Growth | 14.29% | 5.44% | 7.00% | 6.53% | Vs. S&P | 4.80 |
| Annualized Growth (Post Pandemic) | -0.67% | 3.84% | 4.46% | 4.40% |
Margins exploded post pandemic and are expected to keep rising steadily after.
- FCF margins are slightly lower than 2021’s record due to heavier growth spending
- Returns on capital are expected to grow 30% over the next five years, to around 70%.
- return on capital is Joel Greenblatt’s gold standard proxy for quality and moatiness
- annual pretax profit/the money it takes to run the business
- 40% annual returns for 21 years
- one of the greatest investors in history
- S&P 500 ROC is 14.6%
- the average S&P investment takes about 7 years to pay for itself
- LOW’s ROC is expected to grow to 70%
- with investments paying for themselves in just over a year
- about 6X better than its industry peers and 5X the S&P 500’s
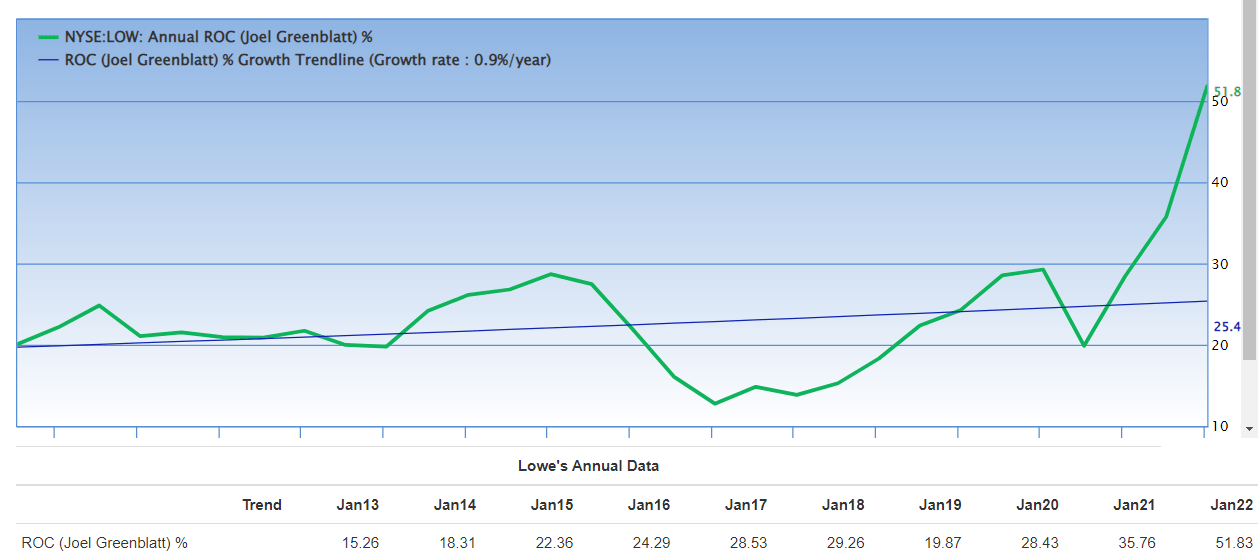
(Source: GuruFocus Premium)
LOW’s ROC has been trending higher at 0.9% per year for 30 years, and has almost doubled since Marvin Ellison took over in 2018.
- further confirming the wide and stable moat
- and good execution on the margin expansion plan
Reason Three: Incredible Growth Potential For Many Years To Come
Based on how LOW has crashed in recent months you might think that its growth outlook was impaired. But that couldn’t be further from the truth.
LOW Medium-Term Growth Consensus Forecast
| Year | Sales | Free Cash Flow | EBITDA | EBIT (Operating Income) | Net Income |
| 2020 | $72,148 | $2,812 | $7,839 | $6,314 | $4,450 |
| 2021 | $89,597 | $9,258 | $11,256 | $9,691 | $6,645 |
| 2022 | $96,250 | $8,260 | $13,865 | $12,093 | $8,367 |
| 2023 | $97,954 | $9,127 | $14,510 | $12,627 | $8,691 |
| 2024 | $99,634 | $9,141 | $14,824 | $12,938 | $8,819 |
| 2025 | $102,800 | $10,055 | $15,622 | $13,511 | $9,200 |
| 2026 | $106,628 | $10,419 | $16,671 | $14,409 | $9,780 |
| 2027 | $111,694 | $11,086 | $17,587 | $15,693 | $10,724 |
| Annualized Growth | 6.44% | 21.65% | 12.24% | 13.89% | 13.39% |
| Annualized Growth (Post Pandemic) | 3.74% | 3.05% | 7.72% | 8.37% | 8.30% |
| Cumulative Over The Next 6 Years | $614,960 | $58,088 | $93,079 | $81,271 | $55,581 |
(Source: FactSet Research Terminal)
Post pandemic analysts expect sales growth of around 4%, driven by about 3% comps and 1% net store openings per year.
The bottom line is expected to grow about 2X as fast due to margin expansion.
$58 billion in cumulative consensus free cash flow over the next six years compared to $56 billion in net profit.
- 104% earnings to free cash flow conversion ratio are excellent for this industry and blue-chip in general
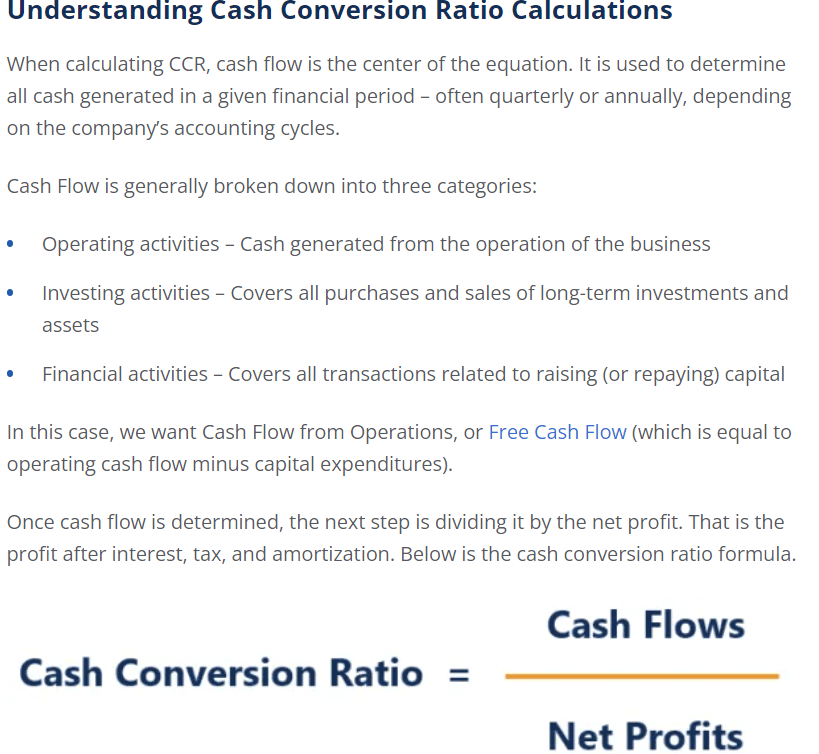
(Source: corporate finance institution)
A company’s cash conversion ratio is usually a good indicator of:
- efficient capital allocation
- low risk of fraud
Most blue-chips will have close to 100% cash conversion ratios over the long-term.
Companies with low ratios are potentially poorly run and or committing accounting fraud.
LOW Dividend Growth Consensus Forecast
| Year | Dividend Consensus | FCF/Share Consensus | FCF Payout Ratio | Retained (Post-Dividend) Free Cash Flow | Buyback Potential | Debt Repayment Potential |
| 2022 | $2.93 | $11.82 | 24.8% | $5,796 | 4.90% | 23.4% |
| 2023 | $3.40 | $14.75 | 23.1% | $7,400 | 6.26% | 24.5% |
| 2024 | $3.65 | $16.84 | 21.7% | $8,600 | 7.27% | 28.5% |
| 2025 | $3.87 | $19.39 | 20.0% | $10,119 | 8.56% | 30.0% |
| 2026 | $4.60 | $22.18 | 20.7% | $11,462 | 9.69% | 30.8% |
| 2027 | $6.22 | $25.01 | 24.9% | $12,251 | 10.36% | 32.9% |
| Total 2022 Through 2027 | $24.67 | $109.99 | 22.4% | $55,628.64 | 47.05% | 184.52% |
| Annualized Rate | 16.25% | 16.17% | 0.07% | 16.15% | 16.15% | 7.01% |
(Source: FactSet Research Terminal)
60% is the safe payout ratio for this industry, according to rating agencies.
- management’s policy is a 35% EPS payout ratio
- LOW’s FCF payout ratio is expected to average 22% over the next five years
- allowing it to retain $56 billion in post-dividend free cash flow
- enough to pay off almost 2X its debt
- or buyback up to 47% of shares at existing valuations
LOW Buyback Consensus Forecast
| Year | Consensus Buybacks ($ Millions) | % Of Shares (At Current Valuations) | Market Cap |
| 2022 | $12,000 (Guidance) | 10.1% | $118,239 |
| 2023 | $12,000 (Guidance) | 10.1% | $118,239 |
| Total 2022-2023 | $24,000 (Guidance) | 20.3% | $118,239 |
| Annualized Rate | 10.56% | Average Annual Buybacks | $12,000.00 |
(Source: FactSet Research Terminal)
Management says it will buy back $24 billion in fiscal 2022 and 2023 (our 2021 and 2022).
That’s enough to repurchase about 20% of shares at current valuations.
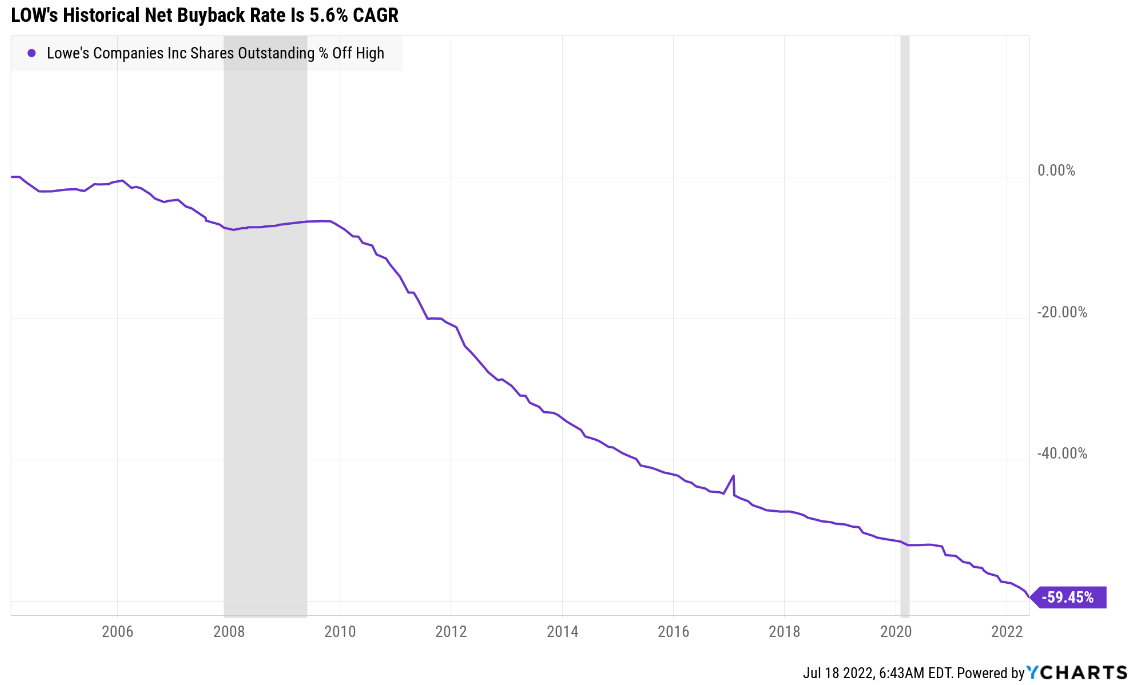
YCharts
LOW has bought back 60% of net shares (including stock options) over the last 16 years, including 10% of shares last year alone.
- and another 10% this year per management
| Time Frame (Years) | Net Buyback Rate | Shares Remaining | Net Shares Repurchased | Each Share You Own Is Worth X Times More (Not Including Future Growth And Dividends) |
| 5 | 5.7% | 74.69% | 25.31% | 1.34 |
| 10 | 5.7% | 55.78% | 44.22% | 1.79 |
| 15 | 5.7% | 41.66% | 58.34% | 2.40 |
| 20 | 5.7% | 31.12% | 68.88% | 3.21 |
| 25 | 5.7% | 23.24% | 76.76% | 4.30 |
| 30 | 5.7% | 17.36% | 82.64% | 5.76 |
(Source: FactSet, YCharts)
If LOW were to keep up its historical buyback rate, then over 30 years, it could potentially repurchase 83% of shares and increase the intrinsic value of your shares by 6X.
- not counting future earnings and dividend growth
LOW Long-Term Growth Outlook
(Source: FactSet Research Terminal)
- 11.7% to 22.8% growth consensus range (five sources)
- the median consensus from all 31 analysts is 22.8%
- the individual analyst range is 7% to 34%
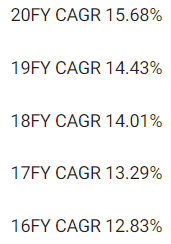
- the growth rate over the last 20 years was 15.68% CAGR
- analysts think LOW can keep growing at its historical rate for the foreseeable future
- or even accelerate growth
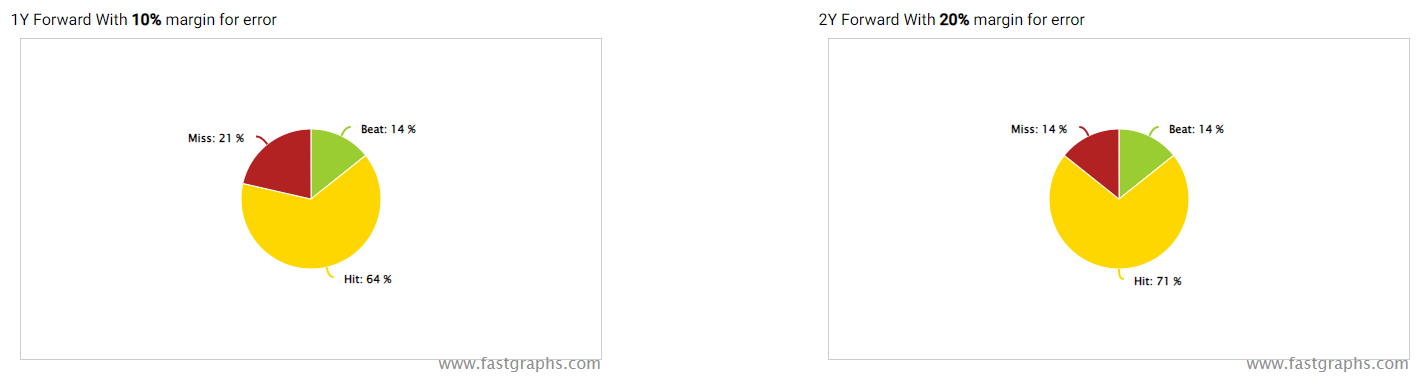
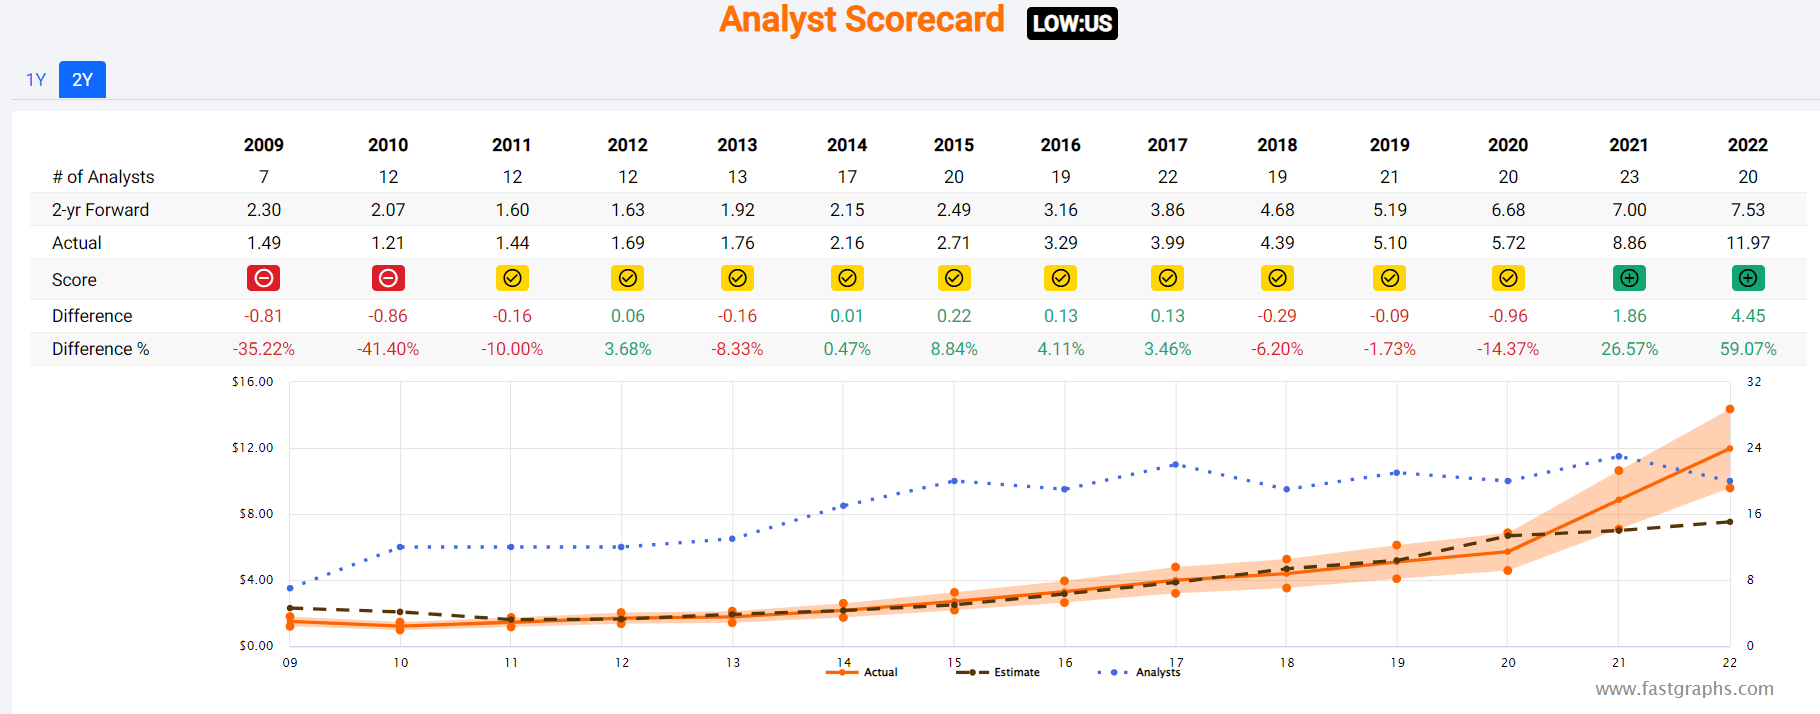
How accurate are analyst forecasts for LOW (partially based on management guidance)?
FAST Graphs, FactSet Research
FAST Graphs, FactSet Research
- Smoothing for outliers, historical analyst margins-of-error are 10% to the downside and 10% to the upside
- margin-of-error adjusted consensus growth range: 10% to 26% CAGR
- 70% statistical probability that LOW grows 10% to 26% over time
FAST Graphs, FactSet Research
FAST Graphs, FactSet Research
FAST Graphs, FactSet Research
FAST Graphs, FactSet Research
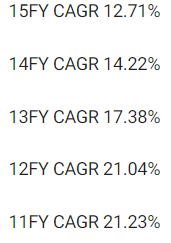
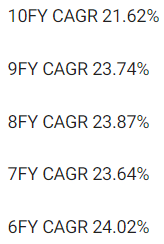
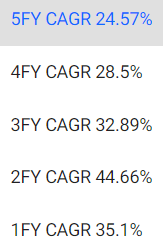
LOW’s historical growth rates range from 13% to 45% CAGR, and analysts expect the acceleration of growth of the last decade (22% growth) to continue
- due to a 10 to 20 year secular boom in housing
- driven by 150 million millennials and Gen Zers starting families and buying homes
Reason Four: A Wonderful Company At A Wonderful Price
(Source: FAST Graphs, FactSet)
(Source: FAST Graphs, FactSet)
(Source: FAST Graphs, FactSet)
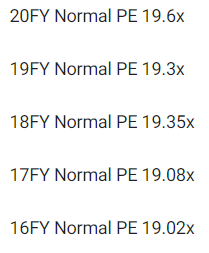
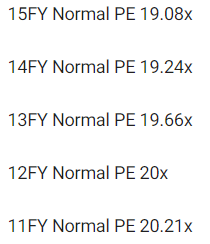
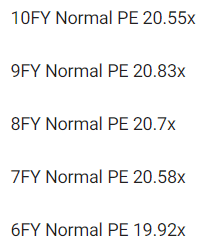
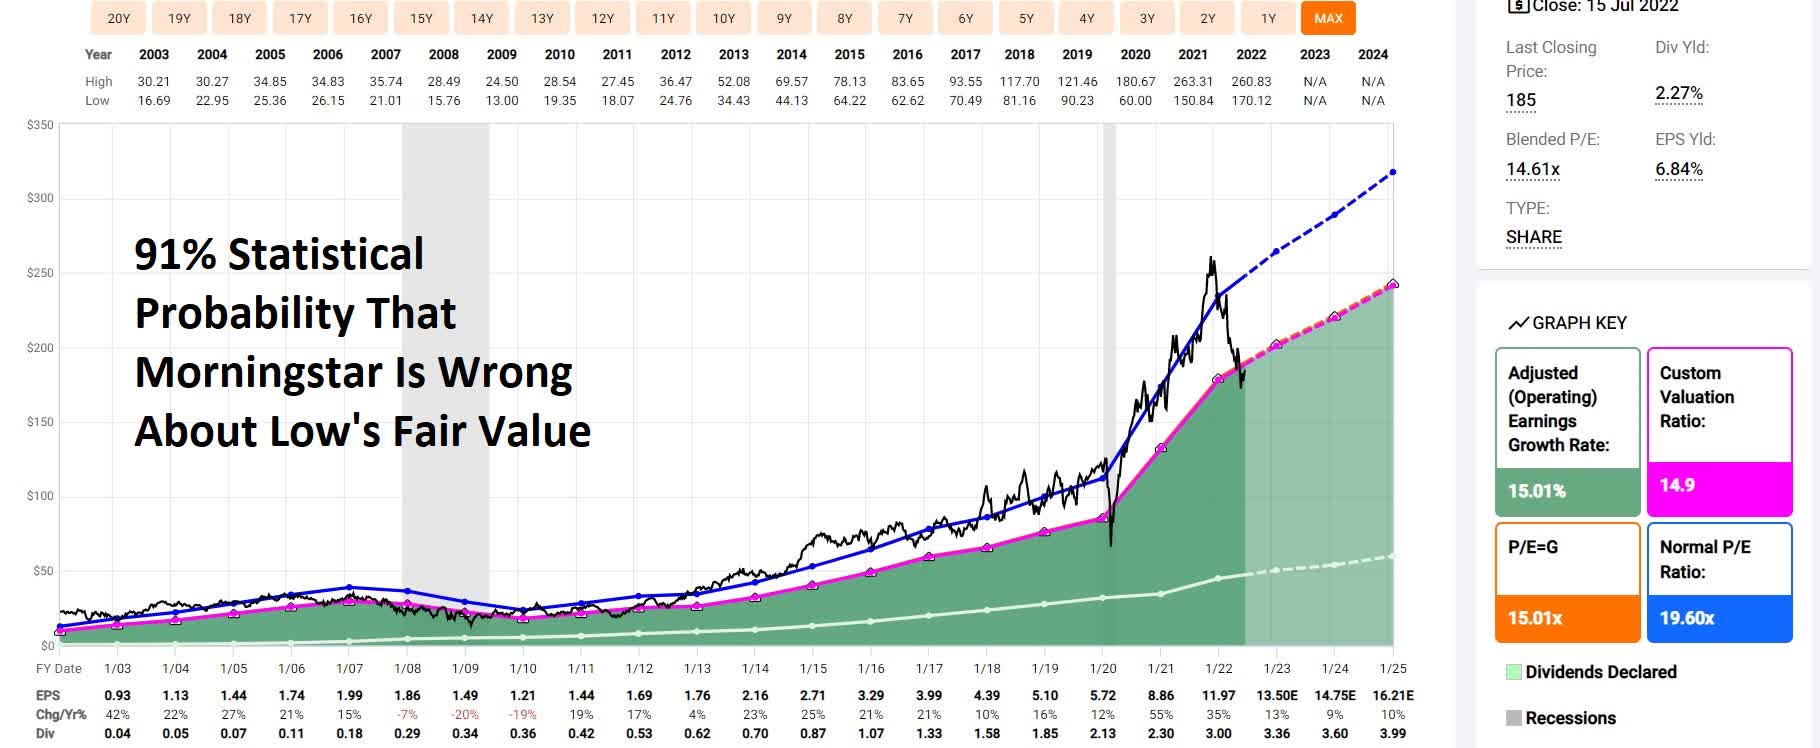
For 20 years, hundreds of millions of income investors, outside of bear markets and bubbles, have consistently paid 19 to 21X earnings for LOW.
- 91% statistical probability LOW is worth around 20X earnings unless it grows significant slowly in the future (less than 13% per year)
| Metric | Historical Fair Value Multiples (15-year) | 2021 | 2022 | 2023 | 2024 | 2025 |
12-Month Forward Fair Value |
| Earnings | 20.00 | $234.00 | $267.00 | $291.40 | $337.60 | $432.60 | |
| Average | $234.00 | $267.00 | $291.40 | $337.60 | $432.60 | $280.14 | |
| Current Price | $185.00 | ||||||
|
Discount To Fair Value |
20.94% | 30.71% | 36.51% | 45.20% | 57.24% | 33.96% | |
|
Upside To Fair Value (NOT Including Dividends) |
26.49% | 44.32% | 57.51% | 82.49% | 133.84% | 51.43% (54% including dividend) | |
| 2022 EPS | 2023 EPS | 2022 Weighted EPS | 2023 Weighted EPS | 12-Month Forward EPS | 12-Month Average Fair Value Forward PE |
Current Forward PE |
|
| $13.35 | $14.57 | $6.16 | $7.85 | $14.01 | 20.0 | 13.2 |
I estimate LOW is worth 20X earnings, its historical-market-determined mid-range fair value.
Today it trades at 13.2X forward earnings.
LOW isn’t just hyper-growth at a reasonable price; it’s a hyper-growth Ultra SWAN dividend king at a wonderful price.
- A cash-adjusted PEG of 0.47
|
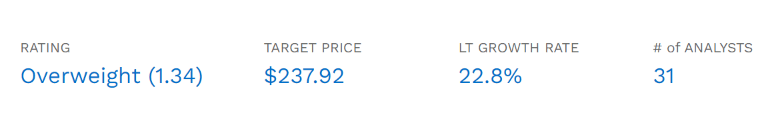
Analyst Median 12-Month Price Target |
Morningstar Fair Value Estimate |
| $237.92 (17 PE) | $209.00 (14.9 PE) |
|
Discount To Price Target (Not A Fair Value Estimate) |
Discount To Fair Value |
| 22.24% | 11.48% |
|
Upside To Price Target (Not Including Dividend) |
Upside To Fair Value (Not Including Dividend) |
| 28.61% | 12.97% |
|
12-Month Median Total Return Price (Including Dividend) |
Fair Value + 12-Month Dividend |
| $241.12 | $212.20 |
|
Discount To Total Price Target (Not A Fair Value Estimate) |
Discount To Fair Value + 12-Month Dividend |
| 23.27% | 12.82% |
|
Upside To Price Target ( Including Dividend) |
Upside To Fair Value + Dividend |
| 30.34% | 14.70% |
Morningstar’s discounted cash flow model estimates LOW is worth 14.9X earnings.
- a PE’s only ever achieved in severe recessionary bear markets
FAST Graphs, FactSet Research
- Lowe’s tends to hug a P/E of 20 like a rail over the last decade
- recessionary bear market lows are not the definition of fair value
- the price at which yield + long-term growth = total return (with valuations mean reverting) is
Analysts expect LOWs to trade at 17X and deliver a 30% total return within a year.
- 54% would be justified by fundamentals
I don’t recommend companies based on 12-month forecasts but on whether the margin of safety is sufficient to compensate for a company’s risk profile.
Margin Of Safety Not 12-Month Price Targets Are How I Make Investment Decisions
| Rating | Margin Of Safety For 100% Quality Low-Risk 13/13 Ultra SWAN quality companies | 2022 Fair Value Price | 2023 Fair Value Price |
12-Month Forward Fair Value |
| Potentially Reasonable Buy | 0% | $267.00 | $291.40 | $280.14 |
| Potentially Good Buy | 0% | $267.00 | $291.40 | $280.14 |
| Potentially Strong Buy | 10% | $240.30 | $262.26 | $252.12 |
| Potentially Very Strong Buy | 20% | $213.60 | $233.12 | $224.11 |
| Potentially Ultra-Value Buy | 30% | $186.90 | $203.98 | $196.10 |
| Currently | $185.00 | 30.71% | 36.51% | 33.96% |
| Upside To Fair Value (Not Including Dividends) | 44.32% | 57.51% | 51.43% |
For anyone comfortable with its risk profile, LOW is a potential Ultra Value buy, a Buffett-style “Fat Pitch.”
Risk Profile: Why Lowe’s Isn’t Right For Everyone
There are no risk-free companies, and no company is right for everyone. You have to be comfortable with the fundamental risk profile.
What Could Cause LOW’s Investment Thesis To Break
- safety falls to 40% or less
- balance sheet collapses ( unlikely, 5% probability according to rating agencies)
- the collapse of the US housing market that lasts for 10 to 20 years (it’s never happened before)
- growth outlook falls to less than 7.7% for eight years
- LOW’s role in my portfolio is to deliver long-term 10+% returns with minimal fundamental risk
- 8+% total return requirement for defensive sectors (including midstream)
- 10+% for non-defensive (cyclical) sectors
How long it takes for a company’s investment thesis to break depends on the quality of the company.
| Quality |
Years For The Thesis To Break Entirely |
| Below-Average | 1 |
| Average | 2 |
| Above-Average | 3 |
| Blue-Chip | 4 |
| SWAN | 5 |
| Super SWAN | 6 |
| Ultra SWAN | 7 |
| 100% Quality Companies (MSFT, LOW, and MA) | 8 |
These are my personal rule of thumb for when to sell a stock if the investment thesis has broken. LOW is highly unlikely to suffer such catastrophic declines in fundamentals.
Risk Profile Summary
- economic cyclicality risk: sales are partially driven by new homes sales); the recent slowdown could reduce estimates
- 39% peak EPS decline in the Great Recession
- M&A execution risk: CA acquisition (Rona) didn’t work out
- Margin expansion plan execution risk: thus far, going well, but if it fails, growth estimates could fall significantly
- talent retention risk in the tightest job market in 50 years
- cyber-security risk: hackers and ransomware
- disruption risk: minimal, though AMZN is trying to increase its sales of similar products
How do we quantify, monitor, and track such a complex risk profile? By doing what big institutions do.
Long-Term Risk Analysis: How Large Institutions Measure Total Risk
- see the risk section of this video to get an in-depth view (and link to two reports) of how DK and big institutions measure long-term risk management by companies
LOW Long-Term Risk-Management Consensus
| Rating Agency | Industry Percentile |
Rating Agency Classification |
| MSCI 37 Metric Model | 96.0% |
AA Industry Leader, Positive Trend |
| Morningstar/Sustainalytics 20 Metric Model | 96.5% |
11.5/100 Low-Risk |
| Reuters’/Refinitiv 500+ Metric Model | 99.3% | Excellent |
| S&P 1,000+ Metric Model | 48% | Average |
| Just Capital 19 Metric Model | 96.2% | Excellent |
| FactSet | 30.0% |
Below-Average, Negative Trend |
| Morningstar Global Percentile (All 15,000 Rated Companies) | 97.1% | Excellent |
| Just Capital Global Percentile (All 954 Rated US Companies) | 92.7% | Excellent |
| Consensus | 82% |
Low-Risk, Very Good Risk-Management, Stable Trend |
(Sources: MSCI, Morningstar, FactSet, Just Capital, S&P, Reuters)
LOW’s Long-Term Risk Management Is The 57th Best In The Master List (89th Percentile)
| Classification | Average Consensus LT Risk-Management Industry Percentile |
Risk-Management Rating |
| S&P Global (SPGI) #1 Risk Management In The Master List | 94 | Exceptional |
| Lowe’s | 82 | Very Good |
| Strong ESG Stocks | 78 |
Good – Bordering On Very Good |
| Foreign Dividend Stocks | 75 | Good |
| Ultra SWANs | 71 | Good |
| Low Volatility Stocks | 68 | Above-Average |
| Dividend Aristocrats | 67 | Above-Average |
| Dividend Kings | 63 | Above-Average |
| Master List average | 62 | Above-Average |
| Hyper-Growth stocks | 61 | Above-Average |
| Monthly Dividend Stocks | 60 | Above-Average |
| Dividend Champions | 57 | Average bordering on above-average |
(Source: DK Research Terminal)
LOW’s risk-management consensus is in the top 11% of the world’s highest quality companies and similar to that of such other blue-chips as
- Ecolab (ECL) – dividend aristocrat
- Colgate-Palmolive (CL) – dividend king
- Automatic Data Processing (ADP) – dividend aristocrat
- Target (TGT) – dividend king
- Pepsi (PEP) – dividend king
- AbbVie (ABBV) – dividend king
- W. W. Grainger (GWW) – dividend king
- Cummins (CMI) – Ultra SWAN
- Mastercard (MA) – 100% quality Ultra SWAN
- Merck (MRK) – Ultra SWAN
- Adobe (ADBE) – Ultra SWAN
- BlackRock (BLK) – Ultra SWAN
- Microsoft (MSFT) – 100% quality Ultra SWAN
The bottom line is that all companies have risks, and LOW is very good at managing theirs.
How We Monitor LOW’s Risk Profile
- 31 analysts
- 3 credit rating agencies
- 8 total risk rating agencies
- 39 experts who collectively know this business better than anyone other than management
- and the bond market for real-time fundamental risk updates
When the facts change, I change my mind. What do you do sir?” – John Maynard Keynes
There are no sacred cows at iREIT or Dividend Kings. Wherever the fundamentals lead, we always follow. That’s the essence of disciplined financial science, the math behind retiring rich and staying rich in retirement.
Bottom Line: Buy Lowe’s In This Bear Market, And You Could Retire In Safety And Splendor
Don’t get me wrong, I’m not a market timer, and I’m not crazy. If we get a recession in 2023, the market will likely fall more, and Lowe’s is likely to fall with it.
How much lower could stocks fall?
| Time Frame | Historically Average Bear Market Bottom |
| Non-Recessionary Bear Markets Since 1965 | -21% (Achieved May 20th) |
| Median Recessionary Bear Market Since WWII | -24% (Citigroup base case with a mild recession) June 16th |
| Non-Recessionary Bear Markets Since 1928 | -26% (Goldman Sachs base case with a mild recession) |
| Average Bear Markets Since WWII | -30% (Morgan Stanely base case, no recession) |
| Recessionary Bear Markets Since 1965 | -36% (Bank of America recessionary base case) |
| All 140 Bear Markets Since 1792 | -37% |
| Average Recessionary Bear Market Since 1928 |
-40% (Deutsche Bank, Bridgewater, SocGen Severe Recessionary base case, Morgan Stanley Recessionary Base Case) |
|
(Sources: Ben Carlson, Bank of America, Oxford Economics, Goldman Sachs) |
That depends on how bad the recession is. But the blue-chip economist consensus, specifically the 16 most accurate economist teams in the world, thinks stocks MIGHT fall another 10% to 35%.
But Wall Street doesn’t run on certainties, and stocks don’t bottom because the bad news stops.
- stocks bottom when investors stop getting surprised by bad news
Don’t try to buy at the bottom and sell at the top. This can’t be done – except by liars.” – Barnard Baruch
Here’s what I can tell you with high confidence.
- LOW is one of the world’s safest, most dependable, and highest quality companies on earth
- top 1% of the world’s best blue-chips
- 2.3% rapidly growing very safe yield expected to grow 16% over the next five years
- 25% CAGR long-term total return potential, 17.6% risk-adjusted expected returns, vs. 17% returns over the last 37 years
- 34% discount to fair value = potential Ultra Value Buffett-style “fat pitch”
- 10.7X cash-adjusted earnings = hyper-growth at a wonderful price
- about 225% consensus return potential over the next five years, 24% CAGR, about 4X more than the S&P 500
- 2X better risk-adjusted expected returns of the S&P 500 over the next five years with 2X higher consensus dividend income
Lowe’s is already priced as if we weren’t just in a recession but a severe recession.
It’s priced as if the housing market has already collapsed and unemployment was soaring.
And even if these things terrible things did happen, which they are not likely to given the actual economic data, LOW’s has been through far worse over the 60 years in which it’s grown its dividend…every…single…year.
The intelligent investor is a realist who buys from pessimists, and sells to optimists.” – Ben Graham
I don’t know about you, but when I see the opportunity to earn Buffett-like returns from one of the world’s best blue-chip bargains hiding in plain sight, I don’t care if I nail the bottom, and neither should you.
Because in 10+ years, if Lowe’s has delivered on its margin expansion plans, we’ll be awash in profits and dividends and feel like we bought the bottom.
So if you’re looking for one of the safest dividend growth stocks you can buy in this bear market, consider Lowe’s.
Consider Lowe’s if you’re looking for a dividend king that’s growing like a weed.
Lowe’s might be just what you’re looking for if you’re hankering for hyper-growth at a wonderful price.
And if you’re looking to bend it like Buffett, and be greedy when others are fearful, then Lowe’s might be just the “fat pitch” you need to retire in safety and splendor.
Be the first to comment