

simon2579/E+ via Getty Images
Author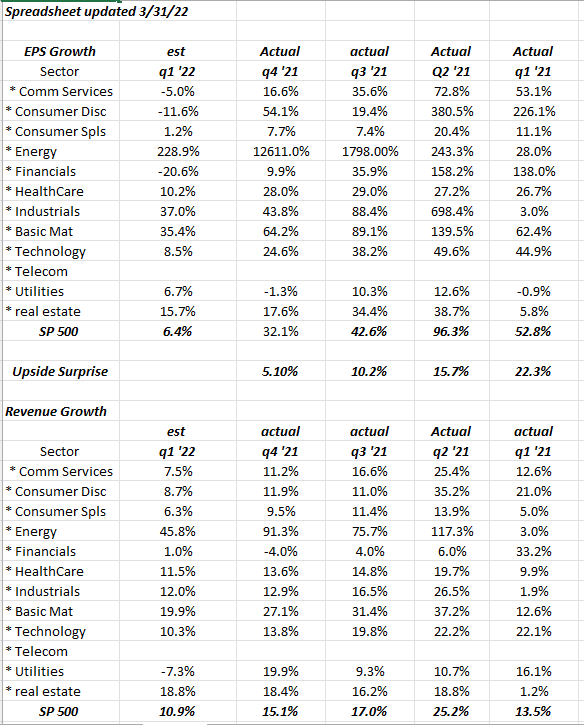
This blog has been tracking y.y revenue and EPS growth for the S&P 500 since 2012-2013. Normally, the blog deals with “forward-looking” or “expected” EPS and revenue growth, which is all investors care about around earnings time, but in the above table, which is a small subset of a bigger spreadsheet using IBES by Refinitiv data, readers can see what the Q1 ’22 “expected” EPS and revenue growth for the 11 S&P 500 sectors, and what the Q1 ’21 compare actually looks like.
An interesting point was made by David Kelly, JPMorgan’s Chief Global Strategist in JPMorgan’s “Guide to the Markets” call when he noted that US output is now 3.4% higher than pre-pandemic in the US.
It’s interesting looking at quarterly EPS and revenue growth for the S&P 500 in 2019: averaging the 4 quarters of 2019, S&P 500 EPS averaged 2% for the year, while revenue growth averaged 5% for 2019, and yet the S&P 500 returned 31.49% in calendar 2019.
- Energy faces tougher comps as 2022 unfolds. Q1 ’22 is the last easy comparison for the Energy sector for the rest of the calendar year. Energy consensus is expecting 46% revenue growth and 228% EPS growth for Q1 ’22.
- Looking at the bank and financial sector trade in Q1 ’22, it’s been quite a beating. The sector is expecting flat revenue growth y.y and a decline in EPS of 20% overall in Q1 ’22. JPMorgan was part of the top 10 of the S&P 500 in terms of market cap weights but has now fallen to the 12th largest market cap weight. JPM printed $15.34 in EPS in calendar 2021 but is expected as of tonight to print $10.55 for 2021. That’s still 15% higher than 2019’s full-year EPS print of $8.87. That’s a 30% reduction in JPM’s expected full-year 2022 results if it materializes. The financial sector is also facing very tough compares to early 2021 with the reserve releases that were taken in 2020 all coming back in early 2021 along with reinstated share repurchases.
- Technology sector: This tech sector update was written in late March, ’22 and talks about Tech’s tough compares with the first half of 2021. The expected Q1 ’22 tech sector EPS growth of 8.5% was surprising when the above table was put together. The tech sector is still expecting 10% y.y revenue growth. Most of the mega-cap techs report in the last week of April (again).
Summary/conclusion: It’s remarkable the difference in S&P 500 EPS and revenue growth between 2019 and 2021. As noted above in 2019, the S&P 500 averaged 2% EPS growth and 5% revenue growth, while 2021 averaged 53% EPS growth and 17% revenue growth. For comparison, from late 2011-2012, the S&P 500’s average EPS growth rate was 11% and revenue growth was 5%, through the Q4 ’21 quarter.
The S&P 500 is slowly returning to normal, or rather a new normal, somewhat like the old normal.
The weekly earnings update will be out this weekend, along with a preview of the financial sector earnings next week.
Thanks for reading.
Editor’s Note: The summary bullets for this article were chosen by Seeking Alpha editors.
Be the first to comment