

bluestocking/E+ via Getty Images
Legacy fund research would tell you now is the time to buy this Mid Cap Growth Fund. Think again. Our deep dive into the fund’s holdings reveal a portfolio that is inferior to its benchmark and the S&P 500, which makes future underperformance likely. DF Dent Midcap Growth Fund Investor Shares Inv (MUTF:DFDMX) is in the Danger Zone.
Forward-Looking Research Finds Very Unattractive Funds to Avoid
Our fund research differs from legacy fund research because it is forward-looking and based on fundamental, bottom-up research on each individual fund holding. Most legacy fund research is based on past price performance, making it backward-looking. By focusing on holdings, our Danger Zone fund picks routinely identify dangerous ETFs and mutual funds that receive high ratings from legacy research providers but go on to underperform their respective benchmarks.
Figure 1 shows the how different our forward-looking Fund Ratings are compared to Morningstar (MORN). We rate DFDMX as Very Unattractive (equivalent to Morningstar’s 1 Star), while Morningstar gives DFDMX a 4 Star rating. We also rate DFMLX and DFMGX Unattractive while those share classes get Morningstar’s 4 Star and 2 Star rating respectively.
Figure 1: DF Dent Midcap Growth Fund Ratings
DFDMX Ratings Vs. Morningstar (New Constructs, LLC)
Vague Methodology Leads to Poor Holdings
DF Dent Midcap Growth Fund’s investment methodology, as laid out in its fact sheet, attempts to identify stocks that “possess superior long-term growth characteristics and have strong, sustainable earnings prospects and reasonably valued stock prices.”
The fund’s prospectus provides a bit more detail behind the overarching goal of this methodology, but specific details, such as exact metrics used to identify stocks, are missing. For example, the prospectus notes that the fund adviser “uses fundamental research to identify companies” that it believes:
- are well managed,
- are leaders in an industry niche,
- have a track record of success, and/or
- exhibit sustainable growth.
We would generally applaud the use of fundamental research, but we’re left wondering what fundamental metrics the fund uses to pick stocks, as none are listed explicitly. Without further details, we can only judge the methodology by the quality of the stocks the fund holds. Such analysis reveals DFDMX’s methodology leads it to pick companies with lower returns on invested capital (ROIC), negative cash flows, and more expensive valuations than its benchmark and the S&P 500. More details below.
Holdings Research Reveals a Low “Quality” Portfolio
Our rigorous holdings analysis, leveraging our Robo-Analyst technology, reveals that DFDMX holds much lower-quality stocks than its benchmark, iShares Russell Mid-Cap Growth ETF (IWP) and the market, represented by State Street SPDR S&P 500 ETF (SPY).
Per Figure 2, DFDMX allocates 45% of its portfolio to Unattractive-or-worse rated stocks compared to just 35% for IWP. On the flip side, DFDMX’s exposure to Attractive-or-better rated stocks is much lower, at 9%, versus IWP at 20%.
Figure 2: DF Dent Midcap Growth Fund Allocates to Far Worse Stocks than IWP
DFDMX Allocation Vs. IWP (New Constructs, LLC)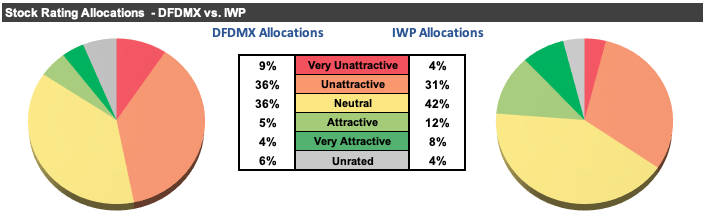
Our holdings analysis also reveals DFDMX’s portfolio is much lower quality than the S&P 500. Per Figure 3, at just 17% of its portfolio, SPY allocates significantly less to Unattractive-or-worse rated stocks than DFDMX. On the flip side, at 37% of its portfolio, SPY’s exposure to Attractive-or-better rated stocks is much higher than DFDMX’s.
Figure 3: DF Dent Midcap Growth Fund Allocates to Far Worse Stocks than SPY
DFDMX Allocation Vs. SPY (New Constructs, LLC)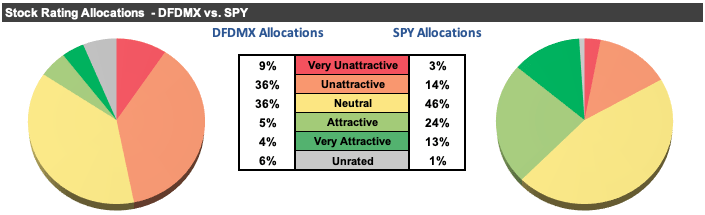
Given the unfavorable allocation to Attractive-or-better rated stocks relative to the benchmark and SPY, DFDMX appears poorly positioned to generate the outperformance required to justify higher fees.
Expensive Stocks Drive Very Unattractive Risk/Reward Rating
Figure 4 contains our detailed rating for DFDMX, which includes each of the criteria we use to rate all ETFs and mutual funds under coverage. These criteria are the same for our Stock Rating Methodology, because by definition the performance of a mutual fund is the performance of its holdings minus fees. DFDMX’s Very Unattractive rating is primarily driven by holding stocks with poor fundamentals and expensive valuations.
Figure 4: DF Dent Midcap Growth Fund Rating Details
DFDMX Rating Details Table (New Constructs, LLC)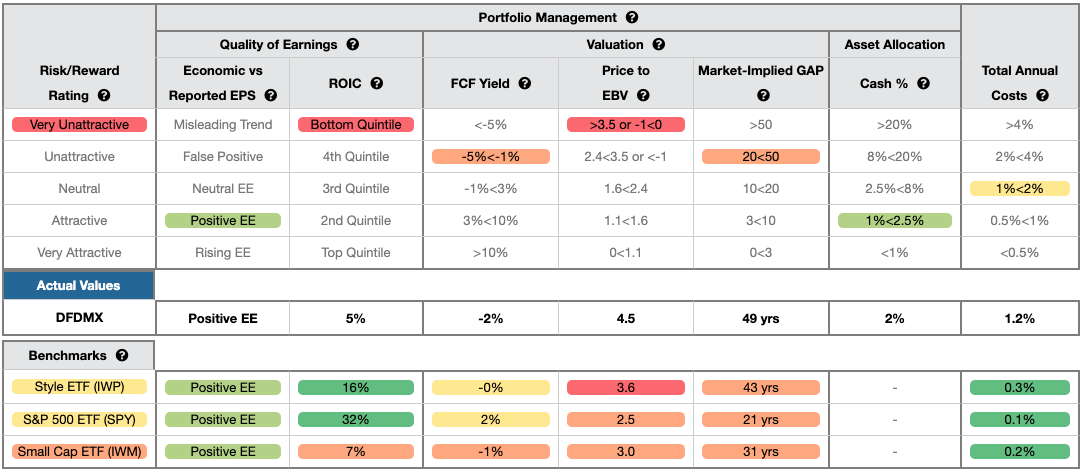
As Figure 4 shows, DFDMX is inferior to the iShares Russell Mid-Cap Growth ETF and SPY in four of the five criteria that make up our holdings/Portfolio Management analysis. Specifically:
- DFDMX’s ROIC is 5%, below the 16% IWP earns and the 32% SPY earns
- DFDMX’s free cash flow yield of -2% is lower than IWP’s at 0% and SPY’s at 2%
- the price-to-economic book value ratio for DFDMX is 4.5, which is greater than the 3.6 for IWP and 2.5 for SPY
- our discounted cash flow analysis reveals an average market implied growth appreciation period of 49 years for DFDMX’s holdings compared to 43 years for IWP and 21 years for SPY
The market expectations for DFDMX’s holdings are for profit growth (measured by PEBV ratio) that is over 4x higher than current profits and significantly more than the profit growth expectations embedded in IWP’s and SPY’s holdings, which are already more profitable.
Fees Only Make Owning DFDMX Worse
At 1.15%, DFDMX’s total annual costs are lower than many of the mutual funds we’ve put in the Danger Zone in the past. However, DFDMX’s TAC remain higher than 59% of the 323 Mid Cap Growth mutual funds under coverage. For comparison, the simple average TAC of all the Mid Cap Growth mutual funds under coverage is 1.59%, the asset-weighted average is 0.95%. IWP charges just 0.25%, and SPY has total annual costs of just 0.10%. Why pay higher fees for inferior stock selection?
Our TAC metric accounts for more than just the expense ratio. We consider the impact of front-end loads, back-end loads, redemption fees, and transaction costs. For example, DFDMX’s annual turnover ratio of 30% adds 0.06% to its total annual costs – which isn’t captured by the expense ratio. Figure 5 shows our breakdown of DFDMX’s total annual costs.
Figure 5: DF Dent Midcap Growth Fund’s Total Annual Costs Breakdown
DFDMX Total Annual Costs vs. IWP (New Constructs, LLC)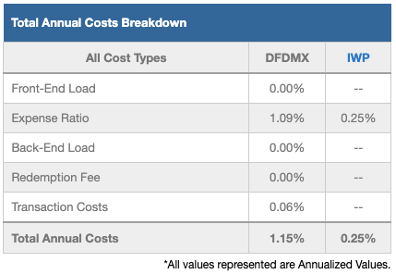
To justify its higher fees, DFDMX must outperform its benchmark by 0.90% annually over three years, the average holding period for all funds.
However, DFDMX’s 3-year quarter-end trailing annual return has underperformed IWP by 31 basis points. Its quarter-end trailing one-year return has underperformed IWP by 39 basis points.
Given that 45% of assets are allocated to stocks with Unattractive-or-worse ratings, and 81% are allocated to stocks with Neutral-or-worse ratings, DFDMX looks likely to continue to underperform including fees.
Get an Edge from Holdings-Based Fund Analysis Based on Superior Stock Research
Smart mutual fund (or ETF) investing means analyzing the each of the holdings of a fund. Failure to do so is a failure to perform proper due diligence. Simply buying an ETF or mutual fund based on past performance does not necessarily lead to outperformance. Only thorough holdings-based research can help determine if an ETF’s methodology leads managers to pick high-quality or low-quality stocks.
Most investors don’t realize they can access superior fundamental research that enables them to overcome inaccuracies, omissions, and biases in legacy fundamental research and data. Our Robo-Analyst technology analyzes the holdings of all 342 ETFs and mutual funds in the Mid Cap Growth style and ~7,700 ETFs and mutual funds under coverage to avoid “the danger within.”
Our diligence on holdings allows us to cut through the noise and identify potentially dangerous funds, like DF Dent Midcap Growth Fund, that traditional, backward-looking fund research overrates.
Easily Make Any Fund, Even DFDMX, Better
As we showed in The Paradigm Shift to Self-Directed Portfolio Construction, new technologies enable investors to create their own funds without any fees while also offering access to more sophisticated weighting methodologies. If, for instance, investors wanted exposure to DFDMX’s holdings, but weighted by Core Earnings, the risk/reward of this customized version of the fund improves significantly. This customized version allocates:
- 25% of assets to Attractive-or-better rated stocks (compared to 9% for DFDMX)
- 18% of assets to Unattractive-or-worse rated stocks (compared to 45% for DFDMX).
Compare the quality of stock allocation in our customized version of DFDMX vs. as-is DFDMX in Figure 6.
Figure 6: DF Dent Midcap Growth Fund Allocation Could Be Improved
DFDMX Allocation Vs. Custom Fund (New Constructs, LLC)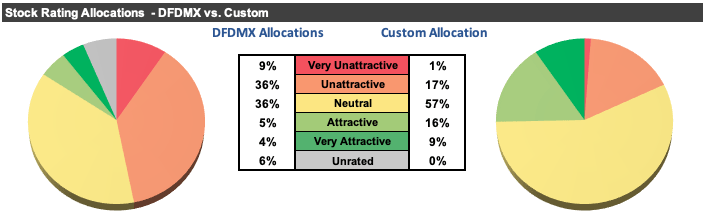
Better Rated Mid Cap Growth Funds
Below we present three Mid Cap Growth ETFs or mutual funds that earn an Attractive-or-better rating, have more than $100 million in assets under management, and have below average TAC.
- Barron’s 400 ETF (BFOR) – 0.72% TAC and Very Attractive rating
- Invesco Midcap Momentum EETF (XMMO) – 0.36% TAC and Attractive rating
- Commerce Funds MidCap Growth Fund (CFAGX) – 0.86% and Attractive rating
This article originally published on June 13, 2022.
Disclosure: David Trainer, Kyle Guske II, and Matt Shuler receive no compensation to write about any specific stock, sector, style, or theme.
Be the first to comment