

Автор
Overview & Data
Capital markets are now pretty uncertain, but there is an industry that has successfully resisted these negative times so far. It is the maritime transportation of LNG (Liquefied Natural Gas).
While the S&P 500 lost 15% since January 2022, the UP World LNG Shipping Index, which has been monitoring the sector’s development since 2020, gained over 46% in the same period. The following chart shows the development of both indices from January 2021.
Chart of the UP World LNG Shipping Index and S&P 500 index (UP-Indices.com)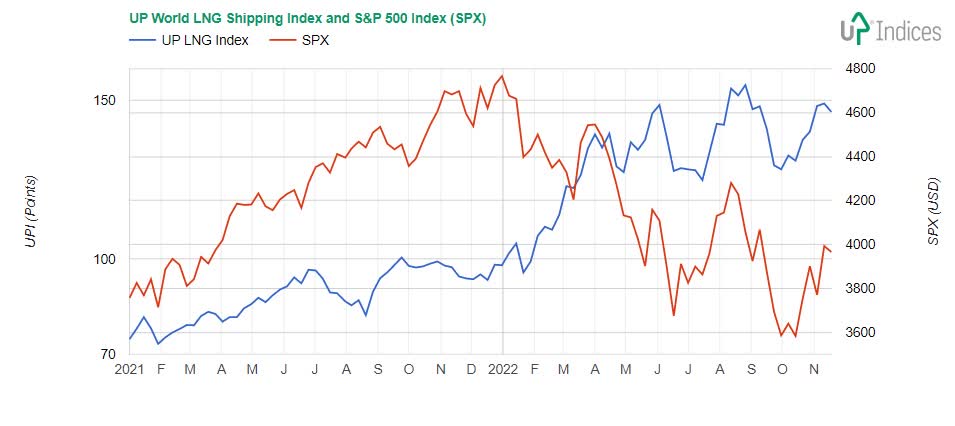
Fundamental is the dynamics of the development of both indices and the big change that occurred at the turn of the years 2021-2022. The S&P 500 index has since declined, while the UP index has gained significantly.
The UP Index includes 19 companies worldwide; ten companies and partnerships are listed on US markets. American markets are the most accessible to investors from around the world. However, geographic diversification of the UP Index is essential to the completeness of the LNG shipping sector’s overview and the global trend’s reliability. Asian countries like Japan, China, and South Korea are the leading importers of LNG. Qatar, Australia, and the USA are the primary producers of this commodity.
Overview of LNG shipping companies listed on US stock exchanges along with their weight in the UP World LNG Shipping Index:
|
Company / Partnership |
Ticker |
Weight |
|
FLEX LNG Ltd. |
(FLNG) |
16.34% |
|
Golar LNG Ltd. |
(GLNG) |
10.24 |
|
New Fortress Energy Inc. |
(NFE) |
8.17% |
|
GasLog Partners LP |
(GLOP) |
5.22% |
|
Chevron Corporation |
(CVX) |
4.49% |
|
Shell plc |
(SHEL) |
2.48% |
|
BP p.l.c. |
(BP) |
2.41% |
|
Excelerate Energy, Inc. |
(EE) |
1.99% |
|
Capital Product Partners LP |
(CPLP) |
1.95% |
|
Dynagas LNG Partners LP |
(DLNG) |
0.92% |
U.S. listed constituents of the UP World LNG Shipping Index (weight to October 28, 2022)
The future evolution of all investment asset classes is currently a big topic. We may be at the turning point of individual asset cycles: stocks, bonds, properties, or commodities. Moves in natural gas prices are essential for the LNG shipping sector.
The following chart compares the development of the UP World LNG Shipping Index, the S&P 500 index, and the price of US natural gas from Henry Hub. On the chart, we again notice the opposite development of the UP index compared to the SPX. This is due to the increased demand for LNG, with which Europe is trying to solve the stoppage of Russian gas pipelines. And, of course, the worldwide cyclical growth in demand for NG / LNG before the winter heating season. After all, we can see that the gas prices rose too, but not as stably. A support line is marked on the chart, from which the UP Index bounced for the third time. This is important: while the SPX is falling, the UP index rebounds from support. So it is in better shape than SPX.
Chart of the UP World LNG Shipping Index, S&P 500 index and Natural Gas (UP-Indices.com)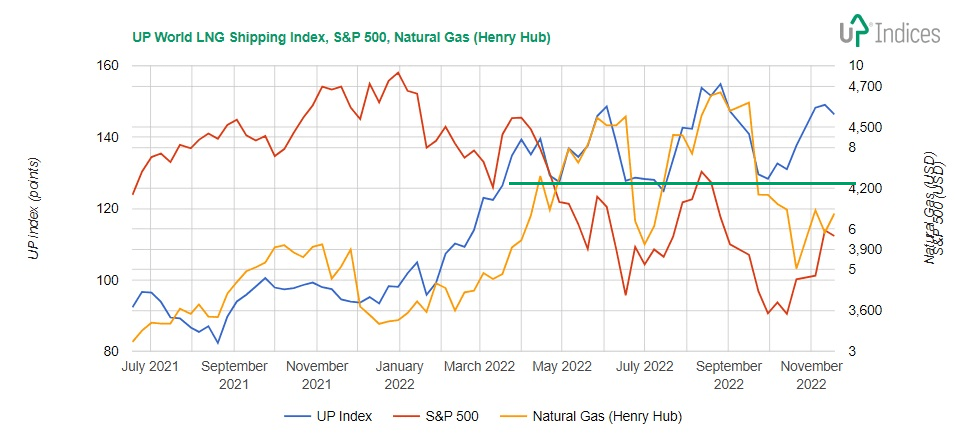
Conclusion #1
This leads me to conclude that if the SPX increases, the UP Index will gain more. And if SPX sees weakness, UP Index will go sideways.
Factors working in favor of LNG shipping companies:
+ Increase in demand for natural gas, especially from Europe
+ Increase in the need for NG/LNG due to the start of the winter heating season
Timing
These factors will work till the spring, and then the second quartal is the weakness season for LNG. In summer, demand for natural gas / LNG starts again. Last year, the Russian invasion of Ukraine pushed demand up from spring, as in the previous text. Next year the situation will be similar as Europe has to rely on LNG only. This will keep the LNG shipping sector strong.
Conclusion #2
European demand for LNG will keep the sector strong.
LNG shipping
Maritime routes are mainly used to transport LNG. But the number of tankers is limited. The vast majority of ships are contracted on a long-term basis. A decrease in the number of free vessels and an increase in demand leads to higher rates for long-term and short-term charters.
From this point of view, it is logical that LNG shipping stocks are experiencing strong growth despite the decline of other stocks. However, no trend runs without interruptions and short corrections. That’s why it’s a good idea to follow technical analysis tools. Basic trend indicators include Bollinger Bands.
Chart of the Bollinger Bands of the UP World LNG Shipping Index (UP-Indices.com)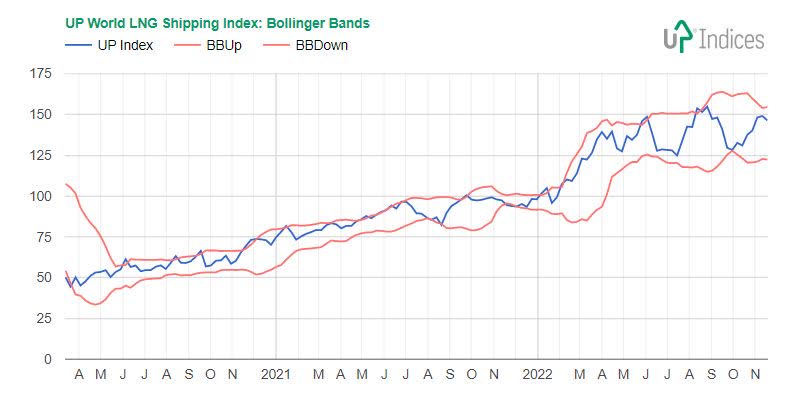
This shows the Bollinger Bands of the UP World LNG Shipping Index. Here again, we see an important rebound from support and growth to the upper band. At the same time, however, the UP Index approached the upper band. There is also a possibility of a technical pattern called Head and Shoulders. All this means that the UP Index should decline.
Conclusion #3
The UP Index may soon undergo a correction that can be used for buying.
How to profit from this decline?
Which companies have the greatest growth potential? I prefer companies and partnerships that have solid and predictable cash flows. I use option writing very often.
Flex LNG
This company is dually registered in Oslo and New York. I already covered FLNG in an article for Seeking Alpha before the IPO at NYSE. Since then, it has expanded its ultra-modern fleet to 13 LNG tankers. The company has sensibly changed variable rates to long-term. From the current point of view, it may seem a bit early to do this, but this step brings a decent long-term cash flow with a high possibility of a stable dividend. Stability and predictability are essential in maritime transport as you are a minority shareholder, but they eliminate only some risks. A significant advantage for me is that there are already options on FLNG shares. A one-month covered call is a great source of additional income.
Fixture of the FLNG vessels (Flex LNG Ltd. (Q2-22 presentation))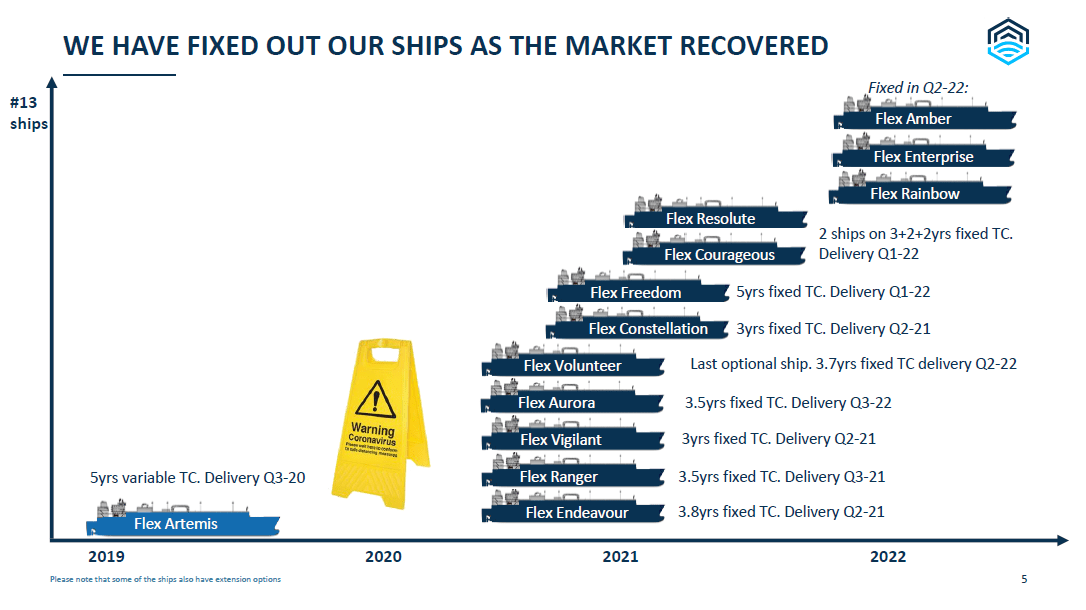
The length of the contracts is not less important. In the long term, several-year contracts are concluded at around $80,000 per day; the latest data show five-year growth rates above $100,000 per day. The increase in short-term (usually one-month) contracts to more than $500,000 per day resonates in the media. But they are not sustainable in the long term.
The capacity of shipyards for producing new LNG tankers was already reserved two years ago by Qatar Energy, which is gradually concluding contracts with other carriers. The primary wave of newly built ships will start arriving in 2024, so there is currently a shortage of free boats on the market. Nevertheless, from the investor’s point of view, long-term fixation on a profitable price is advantageous. The following chart shows the length of FLNG contracts.
Table of contracts od FLNG vessels (Flex LNG Ltd. (Q3-22 presentation))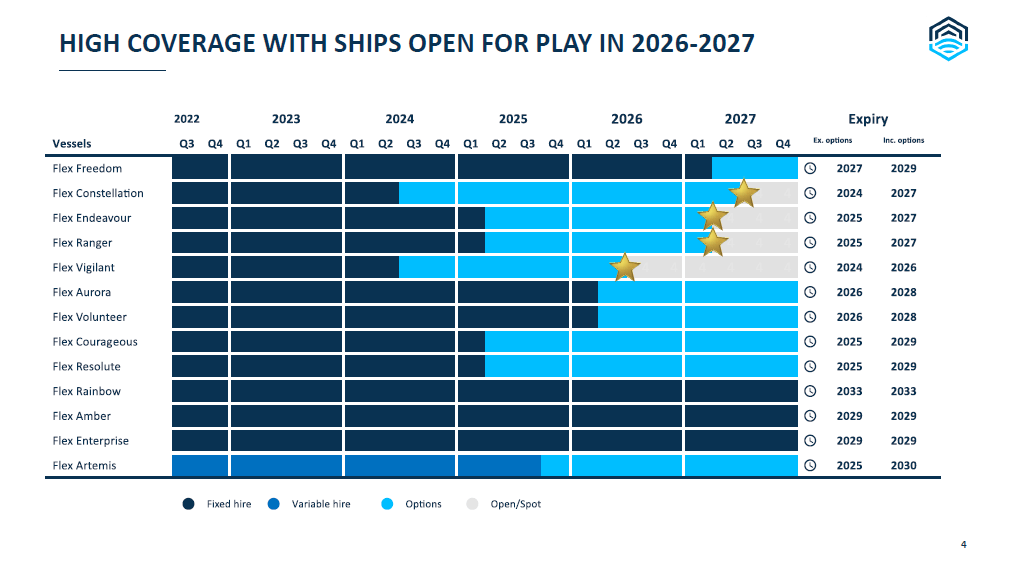
Excelerate Energy
Among my favorites is Excelerate Energy, listed on NYSE since April 2022. It focuses on floating LNG regasification terminals (FSRU). It owns 10 FSRUs in total; one is under construction, with delivery in 2026. In Europe, after the Russian aggression, Excelerate Energy immediately concluded two new contracts in Germany and Finland. However, FSRU charters are “only” around 17% of all revenues; the rest comes from gas sales in Brazil (Bahia LNG), as shown in an excerpt from November’s 10-Q filing:
Excelerate Energy Q3-22 Revenues (Excelerate Energy, Inc. (SEC filling))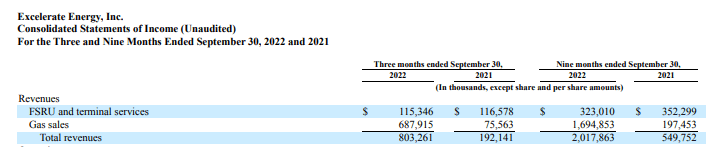
FSRU of Excelerate Energy covers the whole world. The length of the contracts in the case of the FSRU is easily twenty years, which means stable and predictable cash flow. The new German contract is concluded for a five-year term. There, however, the construction of a land-based (offshore) regasification terminal is planned, for which LNG is only an intermediate solution and hydrogen is the future commodity.
Excelerate Energy around the World (Excelerate Energy, Inc. (Q2-22 presentation))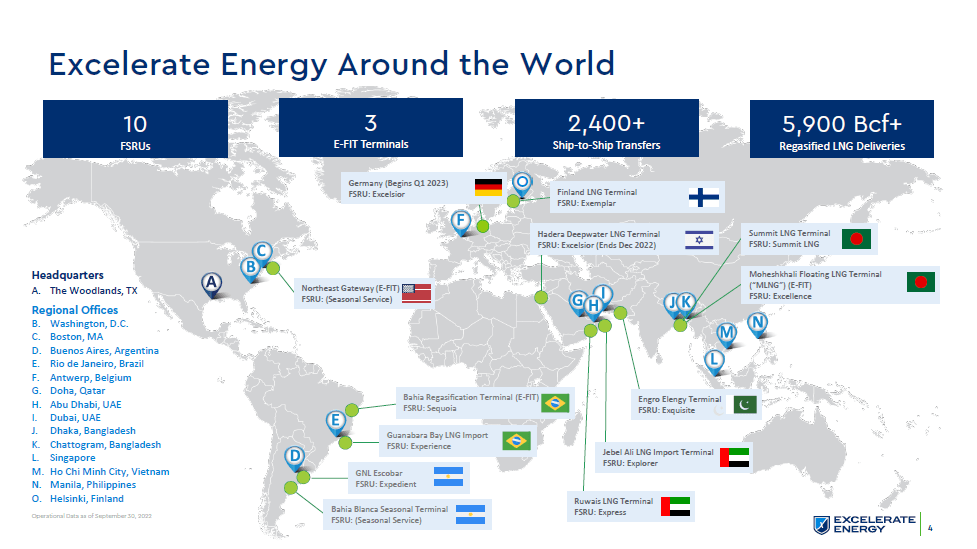
Summary
In this article, I show two companies listed on US markets that offer massive potential for investors. The LNG sector, particularly LNG shipping, is experiencing a well-deserved boom. Driven by the demand for a safe supply of natural gas, it is likely that the development will continue to be more stable than the other sectors.
Be the first to comment