

travelism/iStock via Getty Images
Today we will be discussing yet another dividend ETF with a note on the Legg Mason Low Volatility High Dividend ETF (NASDAQ:LVHD), a passively managed fund focusing on generous U.S. dividend payers exhibiting low volatility and quality characteristics.
Unfortunately, though with a few substantial advantages like the robust profitability of its holdings, LVHD is a suboptimal choice for dividend investors; the reasons for skepticism are discussed in greater depth in the article.
Investment strategy
The QS Low Volatility High Dividend Index lies at the crux of the fund’s investment strategy.
According to the factsheet, its methodology was developed by Franklin Templeton Investment Solutions. In short, the index is supposed to encompass the resilient profitable U.S. dividend payers that are capable of delivering relatively sizeable yields together with “lower price and earnings volatility.” Another way of saying, what we see here is a mix of value, low-volatility, and quality strategies.
The selection pool consists of the constituents of the Solactive US Broad Market Index which encompasses approximately 3,000 players. There are no specific market-cap preferences, so all the three echelons of the equity market are represented in the fund’s portfolio, though with a remarkable tilt towards the upper one in the current iteration.
As a quality filter, the index uses profits, a rather basic though efficient way to remove value and yield traps in step one. Profits must be delivered “over the last four fiscal quarters as a whole.” Below, we will be discussing if this rule secured the high quality of the LVHD portfolio or not.
Another ingredient is a proprietary composite “stable yield” score. Unfortunately, there are just scant details on the score in the prospectus. It is only mentioned that stocks with more volatile prices and unstable earnings have their yields reduced, while those with more stable prices and earnings get a boost.
There are a few caps, namely a 2.5% single constituent cap and a 25% sector limit; besides, REITs are capped at 15%. The index follows an annual reconstitution and quarterly rebalancing schedule.
A deeper delve into the portfolio
As of March 22, the fund had a portfolio of 89 equities, with the top ten accounting for ~26%. ~2.4% yielding Lockheed Martin (LMT) which has been on a tear this year is its top investment, with a weight approaching 3%. Upon quarterly rebalancing, its weight will be adjusted down inevitably, in line with a 2.5% cap.
LVHD favors large- and mega-caps that together had an over 89% weight. Small-caps like Ellington Financial (EFC) had a minuscule share of the net assets, just below 1%. With its ~$465 billion market cap, ~2.4% yielding Johnson & Johnson (JNJ) is the largest company in the mix. Overall, the fund’s tilt towards the upper echelon bodes well for quality but ill for value; this is something investors seeking cheaper high-yield portfolios should pay attention to.
As of the end of February, the sectors with most of the net assets were consumer staples (over 24%), utilities (slightly above 16%), and industrials (~15.1%). The presence of the two defensive sectors in the top trio is barely surprising since stocks from both typically trade without excessive volatility. At the same time, we see measly exposure to materials (sub-1%) and no allocation to energy, at all. Again, this looks consistent with the fund strategy that does not tolerate earnings volatility, let alone losses, as unstable profits are inherent to the oil & gas industry. Chemical companies, miners, etc., also have that problem.
Factor exposure
~35% of the stocks in LVHD’s ~$720 million portfolio sport value characteristics, with the Quant Value grades of at least B-. This is not a perfect level for a fund focusing on a high-yield factor, though more or less adequate. At the same time, we expectedly see only small exposure to the growth factor, just ~16%.
Since we are discussing a dividend-oriented portfolio, quality is what should be taken seriously. Thankfully, the LVHD portfolio is solidly built. First, the share of stocks with at least B- Quant Profitability grades approaches 90%. Over 70% are in the A league. The table below shows those with the highest ratings.
Created by the author using data from Seeking Alpha and the fund. Holdings as of March 22, Quant data as of March 27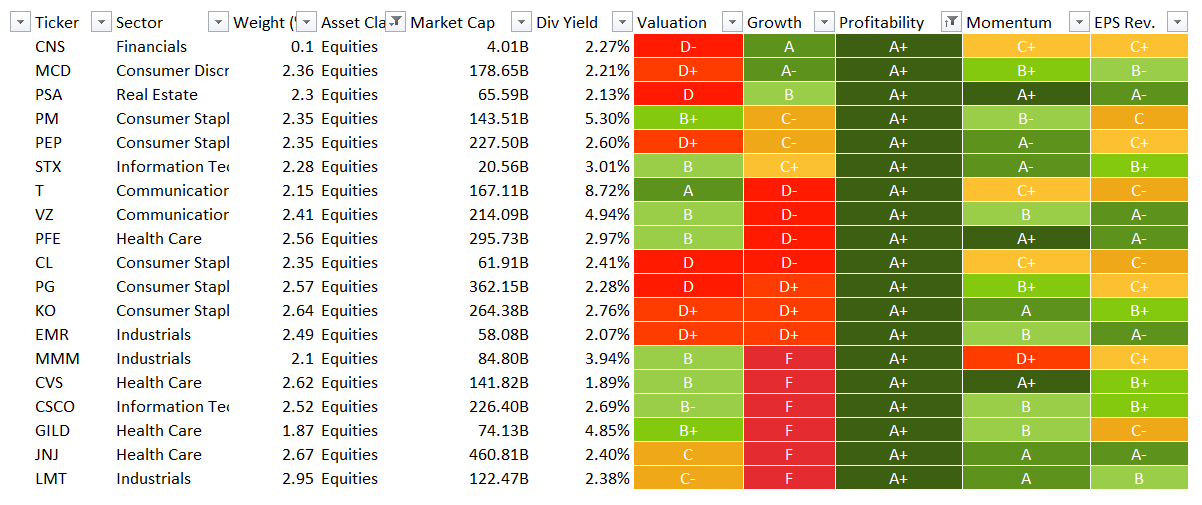
Second, using the profitability data I downloaded from the screener, I found just one loss-making company, Piedmont Office Realty Trust (PDM). PDM has just ~0.1% weight in the portfolio. Overall, I am content with the quality of LVHD’s high-yield equity mix.
Dividend credentials
What do LVHD investors get in terms of yields and dividend growth? The scatter plot below is supposed to answer that question briefly.
Created by the author using data from Seeking Alpha and the fund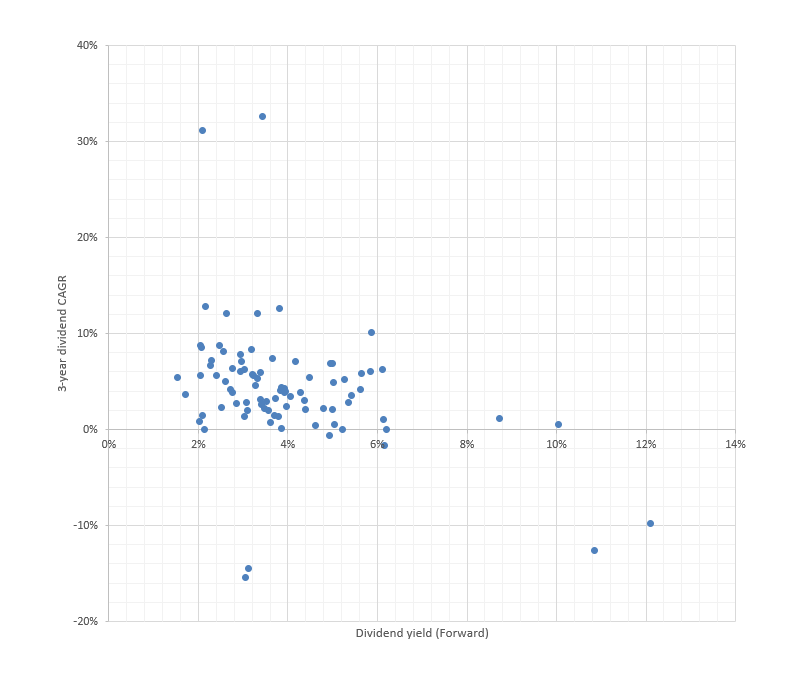
We see that most players have yields between 2% and 6% and 3-year dividend compound annual growth rates below 10%. Just a few outliers have delivered record CAGRs, like Evergy (EVRG) with its 32.6% rate. We also see names that cut their dividends, including AGNC.
It should be noted that the presence of The GEO Group (GEO) is a bit odd since the company suspended the dividend last year.
The ETF itself is currently yielding just around 2.6%. Unfortunately, it does not have a consistent distributions growth story. Its most recent distribution of ~$0.08 is one of the lowest since inception; LVHD paid less than that only twice, in February 2020 and February 2021, and a similar amount (~$0.77) in August 2019. Besides, its 3-year CAGR is (1.75)%. That said, for now, it does not appeal to dividend growth investors.
Performance analysis
The table below delivers a clear message: LVHD is a solid low-volatility (see the standard deviation) ETF but with no alpha potential.
Incepted in December 2015, it generated just a 10.8% CAGR during the January 2016 – February 2022 period, failing to keep pace with the iShares Core S&P 500 ETF (IVV), while also performing slightly weaker than its peer SPDR Portfolio S&P 500 High Dividend ETF (SPYD), a solid high-yield exchange-traded fund I previously covered in October 2021; I see LVHD’s higher fees (27 bps vs. 7 bps) as a likely culprit of this minor underperformance.
Created by the author using data from Portfolio Visualizer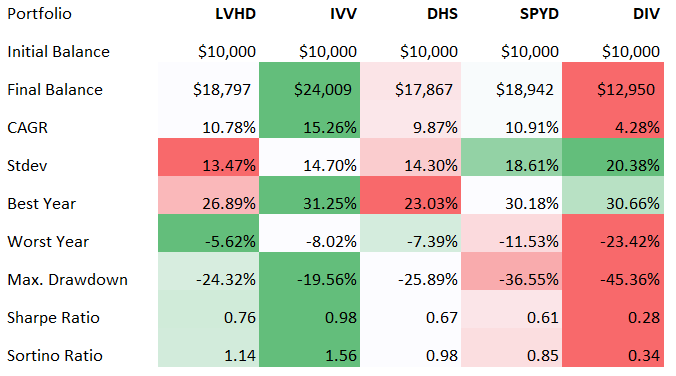
Still, LVHD did a bit better than the WisdomTree U.S. High Dividend Fund (DHS) and grossly outperformed the Global X SuperDividend U.S. ETF (DIV), another high-yield low volatility fund.
DIV’s returns are merely lackluster, the standard deviation is the highest, while the Sharpe, Sortino ratios are the lowest. In the article from March 2021, I criticized it for its obsession with beta (for the index constituents, it must be below or equal to 0.85) which results in thorough portfolio recalibrations every year and subpar returns. And by the way, my opinion has not changed since then; I am still skeptical of this ETF.
Final thoughts
The verdict? Certainly, I like the close to excellent quality of the fund’s portfolio. For a high-yield fund (hence, with inevitably small exposure to the growth factor), its returns were also rather strong, though certainly with no alpha. Market-beating performance is clearly not to be expected in the long term, with the low-volatility factor reducing its potential to outpace the S&P 500.
But there are a few issues worthy of concern. First, the 2.6% yield is anything but high, especially when interest rates in the U.S. are creeping higher. Second, its dividend growth story lacks consistency. All in all, LVHD is a Hold at best.
Be the first to comment