

AlbertPego
Thesis
mREIT investors have been feeling the heat as the Fed maintained its hawkish stance at Jackson Hole, despite a lowered CPI reading in July, showing an 8.5% YoY rise, down from 9.1% in June. However, jobs growth remained robust, even though the underlying strength has wavered somewhat. Bloomberg highlighted in a recent commentary that fewer industries are lifting the labor market demand, suggesting cracks are appearing under the hood in August’s jobs report. It articulated:
But the government’s diffusion index shows that a smaller proportion of industries are carrying the monthly gains. At 62% of industries gaining, the diffusion index fell to the lowest since January 2021. – Bloomberg
Despite that, Annaly Capital Management, Inc. (NYSE:NLY) stock has pulled back from its August highs, down nearly 9%. Notwithstanding, it remains well above its June lows, as NLY attracted robust buying support.
Our analysis suggests that Annaly’s declining book value per share (BVPS) could reach a bottom in Q2, but its adjusted EPS could come under pressure. Despite that, Annaly’s dividends are not at risk, given reasonable payout ratios, but could decline through FY23, lending to further headwinds.
Therefore, we believe investors need to assess whether the market has priced in Annaly’s headwinds into its June bottom, given the Fed’s hawkish stance, amid a high inflationary environment and a looming recession. The culmination of headwinds has not been helpful for investors, coupled with heightened volatility in the broad market.
NLY also seems to be in a secular downtrend over the past few years. Despite its bottom in June, we deduce investors need to observe whether the current pullback can form a higher base, suggesting NLY could reverse its bearish momentum. However, we caution that NLY’s valuation is not constructive, given its markedly falling book value trend.
Therefore, we urge some caution at the current levels and rate NLY as a Hold for now.
Annaly’s Book Value Per Share Decline Could Have Bottomed
Annaly adjusted EPS change % and BVPS change % consensus estimates (S&P Cap IQ)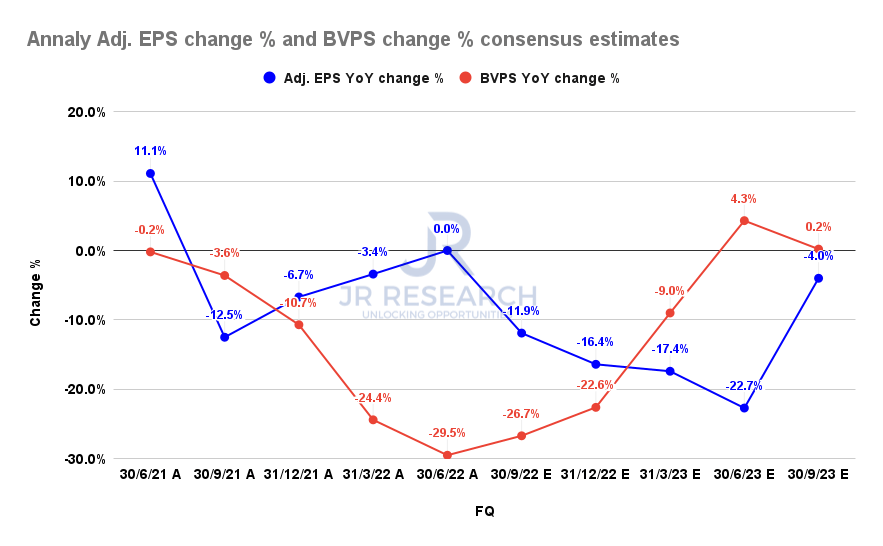
The downturn in the equity market, coupled with the volatility seen in its underlying assets, has battered Annaly’s BVPS. But, none of it is surprising, given the Fed’s hawkish stance, with the market raising its expectations of another 75 bps hike (64% probability as of September 6) in the upcoming September FOMC meeting.
However, the consensus estimates (neutral) indicate that Annaly’s BVPS decline could have bottomed out in Q2, as it fell 29.5% YoY, down from Q1’s 24.4% decline.
US10Y yields price chart (TradingView)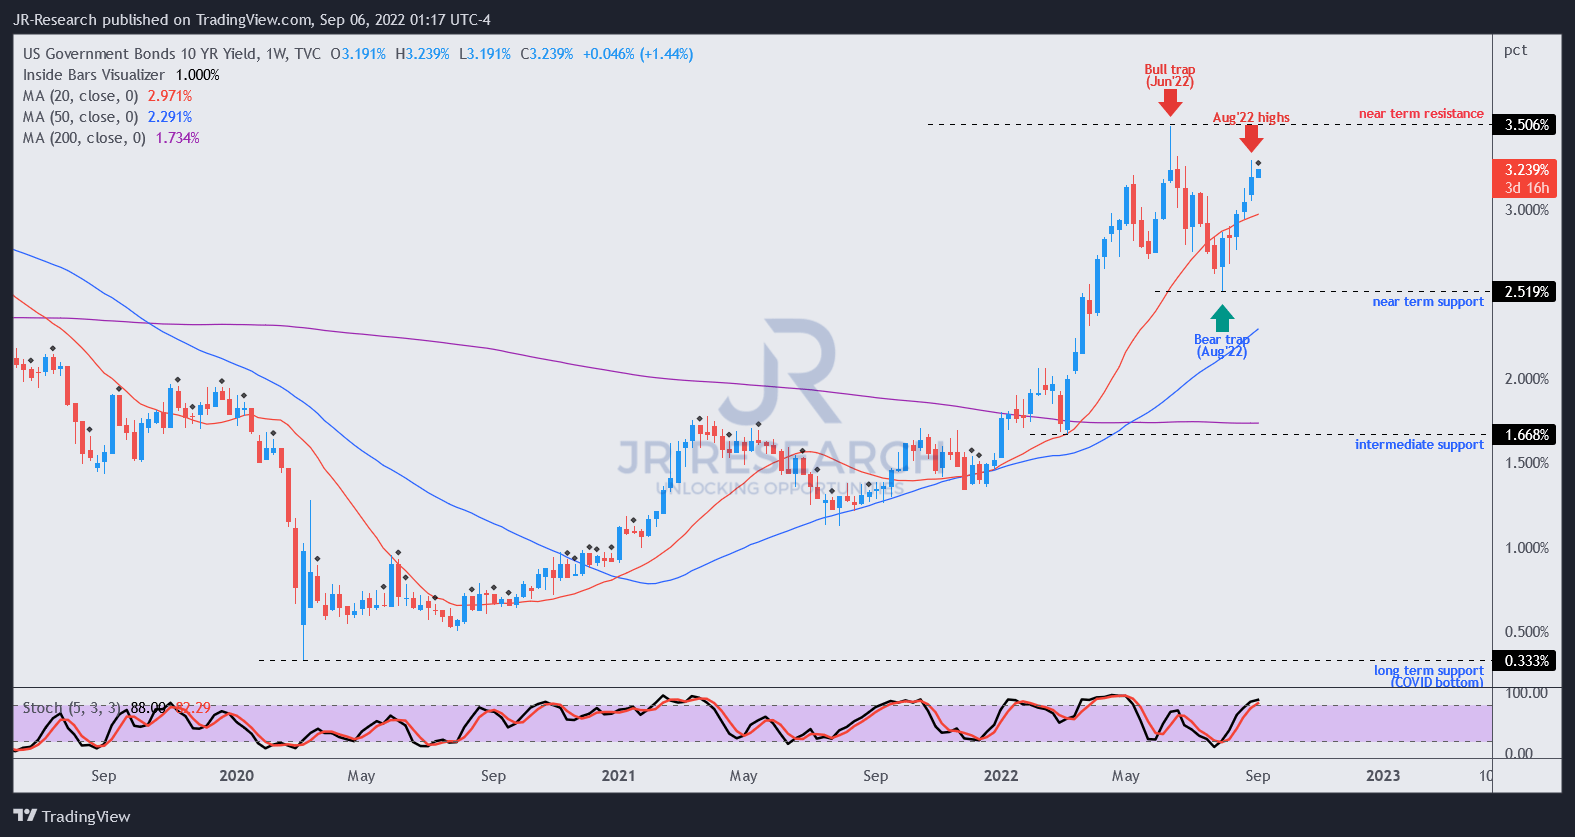
A glance over the price action in the US 10Y government bonds suggests that the buying momentum remains well below June’s high, despite the Fed’s hawkish commentary at Jackson Hole. Therefore, we surmise that the market could still be pricing a less hawkish Fed moving forward, alleviating the headwinds on Annaly’s BVPS growth.
US 10Y2Y yield curve % (koyfin)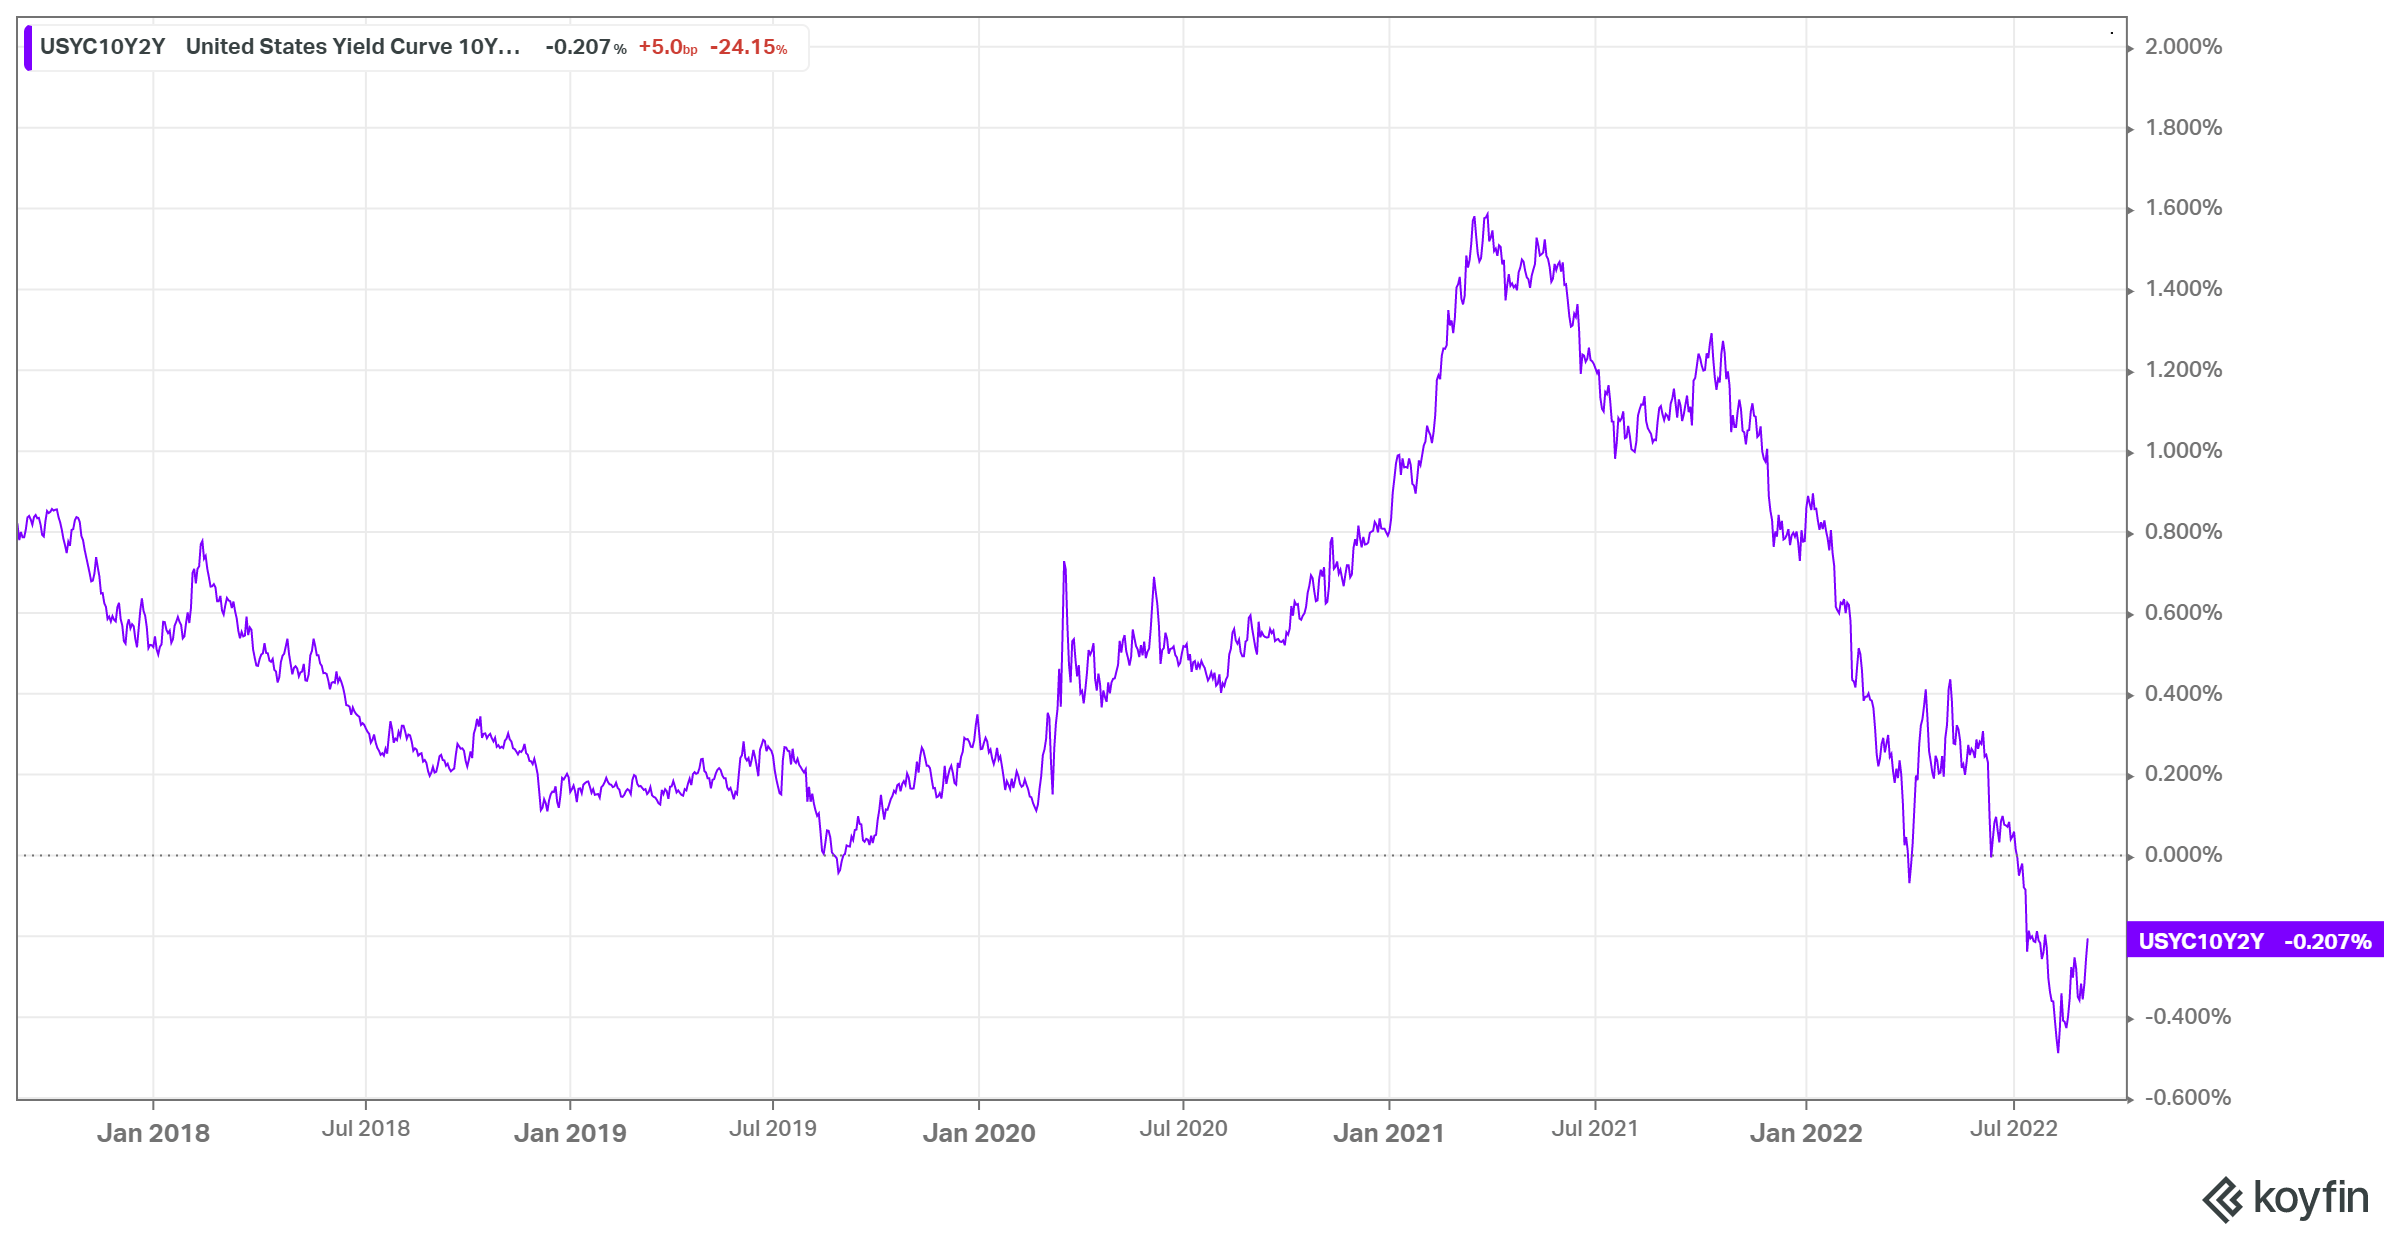
Furthermore, the yield curve inversion in the 10Y and 2Y yields appeared to have bottomed out in June and seemed to be creeping up. Therefore, if the bottom in June continues to hold robustly, we are confident that the consensus estimates seem credible.
Annaly dividend per share $ and dividend yield % consensus estimates (S&P Cap IQ)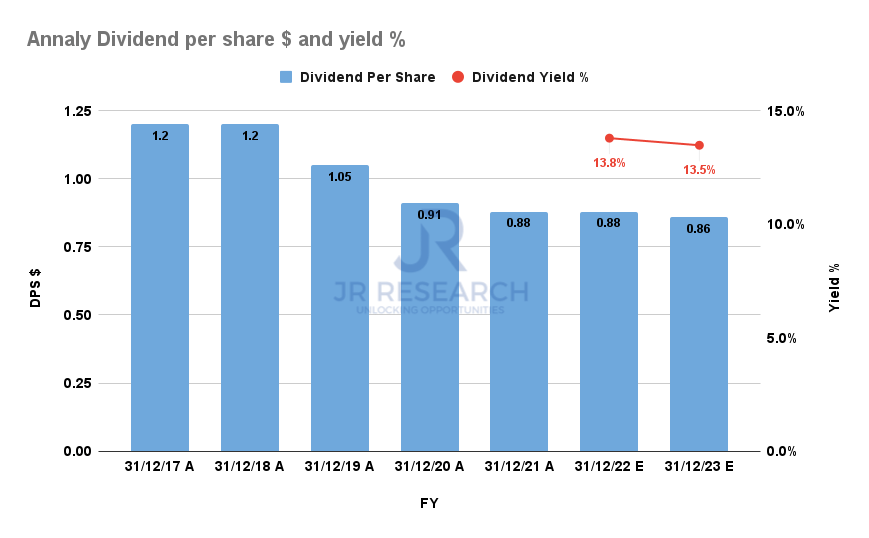
Notwithstanding, Annaly expects to face headwinds on its adjusted EPS moving forward as its growth moderates. Therefore, investors need to parse management’s commentary on its dividend per share, projected to fall through FY23, putting pressure on its dividend yields, as seen above. Hence, the tailwinds from the bottoming of its BVPS decline could be counteracted by the headwinds from its adjusted EPS growth moderation, complicating the market’s assessment of its valuation.
And, Annaly’s P/TBV Is Worrying
NLY TTM P/TBV valuation trend (koyfin)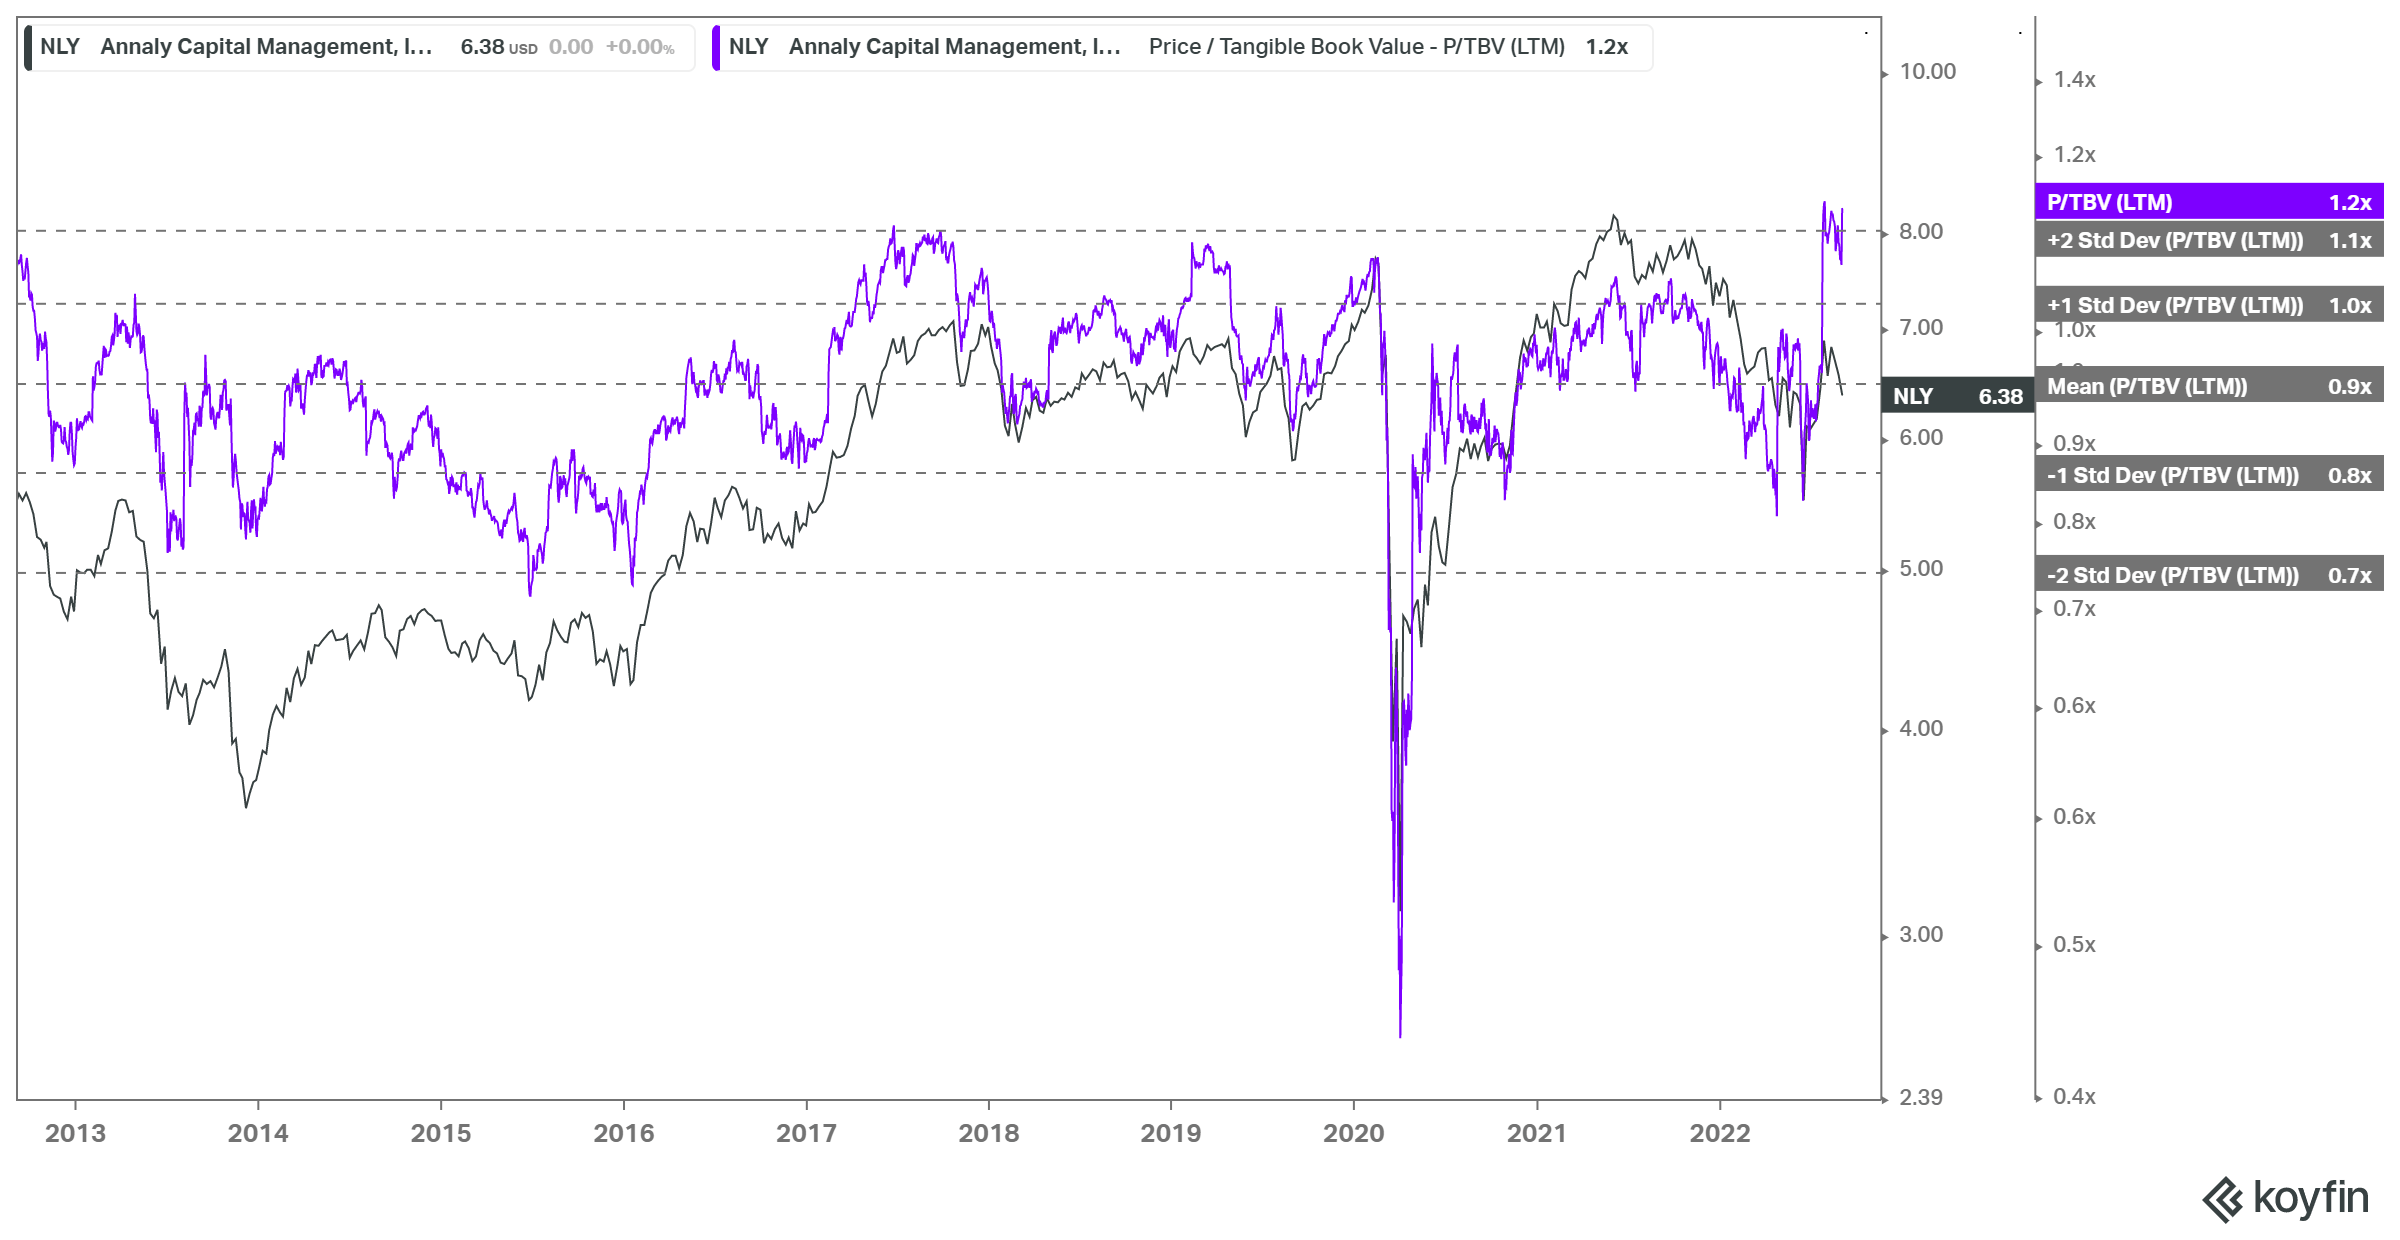
As seen above, NLY’s buying momentum has been robustly supported above the two standard deviation zone below the 10Y mean of its TTM P/TBV multiple. Moreover, NLY had also come under pressure when its valuation reached the two standard deviation zone above its 10Y mean, as seen at its August highs.
Therefore, we believe investors need to be cautious as NLY’s book value per share is not expected to recover markedly through FY23, even though its decline should normalize.
Is NLY Stock A Buy, Sell, Or Hold?
NLY price chart (weekly) (TradingView)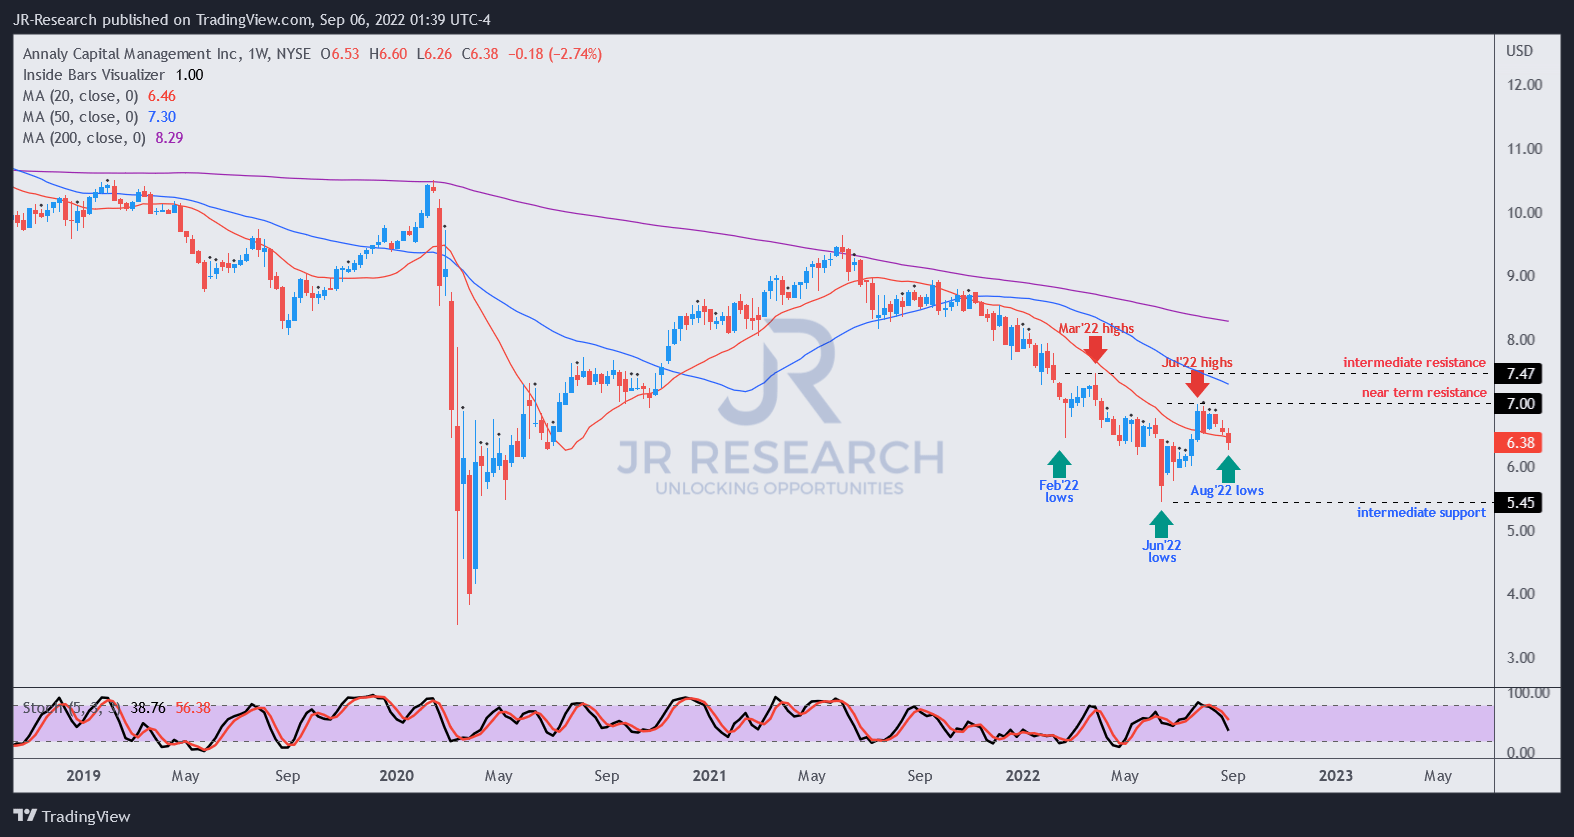
Investors should note that NLY remains in a medium-term downtrend, corroborating its broader long-term downtrend framework. Hence, the bearish bias in NLY is still dominant, and buying the dips is a counter-trend strategy. Therefore, investors need to be cautious in selecting their entry points, given its bearish momentum.
As seen above, NLY’s buying upside was rejected at its August highs as it attempted to break out of its downward momentum. Therefore, we urge investors to be patient and parse whether NLY could re-test its June lows or it could form a base above it.
Given the bifurcation in the trend of its underlying metrics, we believe it’s appropriate to be patient here. Therefore, we rate NLY as a Hold for now.
Be the first to comment