


nazar_ab/E+ via Getty Images
Fundamentally speaking, one of the most attractive and rapidly growing automotive retailers in the US is Lithia Motors (NYSE:LAD). The company demonstrates as much from quarter to quarter, with data available from the first quarter of its 2022 fiscal year showing that growth remains intact. While it is true that some of the company’s recent profitability may not be replicable for the long haul, shares would be, at worst, fairly valued. But in the event the management can continue to generate attractive cash flows and increased sales, the company looks to be rather cheap. So at the end of the day, what we have here is a firm that is a favorable risk to reward prospect for long-term, value-oriented investors.
Lithia Motors’ business keeps driving forward
The last time I wrote an article about Lithia Motors was in February of this year. To be precise, it was February 1st. At that time, I mentioned that the company’s shares were favorable at current pricing. I recognized the attractive growth that the firm had seen, even saying that that growth was continuing for the foreseeable future. In the worst case, I saw the company perhaps reverting back to the same kind of performance it would have achieved in prior years. And if that were to come to pass, I could not imagine it being any worse off than being fairly valued. But ultimately, the current market conditions and the current pricing of the stock led me to rate the company a ‘buy’ prospect. Since then, things have gone quite well for the enterprise. While the S&P 500 has seen a drop of 1.9%, shares of Lithia Motors have generated a return of 3.9%.
Author – SEC EDGAR Data
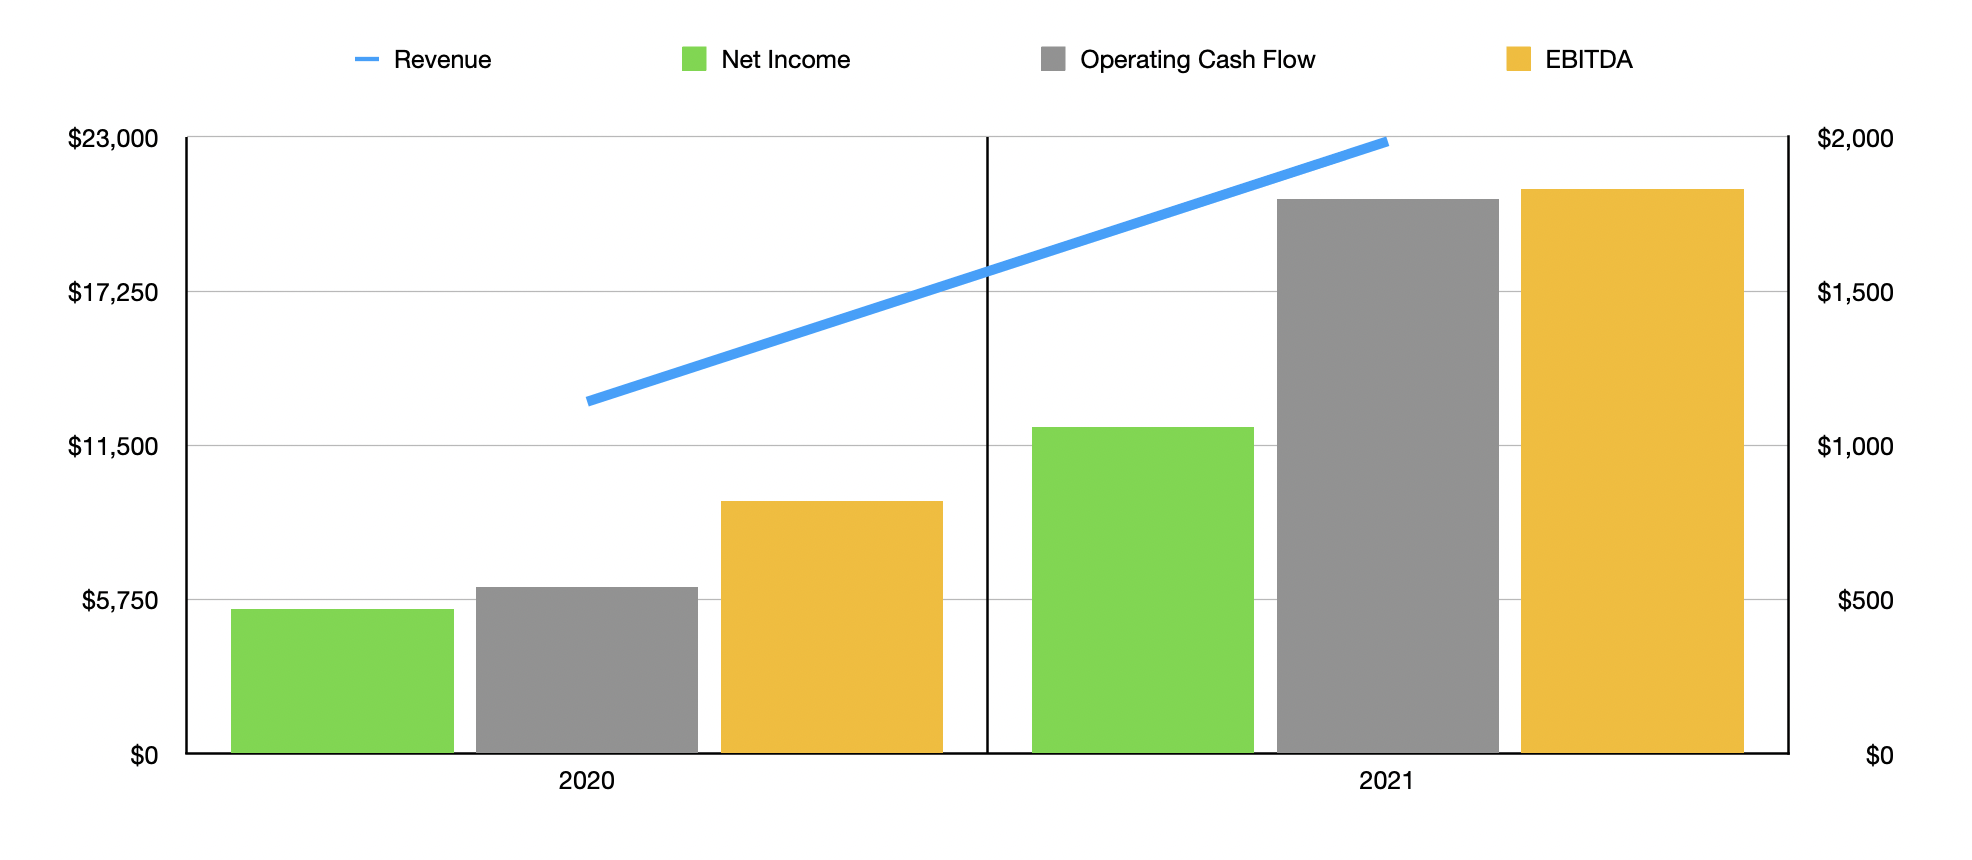
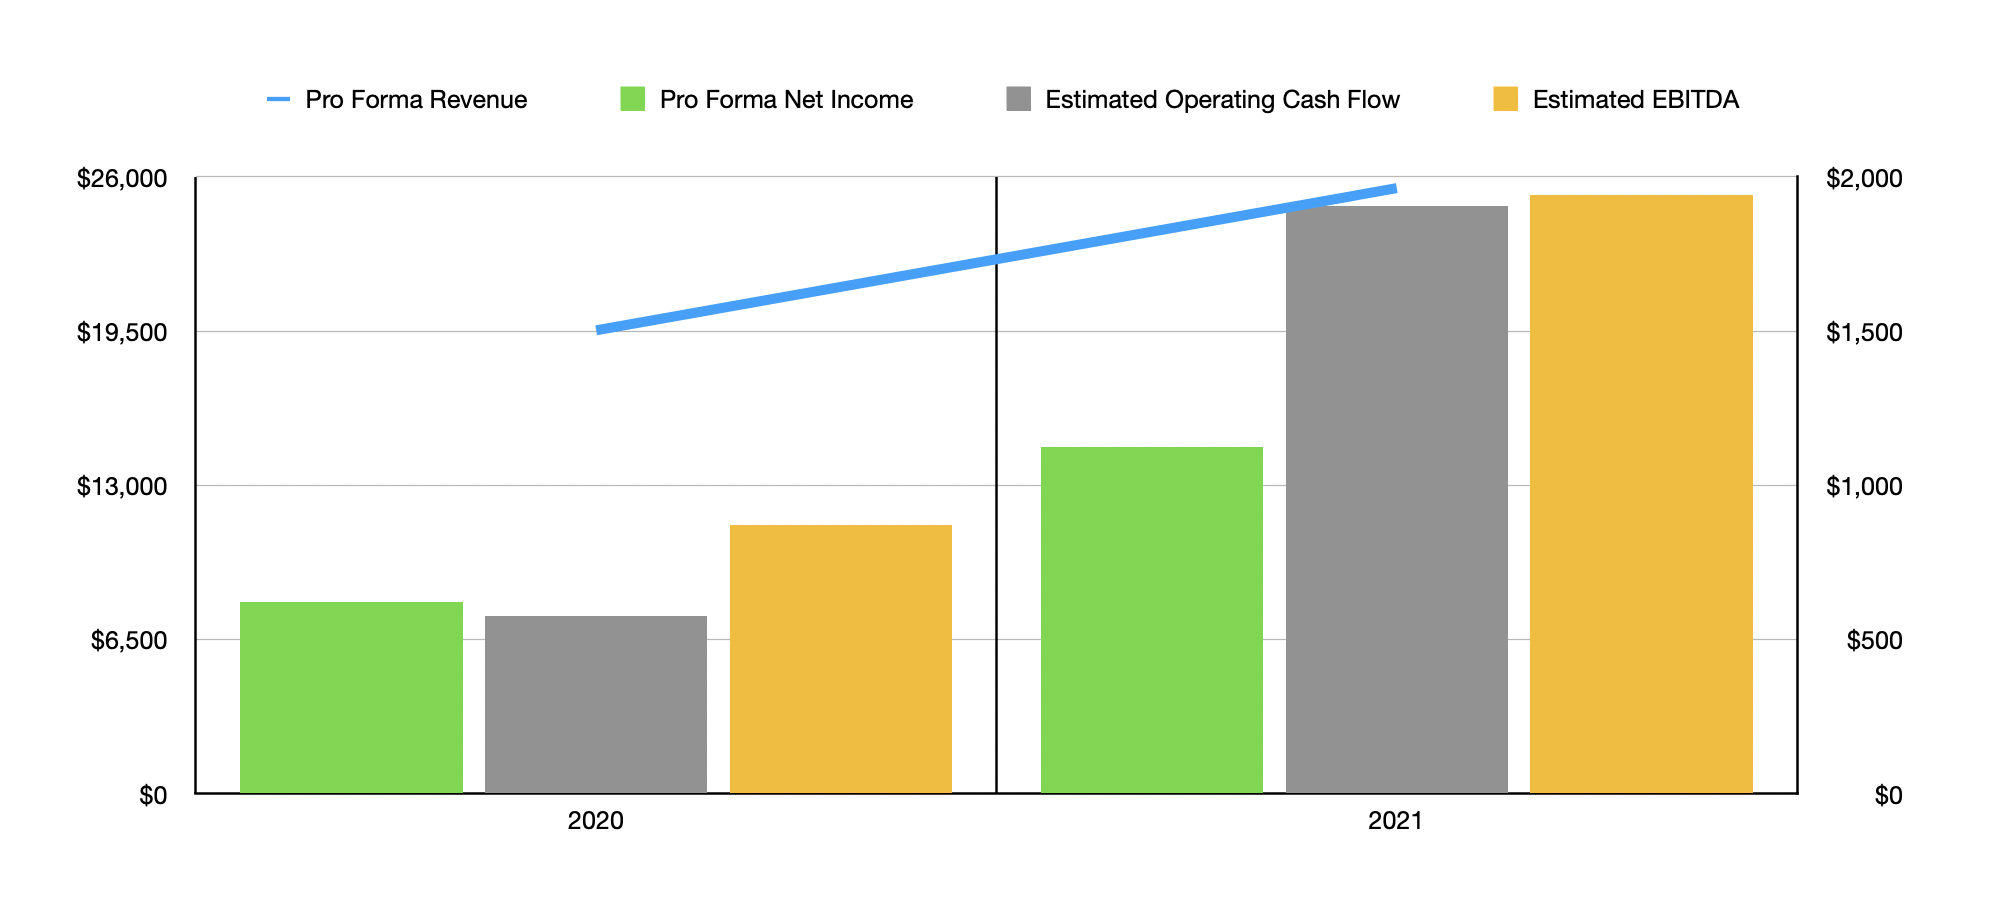
This return disparity was not without cause. Only a few days after my aforementioned article on the business, management reported financial results covering the final quarter of the company’s 2021 fiscal year. As a result of strong performance throughout the year, total revenue for 2021 totaled $22.83 billion. That compared to the $13.12 billion the company generated just one year earlier. There were multiple drivers behind this increase, including favorable pricing and an increase in the number of units, or vehicles, sold. For instance, for all of 2021, on a same-store basis, the company saw an additional 3.8% of vehicles sold through its new vehicle retail unit. The year-over-year increase for the used vehicle retail unit was an even more impressive 16.1%. For new vehicles, pricing jumped by 9.7%, while used vehicle retail pricing rose by 20.6%. However, a very significant factor for the company’s top line involved the acquisitions management embarked on during the year. If, instead, the company had made all of its four mentioned acquisitions during the 2020 and 2021 fiscal years at the start of 2020, sales for 2020 would have been $19.53 billion. For 2021, sales would have been $25.52 billion.
Author – SEC EDGAR Data
All of this has also had a positive impact on the company’s bottom line. Net profits came in at $1.06 billion. That’s more than double the $470.3 million generated one year earlier. According to management, operating cash flow for the business expanded from $542.2 million in 2020 to $1.80 billion in 2021. Another important profitability metric to consider is EBITDA. Based on the data provided, this came in at $1.83 billion during 2021. That compares to the $820.6 million reported one year earlier. On a pro forma basis, which factors in the accelerated acquisition scenario I already covered for revenue, net income would have been $621.4 million in 2020 and $1.12 billion in 2021. No such estimates were provided for the operating cash flow and EBITDA figures for the company. But if we assume that those would have increased at the same rate that net profits did, then operating cash flow would have grown from $574.9 million to $1.91 billion, while EBITDA would have expanded from $870.1 million to $1.94 billion.
Author – SEC EDGAR Data
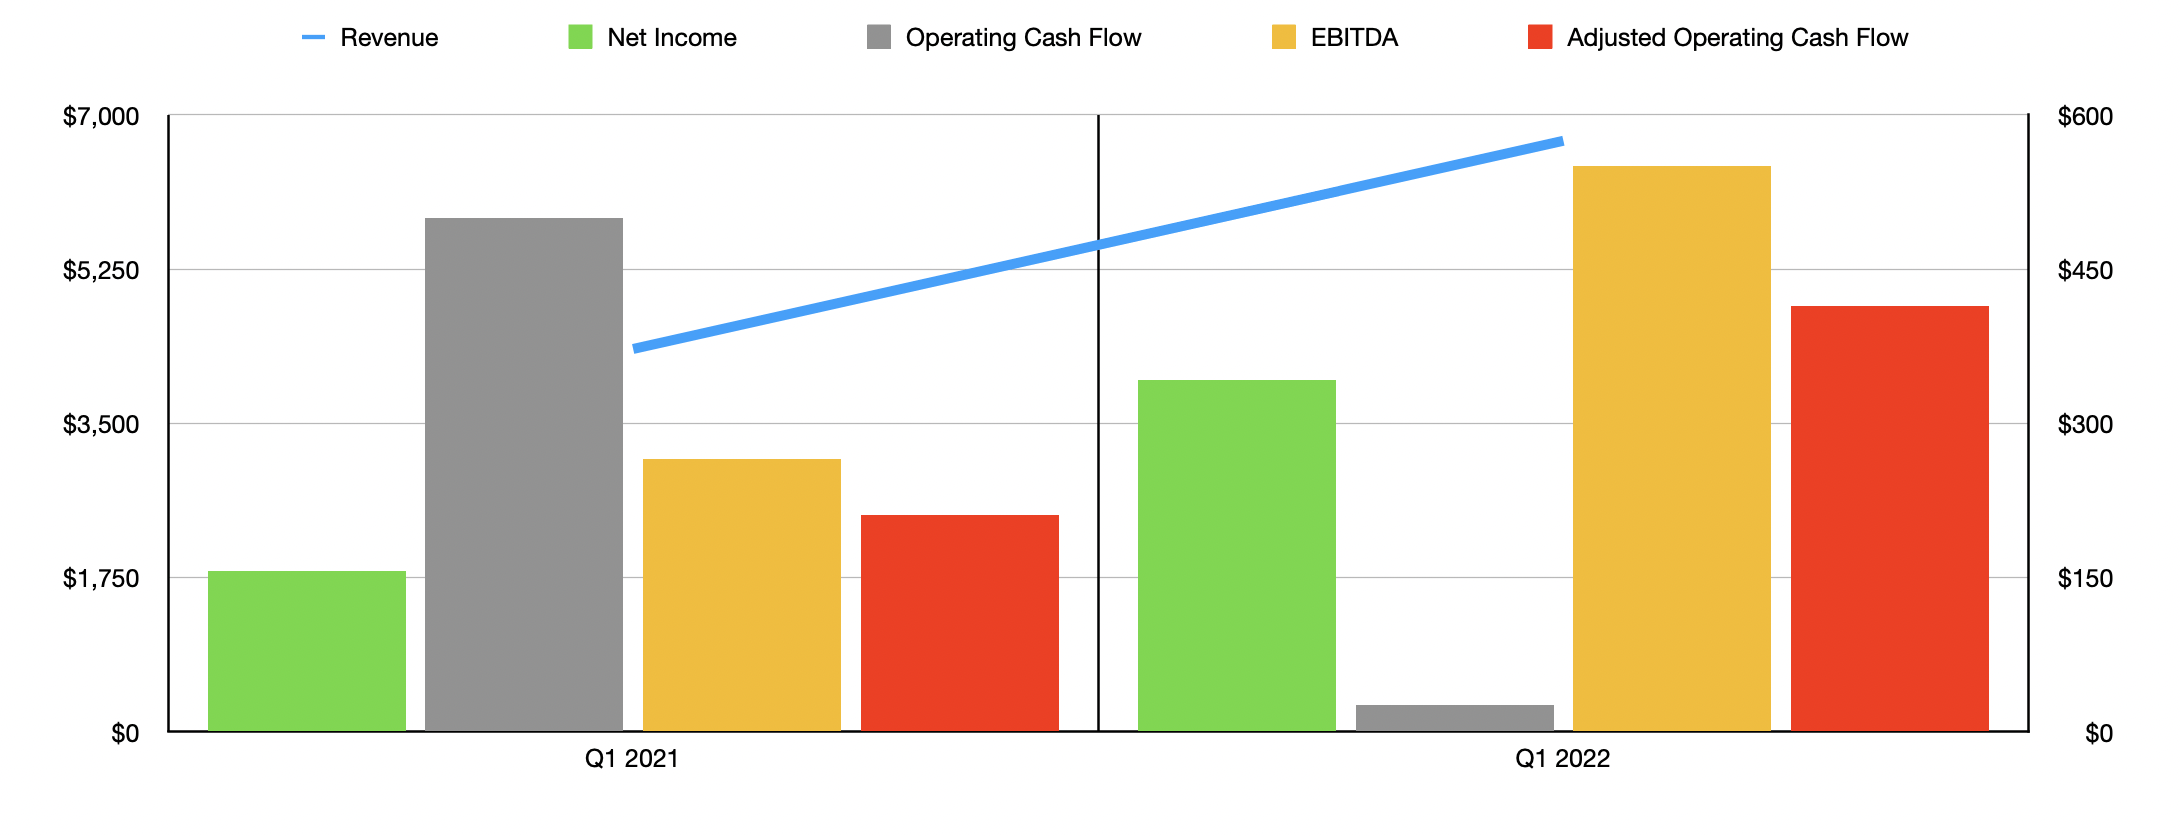
Growth for Lithia Motors continued into the first quarter of the company’s 2022 fiscal year. Based on the data provided, revenue for the quarter came in at $6.71 billion. Although that is significantly higher than the $4.34 billion reported one year earlier, it did miss the $6.96 billion that analysts anticipated. While the company missed on its top line, it outperformed on the bottom line. Earnings per share came in at an impressive $11.55. That compares to the $11.13 per share analysts were expecting. Translated differently, instead of generating the $332.8 million analysts anticipated, the company’s profits came in at $342.2 million. By comparison, profits one year earlier came in at $156.2 million. Operating cash flow did decline year over year, dropping from $499.5 million to $26.3 million. But if we adjust for changes in working capital, it would have actually risen from $210.9 million to $414.1 million. Meanwhile, EBITDA for the company expanded from $264.8 million to $550.4 million.
This growth was driven by a few different factors. In addition to benefiting from continued acquisitions, the company also saw the average selling price for its vehicles increase. On a same-store basis, for instance, new vehicle retail selling prices grew by 17.9% year over year. Meanwhile, used vehicle retail prices jumped an astounding 31.7%. Clearly, the company is benefiting immensely from the supply chain issues affecting the broader global economy. Where the company did experience some pain, on a same-store basis, was when it came to the number of units sold. Under the new vehicle retail portion of the business, total unit sales dropped 17.4% year over year. By comparison, the decline for used vehicle retail units was a more modest 0.9%.
Author – SEC EDGAR Data
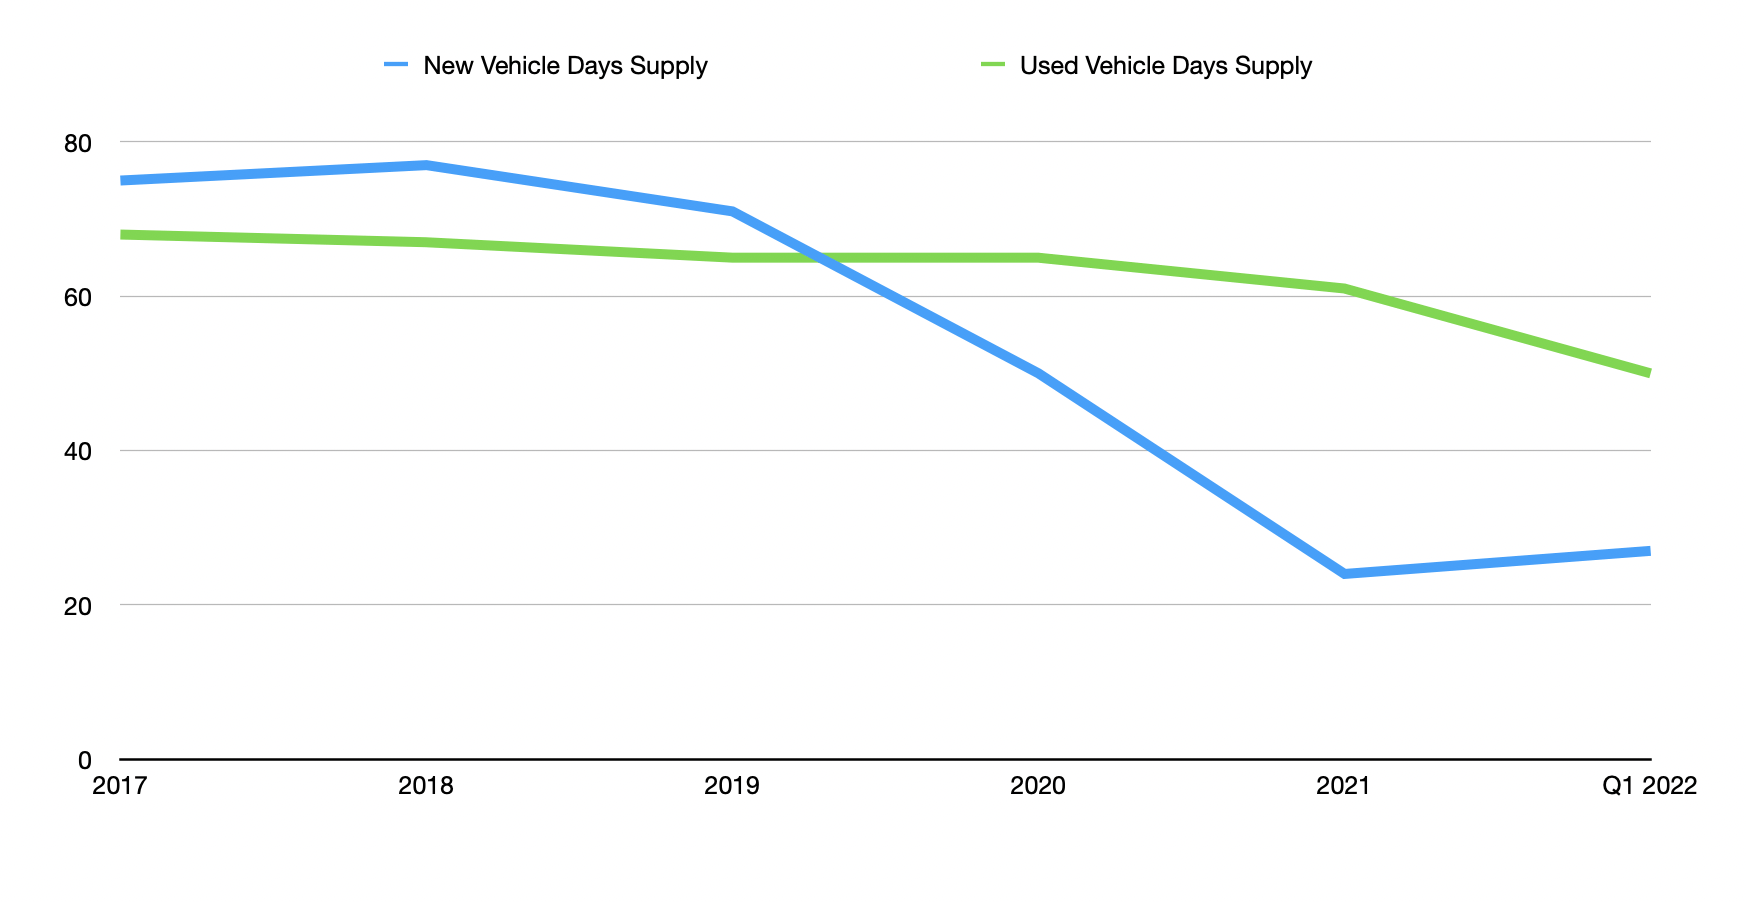
One interesting data point that investors should pay attention to is what management refers to as Days Supply. In short, this metric covers the estimated number of days the company could operate without replenishing its inventory before it would run out of vehicles. Between supply chain constraints and robust demand, this number has dropped in recent years. For new vehicles, this number ranged between 71 and 77 in the three years ending in 2019. In 2020, the number declined to 50, before plunging to 24 in 2021. At present, the number stands at 27. That compares to the 41 days’ worth of inventory the company had the same quarter one year earlier. Though not as drastic, we have seen a similar change when it came to used vehicles. In the four years ending in 2021, this number ranged from a low point of 61 to a high point of 68. At the end of the first quarter of the company’s 2022 fiscal year, this number totaled 50 days. That is, fortunately, up from the 42 seen just one year earlier. But it still implies a tight market for used vehicles. So long as these numbers remain low, market conditions will remain favorable for companies like Lithia Motors while being unfavorable for consumers.
Author – SEC EDGAR Data
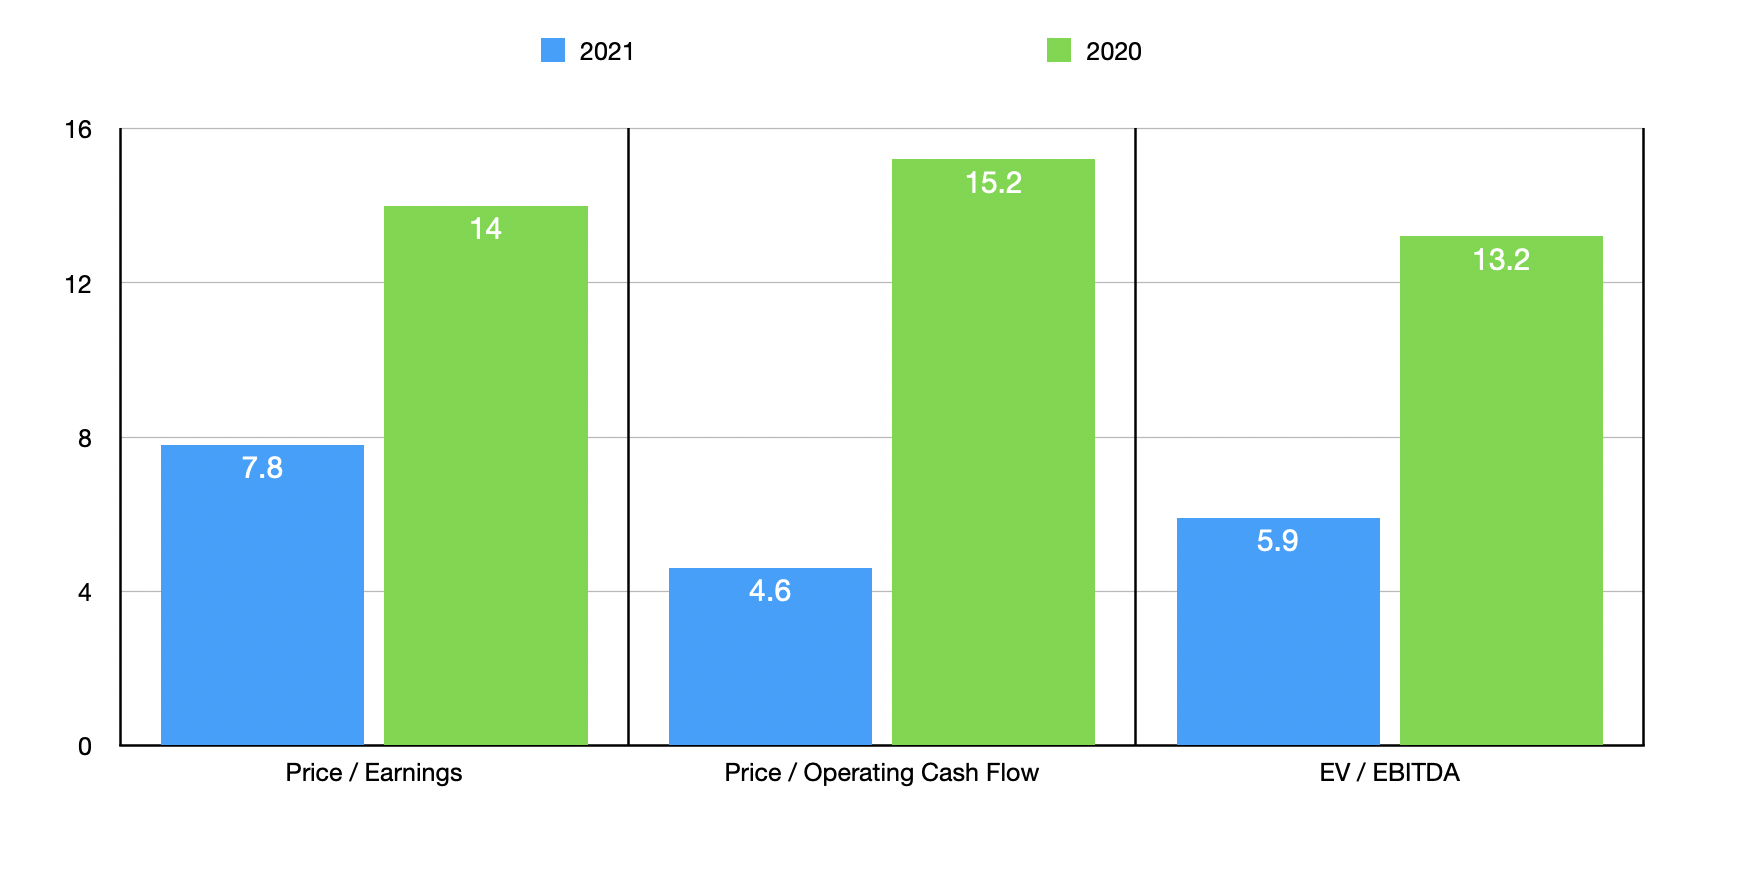
When it comes to pricing the company, we quickly discover that shares are trading at pretty cheap levels. Using the company’s 2021 results, but adjusting so that we utilize their pro forma numbers instead of the official results, we find the firm trading at a price-to-earnings multiple of 7.8. The price to operating cash flow multiple is even lower at 4.6, while the EV to EBITDA multiple of the company is 5.9. By comparison, if we use the 2020 figures, under the assumption that financial performance might eventually pull back as market conditions ease, these multiples would be 14, 15.2, and 13.2, respectively. As part of my analysis, I decided to compare the company to five similar firms. On a price-to-earnings basis, these companies ranged from a low of 5.7 to a high of 16.4. Our 2021 calculation would result in four of these five companies being cheaper than Lithia Motors. The same holds true if we use the data from 2020. Meanwhile, using the price to operating cash flow approach, the range is from 2.4 to 8.9. Our 2021 results would mean that two of the five companies were cheaper than our target. And our 2020 figures would make our prospect the most expensive of the group. Lastly, we have the EV to EBITDA approach. This gives us a range of 4.5 to 9.4. Here, using our 2021 estimates, we find that two of the five companies were cheaper than our prospect. But if we use the calculations from 2020, our prospect is the most expensive of the group.
| Company | Price / Earnings | Price / Operating Cash Flow | EV / EBITDA |
| Lithia Motors | 7.8 | 4.6 | 5.9 |
| Penske Automotive Group (PAG) | 6.8 | 6.3 | 6.4 |
| Murphy USA (MUSA) | 16.4 | 8.9 | 9.3 |
| Asbury Automotive Group (ABG) | 6.1 | 2.8 | 9.4 |
| Group 1 Automotive (GPI) | 5.8 | 2.4 | 4.5 |
| AutoNation (AN) | 5.7 | 4.9 | 5.3 |
Takeaway
All things considered, I must say that I continue to be impressed by Lithia Motors. The company has done a remarkable job in recent years and I suspect that trend will continue over the long haul. I do expect, eventually, a day of reckoning where prices for vehicles pull back. But even if that does come to pass, I cannot imagine the company being any worse than fairly valued. Because of this, I still maintain that this is an attractive ‘buy’ prospect at this point in time.
Be the first to comment