

Bet_Noire
Wall Street analysts believe “Dr. Copper” is a terrific indicator of the economy’s health, and I cannot disagree. Academic studies have proven out a highly positive correlation between major copper price changes and the direction of the manufacturing economy or stock market. From my 35 years of trading experience, when copper is rising quickly to new 52-week highs, the U.S. economy usually performs well over the next year or two. Conversely, when copper is collapsing, like it has done since the spring of 2022 (-40%), more often than not a serious economic slowdown or recession is approaching.
StockCharts.com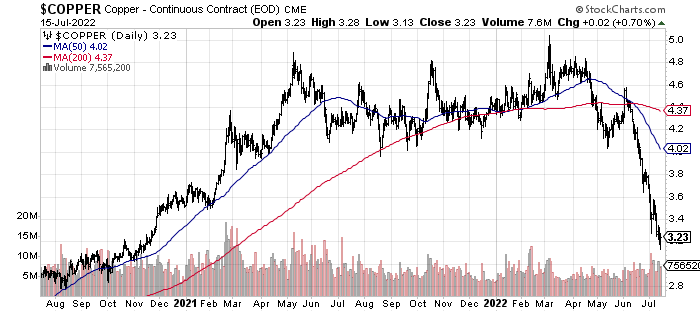
Banking and Gold Assets in Steep Decline
Perhaps much more worrying for the financial markets, banks/brokers and gold/silver miners rarely fall in tandem. These two sectors of the market, basically the critical lending and hard money industries, are the BEST indicators of liquidity in our economic system. Below are 2-year charts of the main ETFs tracking these important sectors, namely the Financial Select Sector SPDR (XLF) and VanEck Vectors Gold Miners (GDX) product. You can review below their sharp price drawdowns “concurrently” over the past three months.
StockCharts.com StockCharts.com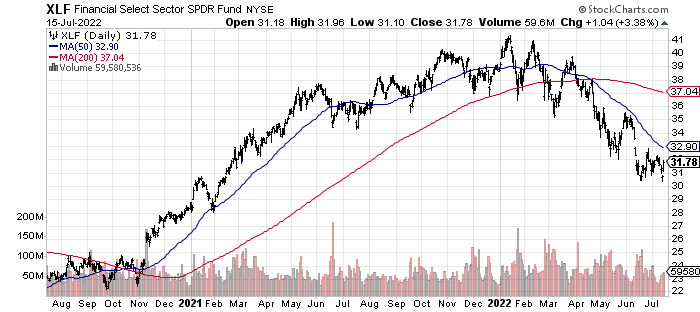
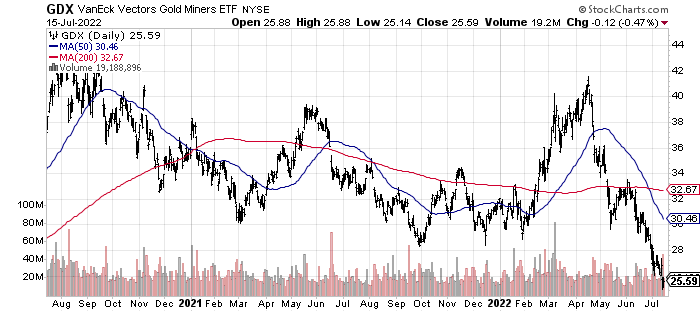
What has taken me by surprise is the rapid slide in gold/silver and related mining equities since the beginning of June. This should not be happening if the stock market was primed and ready to rise. The material deterioration in hard money worth vs. the dollar is likely signaling the Fed may be overtightening monetary policy as it adds pressure on the economy to slow it down, all an effort to contain inflation rates nearing out-of-control status. Honestly, the majority of 20% bear markets in stocks usually see gold miners in a rising, defensive trading position. Watching both banks and gold/silver decline in unison is exceptionally rare in our fiat money-printing currency world.
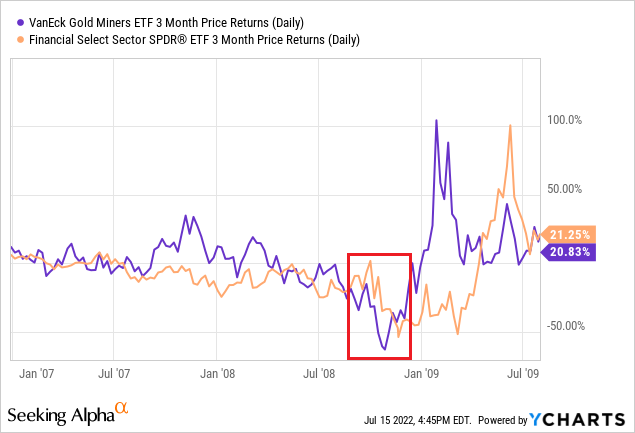
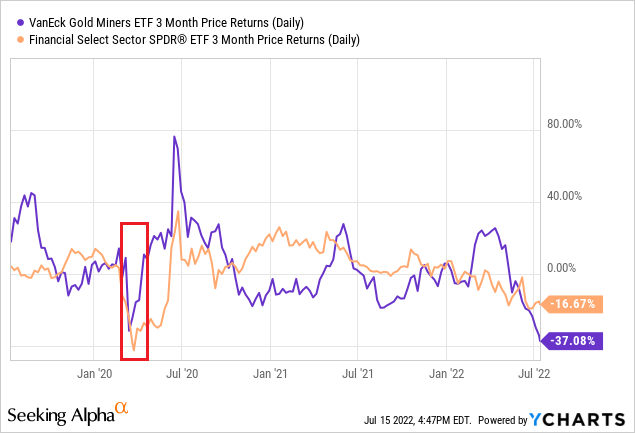
So, this is the main thrust of my concern. Over the last 15 years, a sharp nominal 3-month price drop of -15% or greater for both the XLF and GDX over the same span has only occurred a total of 6 months. That’s 3% of the time. Shockingly, the ONLY times both groups sell off together to this degree is during a liquidity crunch, which often leads to a recession. I have graphed the idea below, using red arrows and boxes to pinpoint the two previous instances of (1) August-November 2008 during the Great Recession and banking crisis [including the idiotic Fed decision to allow Lehman Brothers to fail], and (2) March of 2020, the COVID-19 pandemic crisis month of economic shutdowns. The next instance started days ago.
YCharts – Author Reference Points YCharts – Author Reference Points YCharts – Author Reference Points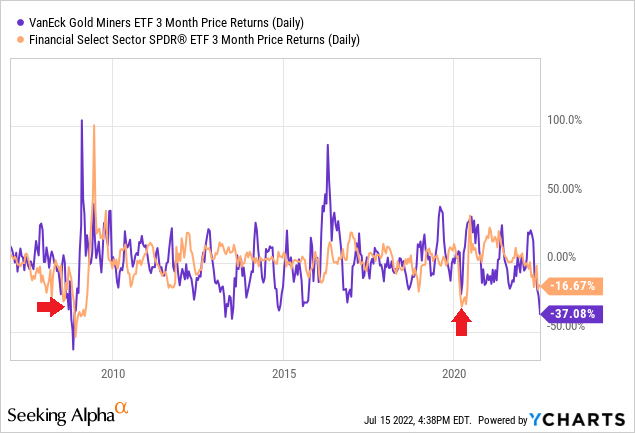
Unfortunately, these two ETFs are new inventions with a limited history. Not pictured, but also important to contemplate, other instances of weak banks and gold miners in tandem existed during parts of 1981-82, the span Fed Chairman Volcker raised short-term interest rates into double digits causing a deep recession to halt imbedded inflation; late 1983 before a 20% stock market decline into 1984; the October 1987 stock market crash; early summer 1990, just before the Iraq/U.S. Gulf War recession; the autumn 1998 Long Term Capital Management bailout-related selloff in U.S. equities; the fall 2000 Dotcom Bust start; and, late summer 2002, at the tail end of the original Tech crash and related recession. Since 1980, these are the only examples of this double whammy bank/gold sector selloff condition over 3-months. Interestingly, many of these spans also witnessed an inverted Treasury yield curve, similar to July 2022, as the economy was sliding into recession.
Final Thoughts
Gold should lead the stock market higher when the final bottom is in. I discussed this usual setup at major turning points on Wall Street in my article posted during late May here. Both the early 2009 spike and April 2020 explosion in gold predated strong upturns for the U.S. equity averages. I fully expect this cycle pattern will be no different.
I decided on Thursday to liquidate my 40% equity position in stocks through my 401(k) plan, and am now sitting at 100% cash (the same as January 1st), waiting for a better reentry point. Friday near the close, I purchased SPDR S&P 500 ETF (SPY) put options to hedge the rest of my “long” market exposure in a regular brokerage account, so I can sleep at night the rest of July.
In the middle of June linked here, I explained one last move lower for equities this summer was likely. It appears the more radical market price slide in my scenario #2 from that effort is about to occur. I would much rather own beaten down technology names for the long-term, and many of my articles since the spring have focused on this group. I absolutely would avoid cyclical and commodity plays like oil/gas the rest of the year. A severe recession in the second half of 2022 may look something like the 2008 Great Recession liquidity crisis. I explained in my article during early July here how the first-half 2022 commodity boom may repeat the 2008 scenario of straight up morphing into straight down in a weak demand, recessionary environment.
Because of the YoY CPI print of 9.1% this week for June, and dramatic unexpected weakness in gold/silver, I am moving my worst-case scenario downside from 10% to 20% over coming months for the S&P 500 index. Unless the market collapses before the next Federal Reserve meeting on July 26-27, I think the world’s primary central bank will have to hike rates another 0.75% to 1%, to retain credibility in its inflation fight.
The truly bad news is historically after a stock market tank of 25% over six months (like 2022), with an economy slipping into recession (which is the present Atlanta Fed’s GDPNow forecast), interest rates have typically peaked and reversed into some sort of decline to support a world fading into financial crisis. You have to go back to the 1970s and early 1980s stagflation period to find another instance of rising interest rates despite negative “real” GDP.
GDPNow – Atlanta Fed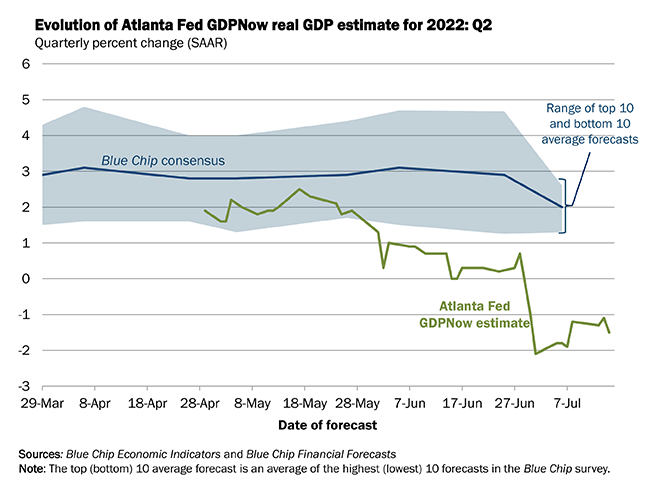
My conclusion is today’s liquidity crunch and pressure on stock quotes will continue this summer, until it’s clear we are in recession and/or panic selling hits. If the economy holds up and the stock market fails to drop materially, the Fed will not be able to begin a new bank easing cycle. Under this scenario, ever higher interest rates and the draining of liquidity into the autumn will continue. To a degree, we are now trapped. Either we get a mild recession now, or a deeper one later in the year. Pick wisely. Hint: optimists and opportunists should be rooting for a large stock market drop sooner, rather than later. I wish I had a better outlook to report, as I was relatively bullish at the May bottom in stock market pricing. If you are searching for a silver lining, Wall Street could be preparing for a significant bounce-back next year. Yet, trading may be a little wild another month or two. Buckle up is my suggestion.
Thanks for reading. Please consider this article a first step in your due diligence process. Consulting with a registered and experienced investment advisor is recommended before making any trade.
Be the first to comment