

bymuratdeniz
Oil services stocks have been out of relative favor for the last month as WTI and Brent prices retreat. Economic growth jitters and uncertainty regarding policy from OPEC+ are macro factors weighing on oil and some Energy sector equities.
Still, oil services stocks are attempting to climb above their November highs amid a broad market rally. Valuations are not as cheap as they once were in the space, and investors should stay focused on cash-flow-generating businesses. One fracking firm has impressive earnings in the last year and has rallied, but is it still a value? Let’s drill down.
Oil Services Stocks Rallied Last Week, Nearing The November Peak
Stockcharts.com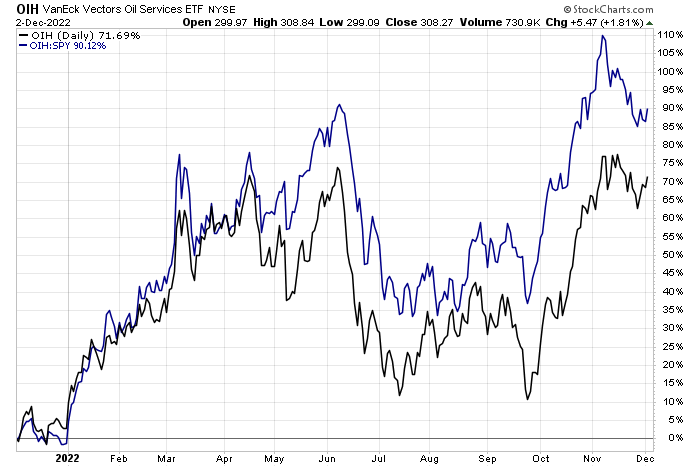
According to Bank of America Global Research, Liberty Oilfield Services (NYSE:LBRT) is a Denver-based, pure-play pressure pumping (hydraulic fracturing) company with operations in the DJ, Powder River, Bakken, Permian, and Eagle Ford basins. LBRT offers wireline services and related goods to onshore oil and natural gas exploration and production companies in North America.
The Colorado-based $2.9 billion market cap Energy Equipment & Services industry stock within the Energy sector trades at a near-market multiple of 16.3 times its trailing 12-month GAAP earnings and pays a small 1.2% dividend yield, according to The Wall Street Journal.
Back in mid-October, Liberty beat on both the top and bottom line estimates with “record operational performance,” as described by its management team. Back in its Q2 report, LBRT reported its highest margins since the third quarter of 2018.
On valuation, analysts at BofA see earnings turning into the black this year and growing impressively once again in 2023 before per-share profit growth moderates in 2024. The Bloomberg consensus forecast is actually more optimistic than what BofA sees. Dividends should rise to $0.20 per share annually in the coming quarters while improving free cash flow should promote shareholder accretive activities.
Liberty’s EV/EBITDA multiple, meanwhile, is very low compared to the broad market. So too are the company’s operating and GAAP earnings multiples when looking ahead. Overall, I like the valuation despite Seeking Alpha’s D rating.
Liberty Energy: Earnings, Valuation, Free Cash Flow Forecasts
BofA Global Research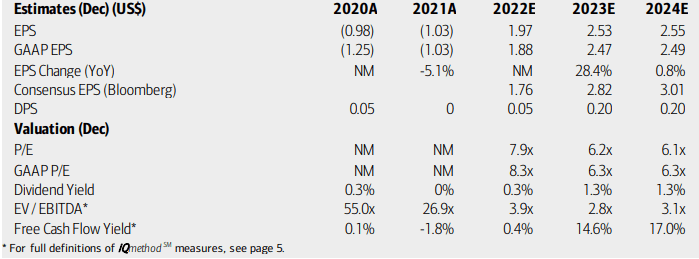
Looking ahead, corporate event data provided by Wall Street Horizon show an unconfirmed Q4 2022 earnings date of Tuesday, February 7 AMC. Before that, an ex-div date hits on December 5.
Corporate Event Calendar
Wall Street Horizon
Data from Option Research & Technology Services (ORATS) show a consensus Q4 earnings forecast of $0.75 per share which would be a massive positive change from a $0.35 EPS loss seen in the same quarter a year earlier. ORATS data show that LBRT has topped analyst estimates in each of the last three reports as profitability surges.
LBRT: Another Profitable Quarter In The Cards
ORATS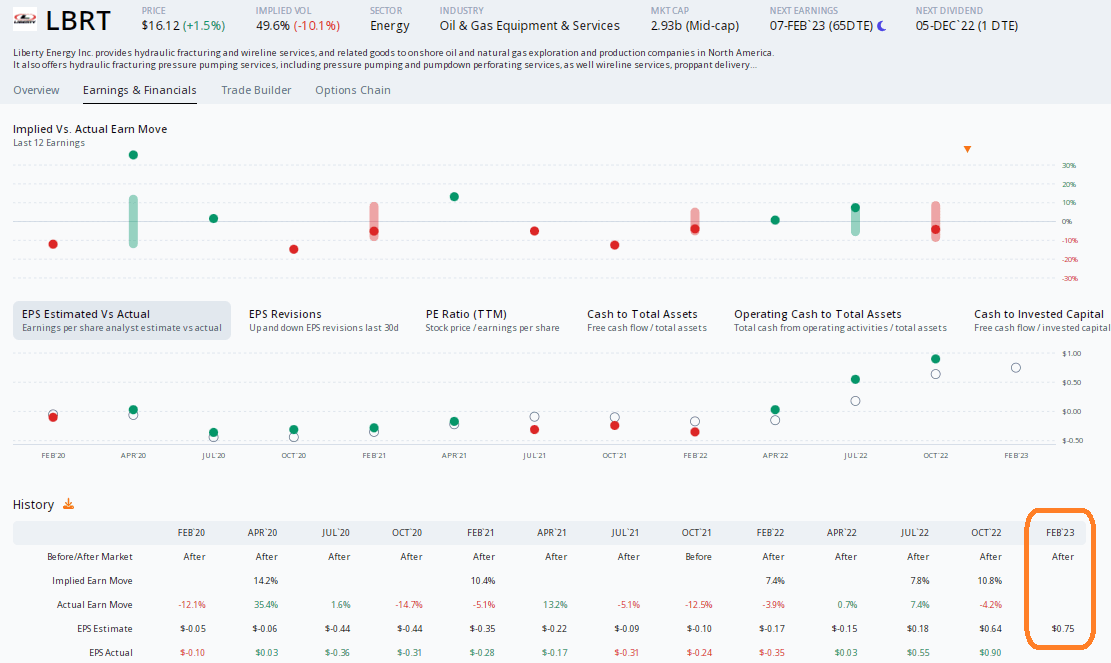
The Technical Take
LBRT has a messy chart in the past two years, but it’s important to take a step back and acknowledge that shares are trending up, as evidenced by its rising 50-day and 200-day moving averages. Moreover, the mean price trendline since December of 2020 is rising, too, despite fits and starts along the way. The stock notched a high way back in April before the notorious downturn in oil and energy equities last June.
The stock held the $11 area on a pullback in September before rocketing higher on big volume in October. A strong earnings report helped the bullish sentiment. For now, waiting for a pullback, perhaps to the $13 area (notice a gap on the daily chart below from two months ago) could make sense for a favorable entry. A stop under the July low is prudent.
LBRT: Shares Gradually Trending Higher, Pick & Choose Your Spots
Stockcharts.com
The Bottom Line
I like the valuation picture and impressive free cash flow on Liberty Energy. The technical chart is not the cleanest I see out there, so some patience might be wise on this one for near-term investors. Long-term investors, though, should like the single-digit earnings multiple and low EV/EBTIDA ratio.
Be the first to comment