


Chadchai Krisadapong/iStock via Getty Images
The Liberty All-Star Equity Fund (NYSE:USA) invests in large-cap U.S. stocks by allocating its assets across five institutional managers covering “value” and “growth” style mandates. This unique strategy among closed-end funds adds to diversification while bringing together different areas of expertise to potentially improve returns. The attraction of the fund also includes its 10% yield through a quarterly distribution based on its net asset value.
We last covered USA with an article back in 2020, taking a view that the fund’s mixed performance record kept us on the sidelines from recommending it. The update today is that we’re turning positive, particularly into a more bullish outlook for the broader market. In our view, USA’s current portfolio and spread to NAV near parity makes it well positioned to outperform to the upside going forward.
What is the USA Liberty All-Star Fund?
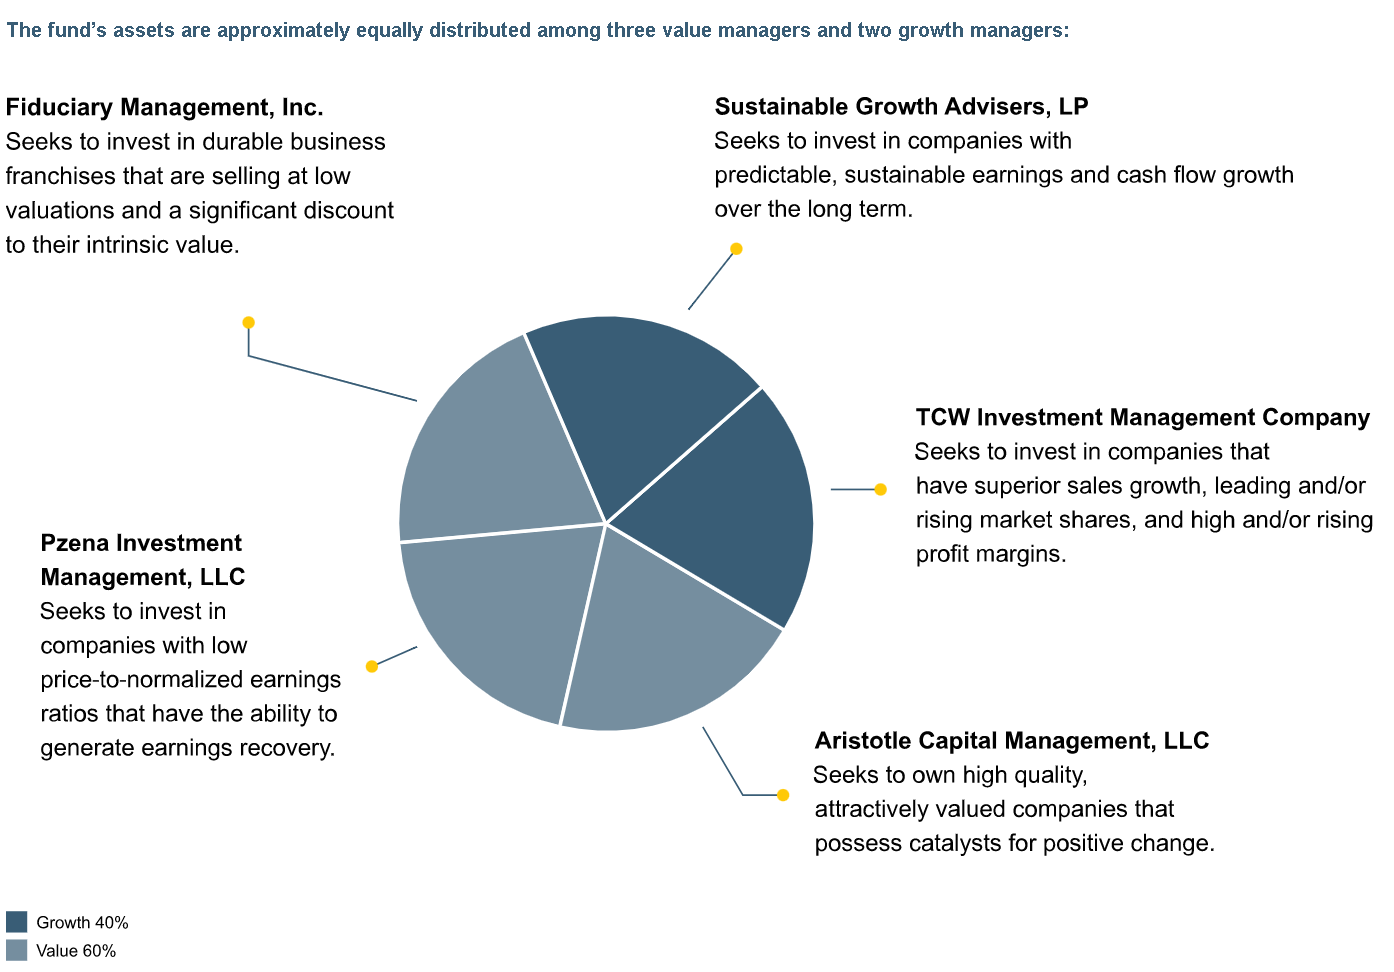
USA is recognized as a “multi-managed fund” with separate firms responsible for managing an approximately equal portion of its assets. Of the five current investment managers, three have a value-style mandate while two are growth-oriented. The result is a 60/40 value to growth split which makes USA keep a balanced core-large cap equity profile but key differences compared to a broad market benchmark like the S&P 500 (SPY).
The firms selected are expected to follow generally consistent investment philosophies based on fundamental analysis. By this measure, USA is actively managed with underlying holdings at the discretion of the respective managers.
source: Liberty All Star
Going through the top holdings, Microsoft Corp. (MSFT) with a 2.4% weighting is the largest position in the USA fund, followed by UnitedHealth Group Inc. (UNH) and Amazon.com Inc. (AMZN) at 2%. With 152 total holdings, the total exposure here is across fewer names than the S&P 500 through a more selective group, but at the same time, less concentrated among the top positions.
For reference, the top 10 equity holdings in USA represent about 18% of the fund while that figure is closer to 26% in SPY. In other words, USA is in effect underweighting several high-profile stocks in the S&P 500 while overweighting others down the line. The entire portfolio is extensive enough to be adequately diversified but different enough from the S&P 500 where security selection and active management contributes to the overall performance.
USA Performance
The good news is that USA has been a solid performer over the last five years, gaining 73% on a total return basis compared to 68% in the S&P 500. USA also beats out some alternative equity CEFs including its “sister fund” the Liberty All-Star Growth Fund (ASG) which has a similar profile but notably utilizes leverage, pressured by higher volatility, particularly in the past year. Indeed, this specific 5-year lookback period makes USA stand out as outperforming the Adams Diversified Equity Fund (ADX) which is likely the closest comparable to USA among non-leveraged equity CEFs.
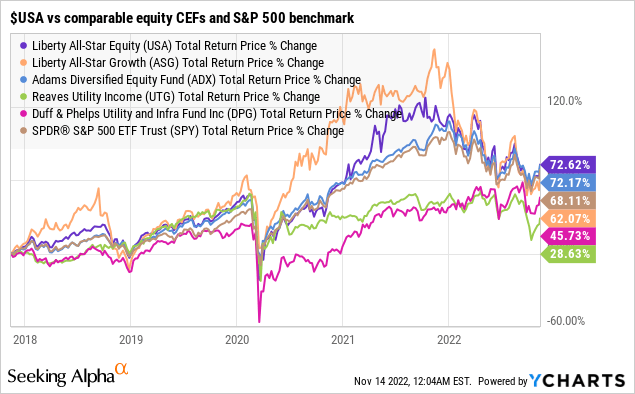
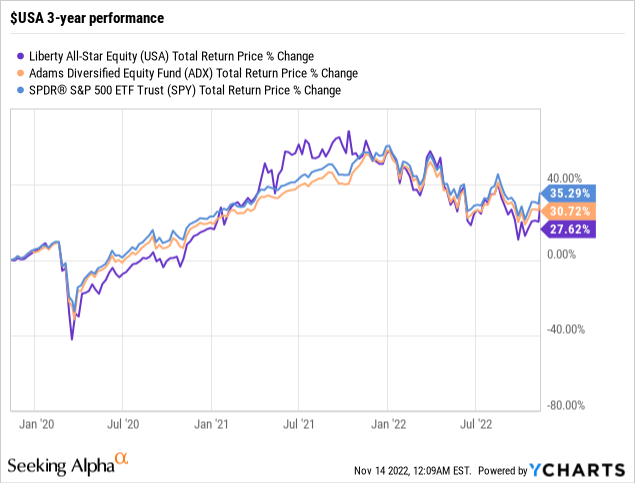
On the other hand, USA’s full historical results are more mixed lagging behind the S&P 500 over the past three years with a 28% cumulative return compared to a stronger 35% in SPY. USA also loses out to ADX and SPY over the last decade.
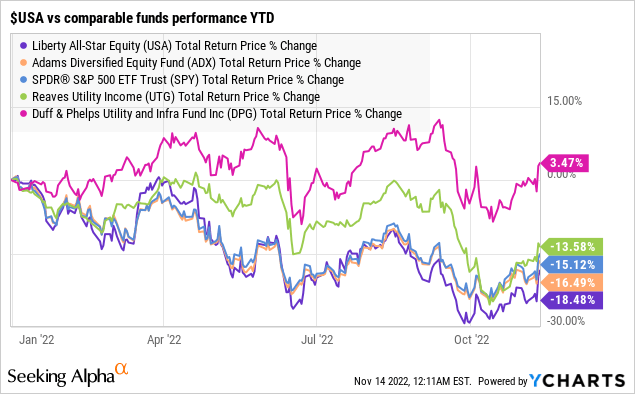
Year to date, USA is currently down -18.5% compared to the -15% decline in the S&P 500. Among CEFs, funds tilted toward the energy sector have tended to outperform. That’s the case with the Duff & Phelps Utility and Infrastructure Fund (DPG), impressively up 3.5% this year as a standout. The takeaway here is the inconsistency in performance from USA that has been further pressured by the broader market volatility this year.
USA Dividend Policy
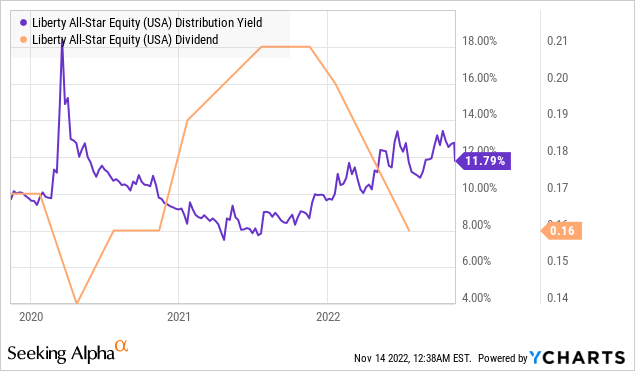
We mentioned the fund’s 10% yield which is part of the official policy to distribute four installments of 2.5% of the fund’s net asset value per quarter. Historically, this has been achieved by realizing capital gains along with a small portion classified as a return of capital. The reason the payout is sustainable is that the actual per-share amount is variable each quarter depending on the changes in the fund’s net asset value.
For example, the latest amount announced at $0.15 per share payable on January 3rd, 2023 is down -6.3% from the $0.16 per share prior rate. An increase is possible in the future assuming the fund’s net asset value recovers the recent drawdown. While the yield on a cost basis will vary for each investor depending on the original entry point into shares, the forward yield is expected to be around 10%.
USA Price Outlook
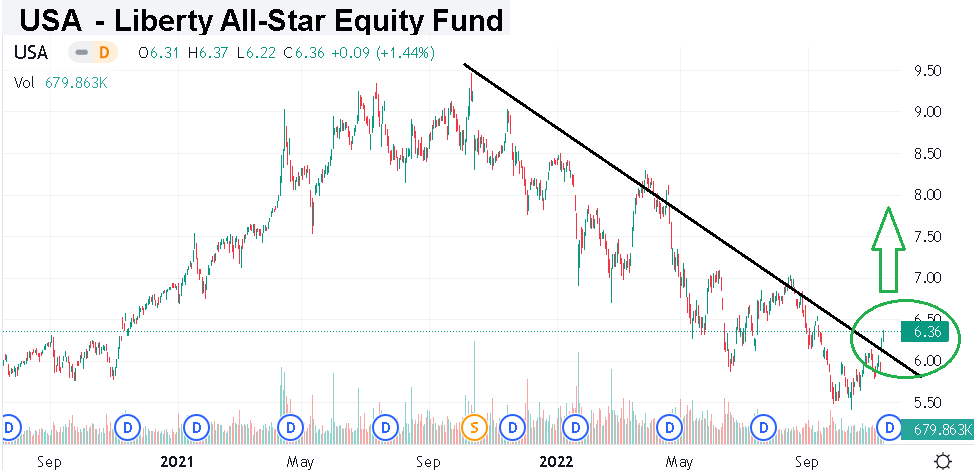
It’s been a terrible year for stocks amid several macro headwinds between persistently high inflation, rising interest rates, and signs of a slowing economy. We’d also add that the lofty valuations reached in 2021 made the fall from the top even greater. In this regard, USA has been caught up in the mess, declining from a high above $9.00 at the end of last year down to the recent low of $5.41.
Seeking Alpha
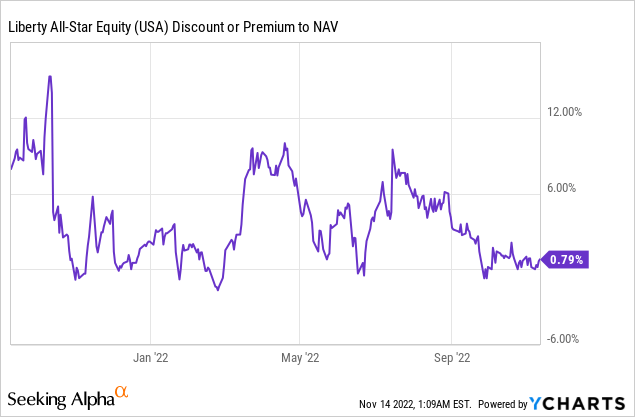
That being said, a large portion of its share price correction includes the reversal of a larger premium to NAV in 2021 that reached 13%, contracting down to the current level of just 0.8%. The context here was a rights offering that closed in November last year, where Liberty All-Star issued 22.3 million new shares. At the time, USA was trading at a premium to NAV largely related to its strong performance last year while the subscription rights had the effect of closing the premium spread back down toward parity. In our view, USA can justify a higher premium once again in a scenario where market momentum turns more positive.
The bullish case for USA is that the fund leads the broader market higher as sentiment towards risk assets recover into a sustained rally. The tailwinds may have already started last week with the surprisingly lower CPI report for October. The setup here is that as inflation trends lower, the Fed gains some flexibility to adjust its aggressively hawkish monetary policy with some evidence its recent rate hikes are working.
The potential that interest rates are closer to neutral, offers a path into a “soft landing” where economic conditions can outperform expectations. Stocks have upside as interest rates stabilize and macro conditions indicated corporate earnings have room to continue climbing into 2023.
The way we’re looking at USA is that the fund is an excellent vehicle to capture core large-cap equity exposure. The CEF structure adds an incremental return potential as we expect the share price spread to NAV in USA to climb as the performance gains momentum. The fund’s portfolio, which overweights some of the smaller high-beta holdings relative to the S&P 500, should also lead the market higher as stock market bulls regain control.
Final Thoughts
USA is a high-quality fund that simply got caught up in the historic market volatility this year. It’s not perfect, but we think the current setup is bullish with the potential that the macro environment shifts more positively into 2023. We rate USA as a buy.
In terms of risks, further deterioration to the global economic outlook could open the door for a return in volatility and another leg lower in USA. We like the recent action with a rally forming and USA appearing to break out above a long-running downtrend. As long as the September low in the fund holds, a long position here makes sense.
Be the first to comment