

S&P 500, Dollar, CPI, Yields and Earnings Talking Points:
- The Market Perspective: S&P 500 Eminis Bearish Below 3,900; USDCNH Bearish Below 7.0000
- US inflation contracted slightly in December which pulled the year-over-year CPI down to 6.5 percent; but that wasn’t enough to drive the S&P 500 through its 200-day SMA
- With US bank earnings on tap before the open Friday, enthusiasm or warning could help push the markets to ‘break out’ or tip it into ‘reversal’
Recommended by John Kicklighter
Get Your Free Top Trading Opportunities Forecast
The US consumer price index (CPI) release this past session did not disappoint in its ability to generate volatility. However, its contribution to clear trend development was certainly uneven. On the one hand, the Dollar absorbed a clear hit that would extend the productivity of its bearish slide these past months. Alternatively, the supposed benefits of weaker inflation allowing the Federal Reserve to ease off the pressure on financial markets didn’t translate into a material follow through on a multi-day advance for the S&P 500. The same fundamental scenarios promoted through this backdrop exist and the data did facilitate that particular thread of speculation, but perhaps the market priced in much of the good will ahead of time. If that is the case, we simply waiting for the next big ticket update around which the markets can cater to their enthusiasm. Otherwise, we could be reaching a point of balance where the recognition of the Fed’s cap in hawkish policy accurately reflects the potential for the underlying bullish appetite. If we realize the latter scenario, it could be a bigger fundamental shift where ‘bad news’ generates more traction.
As we continue to evaluate the market’s interpretation of key developments going forward and assessing the prioritization of underlying theme, I am keeping close tabs on evolution of views via the chart. This past session was a very volatile but ultimately unproductive day for the major US indices. The Dow Jones Industrial Average posted the best performance of the major three with a 0.6 percent gain on a much smaller daily swing. The S&P 500 on the other hand was much more volatile and registered the smallest advance with a 0.3 percent move. Notably, the volatility intraday has left us with large ‘wicks’ which reflect indecision and all while failing very clearly to overtake the 200-day simple moving average (even the fundamental purists tend to know where that level is) and the trendline resistance that stretches back to the 2021 record high. This position and a heightened state of anxiety could make a ‘speculative meal’ out of almost any meaningful event risk, but the upcoming bank earnings are particularly hearty.
Chart of the S&P 500 with Volume, 50 and 200-Day SMAs and ‘Wicks’ (Daily)
Chart Created on Tradingview Platform
Before moving onto the next immediate fundamental spark ahead as is often the want of a market with a very short attention span, we should consider the deeper implications to this just-released inflation report. While the 6.5 percent headline reading is certainly another big step down in the annual reading’s retreat from four-decade highs, the measure is still very high. The Federal Reserve’s target is for a steady, 2 percent level of annual inflation which will take some time until we return. In the meantime, the risk that another unexpected flare up in inflation through external forces pushes the world to embedded price growth (say uncontrolled wage growth), could create an economic situation that is extremely difficult to navigate through. The Fed and others have committed to stay the course and fend off that threat which is something the markets dispute and aren’t pricing in. It is possible of course that the central bank will be forced to abandon its plan, but that wouldn’t be owing to a softening of inflation in line with expectations. It would come from a problematic collapse in economic activity – and that is not a bullish outcome for markets.
Chart of US Headline CPI YoY, US 2-Year Treasury Yield and 2-10 Yield Spread (Daily)
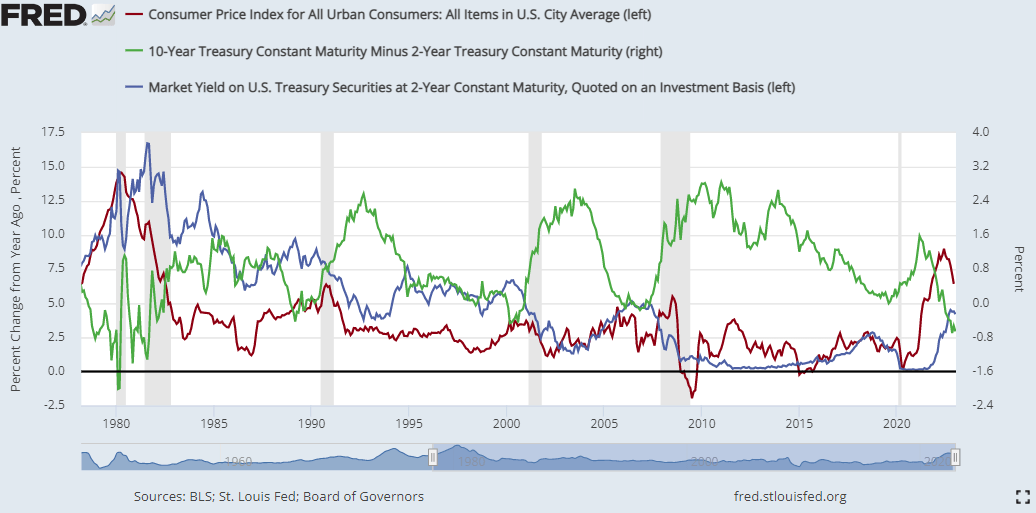
Chart Created on St Louis Federal Reserve Economic Database
Where the S&P 500’s course is more a factor of broader sentiment trends and the market’s overall prioritization of abstract fundamental themes, the picture for the US Dollar is more immediate and nuanced on the point of relative interest rates. The Greenback mounted an enormous rally up through last year with serious help from its advanced and aggressive monetary policy regime alongside the benefit of a relative health economic forecast (while many peers were suffering larger downgrades). We have passed the period of expanding ‘premium’ behind the Dollar’s position, and the balance that is seen coming through yield and growth potential with peers has clearly deflated the currency. At a certain point, the markets will find a sense of balance in the value relative to the plateau we have reached in differentials. This past session, the US 2-Year Treasury yield dropped below its 100-day simple moving average for the first time in 375 trading days. Yet, it is still at 4.13 percent. That is higher than many of its counterparts, and the course for the US generally tends to echo the rest of the world. In other words, if the Fed is close to leveling out (and certainly if forced to cut), it is likely peers like the BOE, ECB and RBA will follow suit. That would maintain the yield differential while also bolstering the Dollar’s safe haven case. Nevertheless, we haven’t hit that threshold yet considering the DXY dropped this past session after the CPI to take out the previous high from the March 2020 ‘pandemic panic’ peak.
Recommended by John Kicklighter
Get Your Free USD Forecast
Chart of DXY Dollar Index with 50 and 100-Day SMAs and US 2-Year Yield (Daily)

Chart Created on Tradingview Platform
Heading into the final trading day of the week, I will be looking for some sense of resolution for the S&P 500 at that 200-day SMA and with the Dollar seemingly on the action side of a breakdown. There are a few high profile fundamental updates due, but I will focus on two. The University of Michigan consumer confidence survey for January comes with inflation expectations but it will more importantly cater to assessing economic potential. That said, equity markets have a tendency to place earnings above official economic figures like GDP as a reflection of foundational health. Let’s see what kind of mood this data mix can inspire.
Top Macro Economic Event Risk For Friday and Next Week
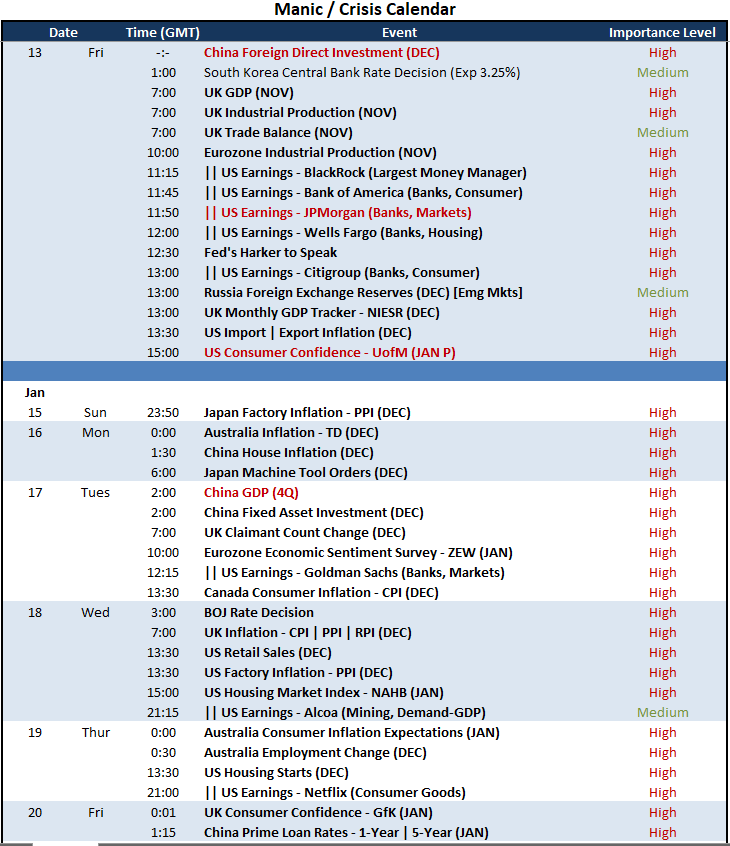
Calendar Created by John Kicklighter

Be the first to comment