


D. Lentz/iStock via Getty Images
Last week I wrote about how misinterpretation and extrapolation of consumer sentiment data caused Simon Properties to become opportunistically cheap.
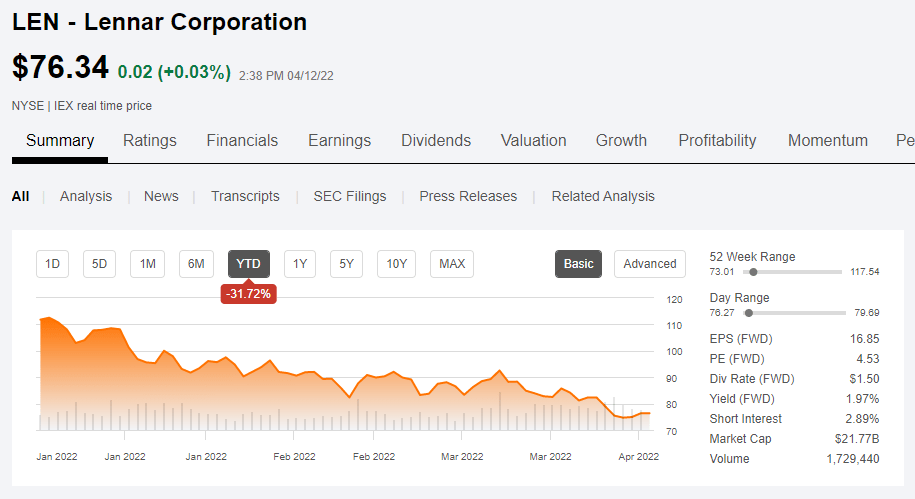
The same phenomenon is happening in homebuilders with extrapolation and misinterpretation of mortgage application data. I believe this has caused Lennar (NYSE:LEN) to drop to a highly opportunistic level, down almost 32% year to date.
SA
Here is the data that has the market so worried.
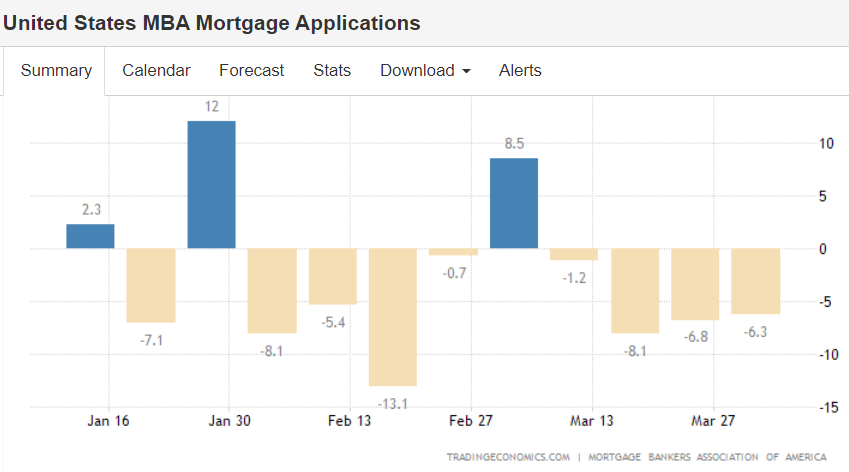
Trading Economics
When a new home is built it is usually financed with a mortgage, so fewer mortgage applications means fewer homes being built right?
Not quite.
There is significantly more that goes into this data as it is actually a composite of all forms of mortgage applications. Over the past few years, refinancing has been a major contributor to overall applications.
If someone has an outstanding mortgage at a high interest rate and there is opportunity to refinance into a low interest rate it can result in big savings with the only drawback being the hassle of refinancing.
In the recent past, interest rates were so incredibly low that millions of mortgages were in the money for a refinance and many were so deeply in the money that people were sufficiently motivated to refinance.
As a result, refinancing activity hit a high level in 2020 and 2021.
In 2022, however, interest rates began to spike as the Fed commenced their battle with inflation. Mortgage rates rose even faster than Treasury yields as spreads widened.
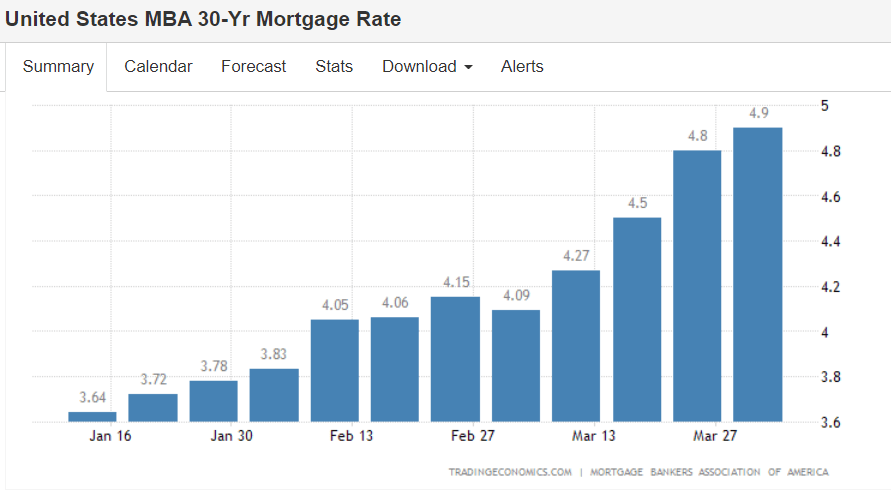
Trading Economics
At around 5% on a 30-year mortgage after so many years of cheaper mortgages, relatively few are in the money for a refinance. Thus, refinances have dropped materially.

Trading Economics
This drop in refinancing accounts for the majority of weakness in overall mortgage applications.
Here is the key piece as it relates to the Lennar thesis. As a home builder, Lennar does not care about mortgage activity. The market merely assumed homebuilding activity was slowing due to the significant declines in mortgage applications.
That is the hazard of using aggregate data to measure something much more granular. What Lennar cares about in terms of actual revenues is housing starts and this data looks totally fine.
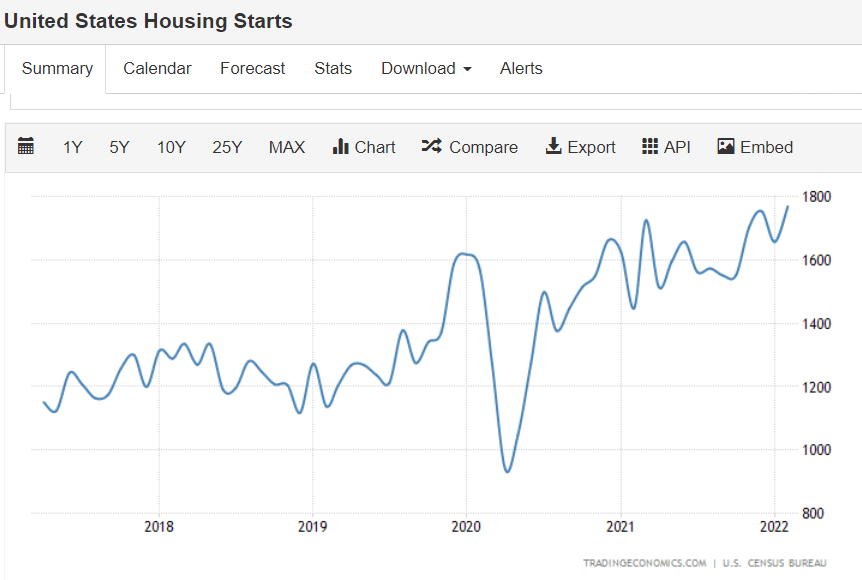
Trading Economics
Lennar also cares that those new homes get sold. It does not want there to be a buildup of unsold homes as that would reduce future demand for homebuilding.
This too looks totally fine.
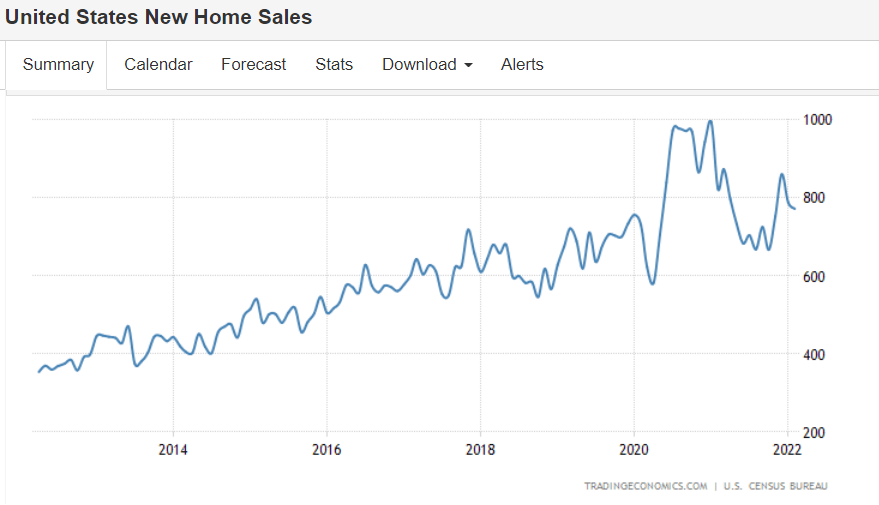
Trading Economics
It has bounced around a bit, but sales volumes are still well above normal.
In fact, it seems the primary thing holding back sales volumes is a lack of inventory.
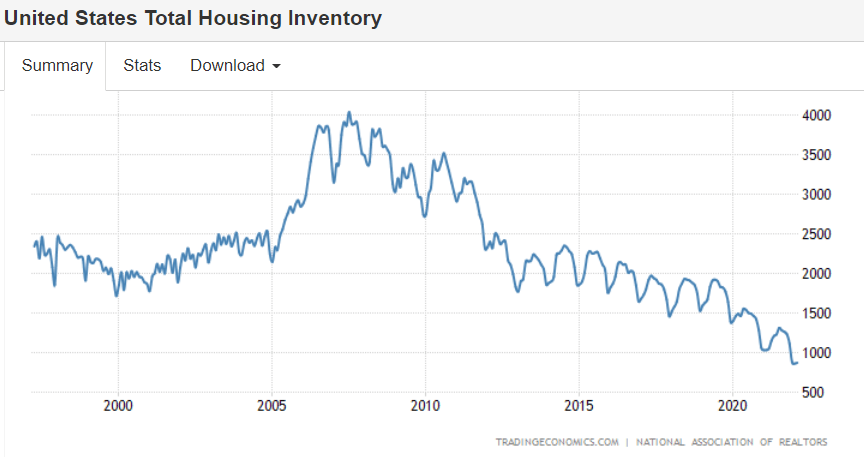
Trading Economics
Homes do not last long in this market. What gets listed tends to get sold quite quickly.
There is a similar tightness in the apartment market with rental vacancy at abnormally low levels.
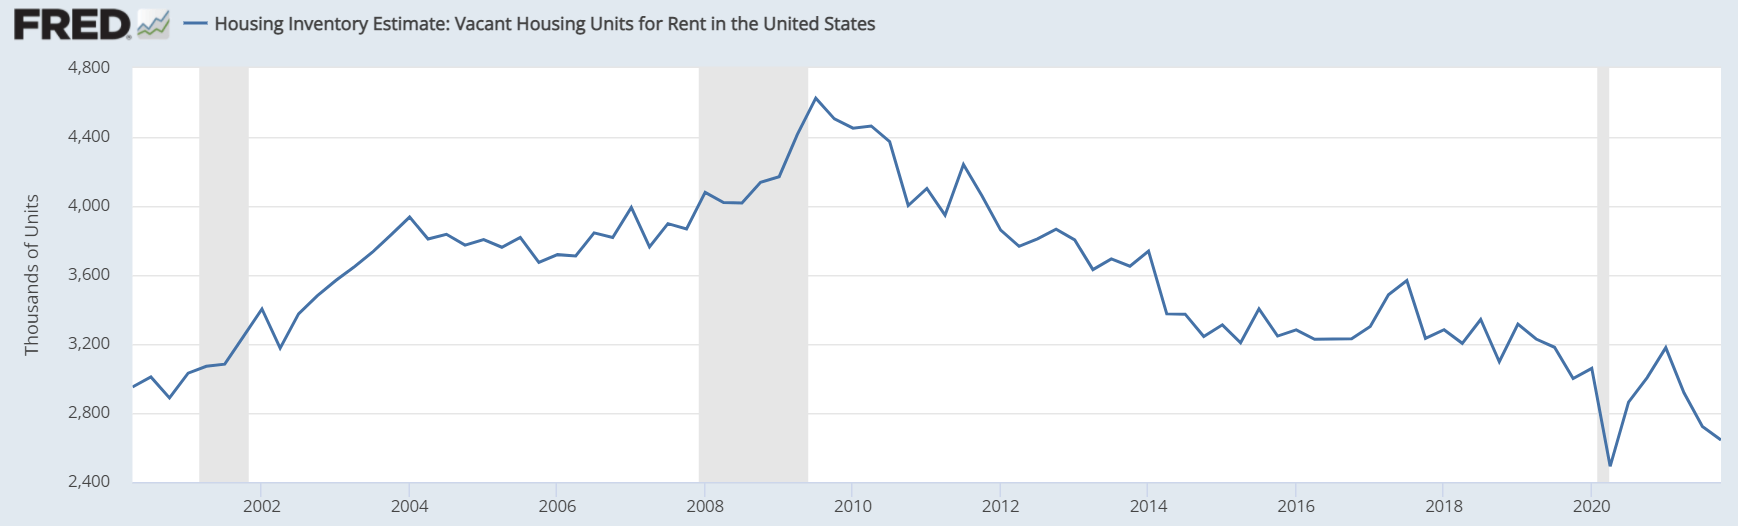
FRED
Low inventory is unequivocally good for builders as the cure to low inventory is to build.
The NAHB Housing Market Index measures builder sentiment as to forward conditions for home sales over the next six months. Anything over 50 is considered favorable and while it has down ticked, it is still at about 80.
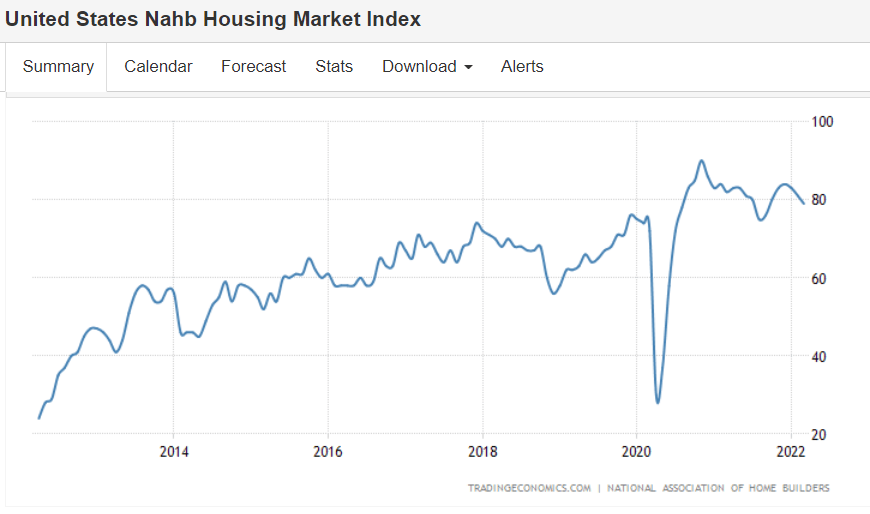
trading economics
Granular data always trumps broad data
Broad data is useful because it provides us a lot of information quickly. However, when it pertains to a specific situation, granular data always trumps broad data. To make this crystal clear, consider the fact that Shaquille O’Neal was born in New Jersey. The average adult male in New Jersey is 5’10”. This is the broad data.
The granular data says Shaq is 7’1” (or 7’2” by some sources).
When we have clean granular data on housing starts, new home sales and housing inventory, it behooves us to ignore the broad data set. Mortgage applications inclusive of refinancing are no more relevant to home builders than the average height in New Jersey is to Shaq’s height.
So while I think the market freaked out on homebuilders when the mortgage data came out was absolutely ridiculous, I do want to give some credit to the more logic based bear argument.
The More Reasonable Bear Case
As mortgage rates rise, home purchase becomes less affordable. Therefore, future demand for homes will decline as the Fed continues to hike interest rates.
My response
I fully agree that mortgage rates increasing as an isolated factor will hurt home demand. However, I think there are a number of offsetting factors which will keep demand strong overall.
- Historical context of mortgage rates
- Rising wages
- Declining lumber prices
- Lack of alternatives
5% on the 30-year mortgage feels really high right now, but from a historical perspective it is still quite affordable. Even if it continues moving up to 6% or even 7% which I suspect it will, it would merely get to a historically normal level.
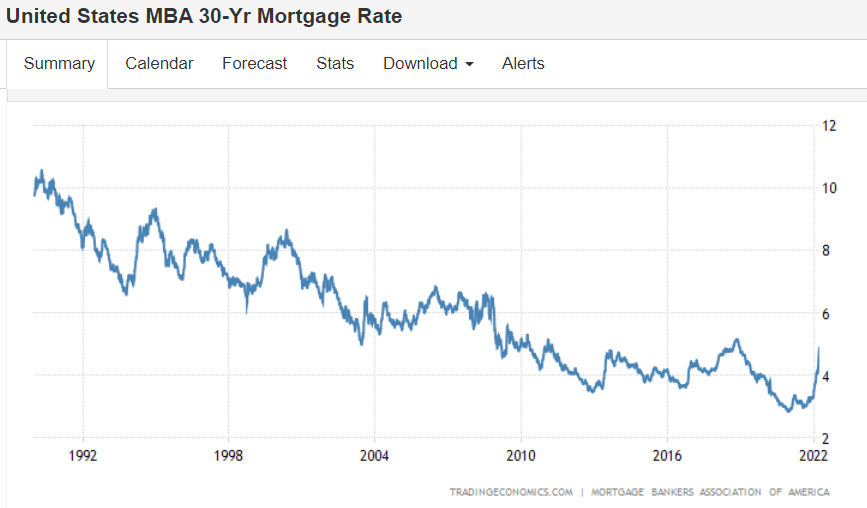
trading economics
There is an abundance of precedence showing that demand for housing exists even at mortgage rates much higher than 7%.
Further, rising wages make the increased monthly cost easier to swallow and lower lumber prices may allow homebuilders to cut a little bit off asking price while keeping their margins high.
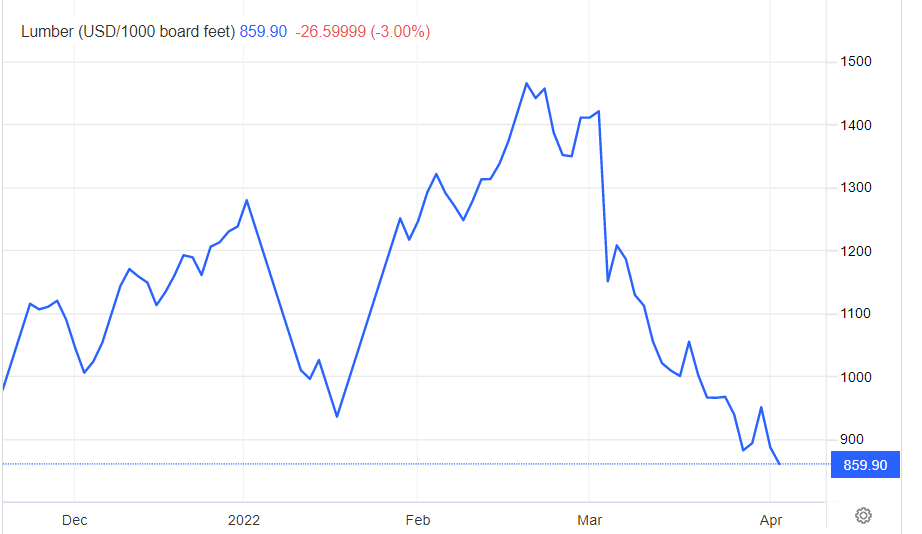
trading economics
It is worth noting that even when lumber prices were over $1300 per thousand board feet, LEN had impressive gross margins.
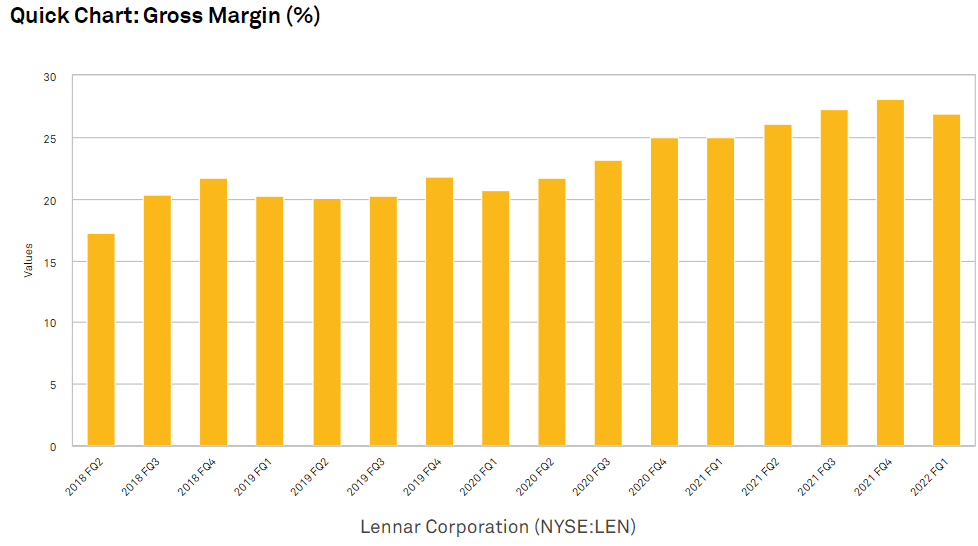
S&P Global Market Intelligence
Source: S&P Global Market Intelligence
Lumber dropping below $900 provides an extra cushion for labor costs or whatever else arises. For more info on this aspect, we explored LEN’s margins more thoroughly here.
Lack of alternatives
The final and I think most important reason consumer demand will not wane in the face of rising mortgage rates is the lack of alternatives. You either have to rent or buy, unless you want to move back in with the parents and that already happened in 2020. After two years of being crammed together, household formation is on the rise not shrinking. Thus, at a population level, people are left with the choice of rent or buy.
For the sake of long run finances, buying is usually a better choice, but for those on a tight budget it comes down to looking at the monthly cost. Rental rates have gotten extreme which makes mortgage costs look cheap by comparison.
It all boils down to the lack of physical real estate that I keep ranting about. There are not enough homes to meet demand. There are not enough apartments to meet demand. The only way out of this mess for the consumer is more building, not less.
Lennar is well equipped for the situation as in addition to their strong market share in homebuilding, they also have a growing capacity to build apartments.
There are both headwinds and tailwinds for Lennar, and I fully understand why someone might be a bit less optimistic about the future than I or the Wall Street consensus estimates are. What strikes me as strange, however, is the level of bearishness that has been priced into the stock.
Valuation
Lennar is trading at true recession levels.
- 4.3X forward earnings per share
- 6.0X trailing earnings per share
- 8.78X EV/EBITDA
The only time LEN’s trailing multiple was this low was in 2006-2007 amidst the housing bubble.
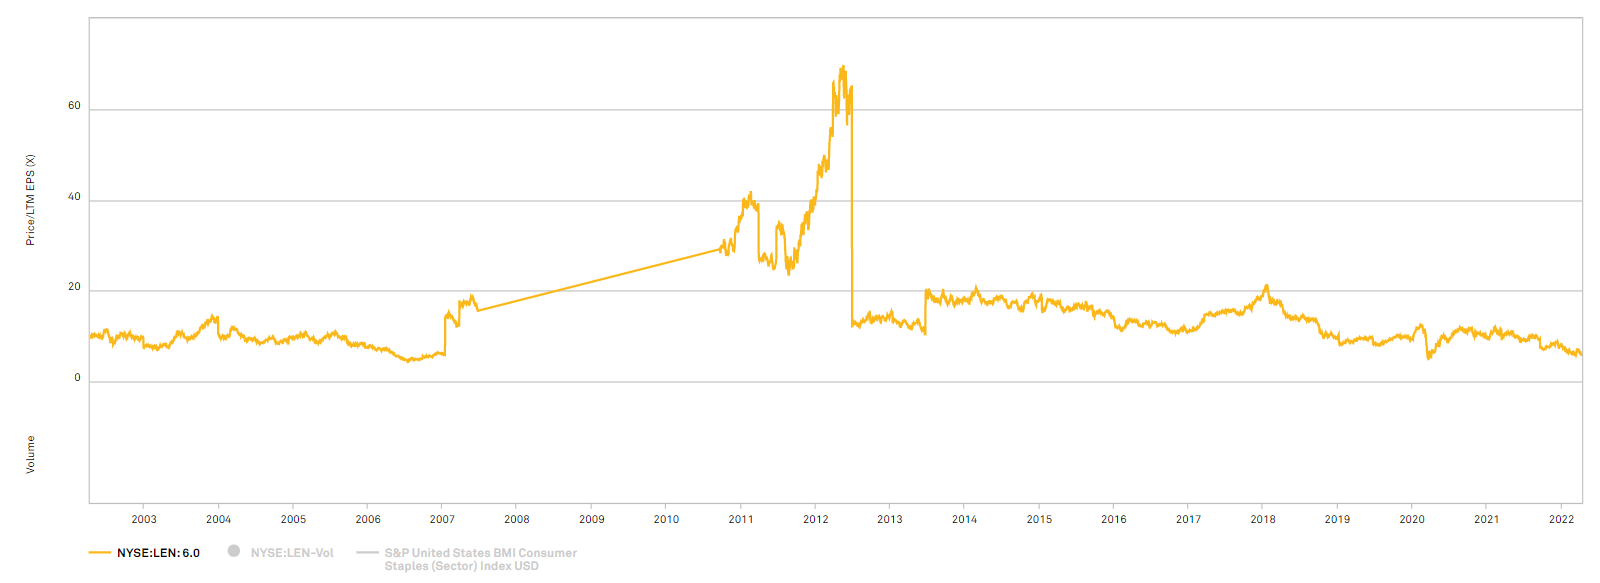
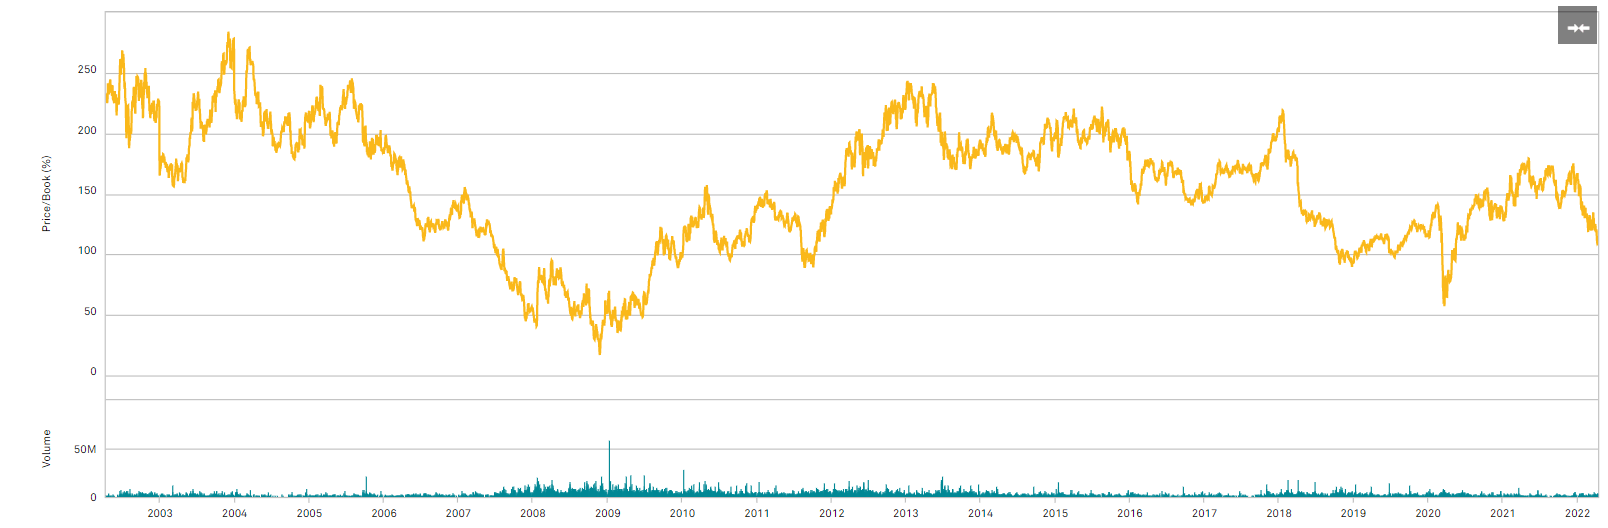
S&P Global Market Intelligence
It even crossed over into trading at a discount to book.
After gaining $8.32 per share in book value over the past year, LEN has a book value of $68.62. LEN.B is trading at $65.13. The only times LEN has traded at a significant discount to book were during the great financial crisis and a brief spike down during the COVID shutdown.
S&P Global Market Intelligence
Purchase of Lennar at either of those times would have resulted in a big winner.
Wrapping it up
The future is uncertain and present data can only give us a rough estimate. While my outlook on homebuilding is positive, I recognize that the data could be interpreted in a myriad of ways.
The opportunity in LEN is not dependent on the future playing out exactly as I think it will. Instead, it is based on the future merely playing out better than the extreme pessimism that is baked into the stock.
Be the first to comment