

Oli Scarff
Thesis
Issues related to Credit Suisse (CS) and the similarities with Lehman Brothers in 2008 have occupied many headlines in the past week or so. Indeed, there are good reasons to be concerned that the CS episode would be a replay of Lehman Brothers and could trigger a similar market-wide crash like 2008. CS’ credit default swap (“CDS”) index recently climbed a level approaching the alarming level right before the 2008 crisis broke out. Issues with a major global bank like CS could create knock-on effects to impact the entire equity market. And the equity valuation itself is already under tremendous pressure. Simply using data publicly available, such as those provided by SPDR S&P 500 Trust ETF (NYSEARCA:SPY) data, you will see that equity yield spread against risk-free rates is also at the thinnest level unseen since 2008.
Against this background, my overall thesis in this article is to point out some anti-Lehman signals too. The yield spread between BAA bonds and risk-free interest rates is much thicker than in 2008, signaling that the market is a lot more cautious this time. The consumer debt level is also much more manageable than in the years leading to the 2008 crisis.
All told, I view the CS issues as issues largely restricted to CS itself (plus a few other institutions with large exposure to CS). In contrast, the issues Lehman faced during 2008 was systemic issue that was common to almost all major banks at that time. As such, we ourselves are still investing with our “business as usual” allocation model. We do not see the need to activate our “recession allocation model” at this time. And we do not suggest you panic either. At the end of this article, I will elaborate on our allocation models and suggest a few actionable ideas for different investment goals ranging from capital preservation, to income generation, and to aggressive growth.
SPY ETF vs S&P 500 index
Before we dive in further, let me clarify that in this article, I will base my analysis on both the S&P 500 (SP500) and also the SPDR S&P 500 Trust ETF (SPY). Unless explicitly mentioned, this analysis will treat them interchangeably because the ETF does track the fund closely as we will see in the next chart). As detailed in my earlier article,
From the following chart, you can see that despite issues like fees, dividends, and tracking errors, its price followed the index closely in the long term. Since its inception in 1993, the S&P 500 Index returned 1440%, and the SPY fund returned 1500%. The difference is only 60% after more than 3 decades of accumulation, translating into about 0.1% per year. Given this extremely small discrepancy, I will use SP500 or SPY data, whichever comes more convenient, in the rest of the analysis.
The approach of using SP500 and SPY data interchangeably provides a couple of advantages, also detailed in my earlier article:
They provide the flexibility for me (and you also) to draw data from either the index or the EFT depending on which is easier and more accessible. Thanks to SPY’s long history (it was launched in January 1993), it provides more than 3 decades of data publicly and is easily accessible to most investors. And finally, another advantage of basing the analysis on both the index and the EFT is that the ETF provides a more convenient vehicle for investors to express their views on the index.
Source: Seeking Alpha data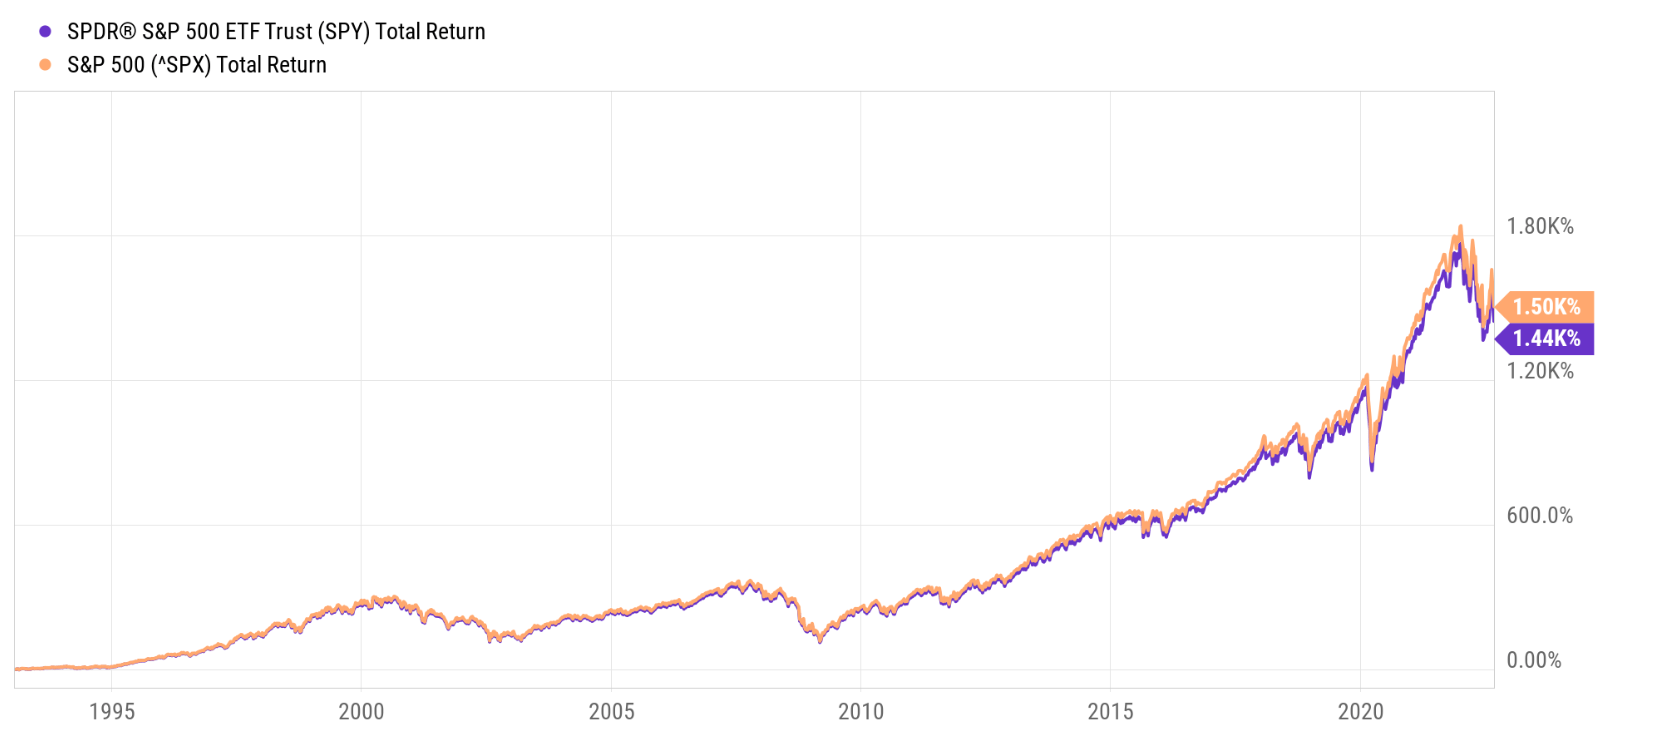
Lehman signal 1 – Credit Suisse’s CDS spread near 2008 level
Credit Suisse’s credit default swap (“CDS”) index climbed to 250 basis points last week, according to the following Bloomberg data. The higher the CDS default swap price, the greater the probability of default. The last time such a level occurred was during the 2008 crisis, approaching the level seen before the collapse of Lehman Brothers.
Source: Bloomberg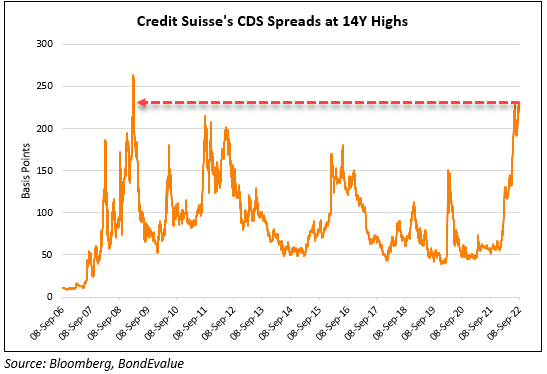
In a memo sent to employees last week, Credit Suisse Chief Executive Korner acknowledged that there were lots of uncertainties, but he emphasized (see the Twitter quotes below):
“I trust that you are not confusing our day-to-day stock price performance with the strong capital base and liquidity position of the bank.”
Such comments did not calm the market. And the irony is that Lehman Brothers said something very similar before its bankruptcy in 2008. Credit Suisse is currently working on a strategic plan that could lead to a major overhaul of its investment bank, including laying off thousands of jobs. And as a major global bank, its issues may very well spill over. For example, investors can be concerned that Credit Suisse’s assets still have other hidden liabilities. Such negative knock-on effects could impact the rest of the equity system, which is already under pressure as detailed next.
Source: Twitter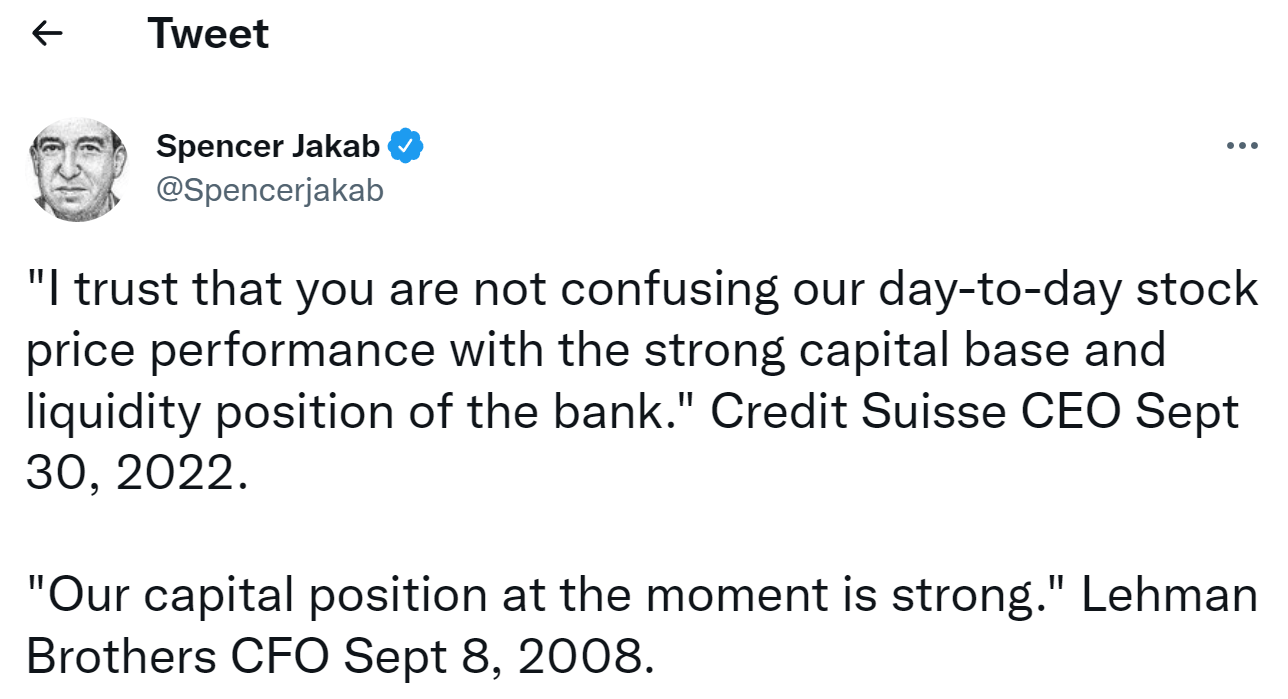
Lehman Signal 2 – SPY yield spread also near 2008 level
Despite all the troubling signs such as the CS issues mentioned above and also high, the U.S. equity market’s valuations stay stubbornly high. The Shiller PE ratio currently stands at 28.17x, as you can see from the following chart. It is above the 2008 level before the crisis (about 24.02x) by a substantial margin of 17%.
Source: www.multpl.com/shiller-pe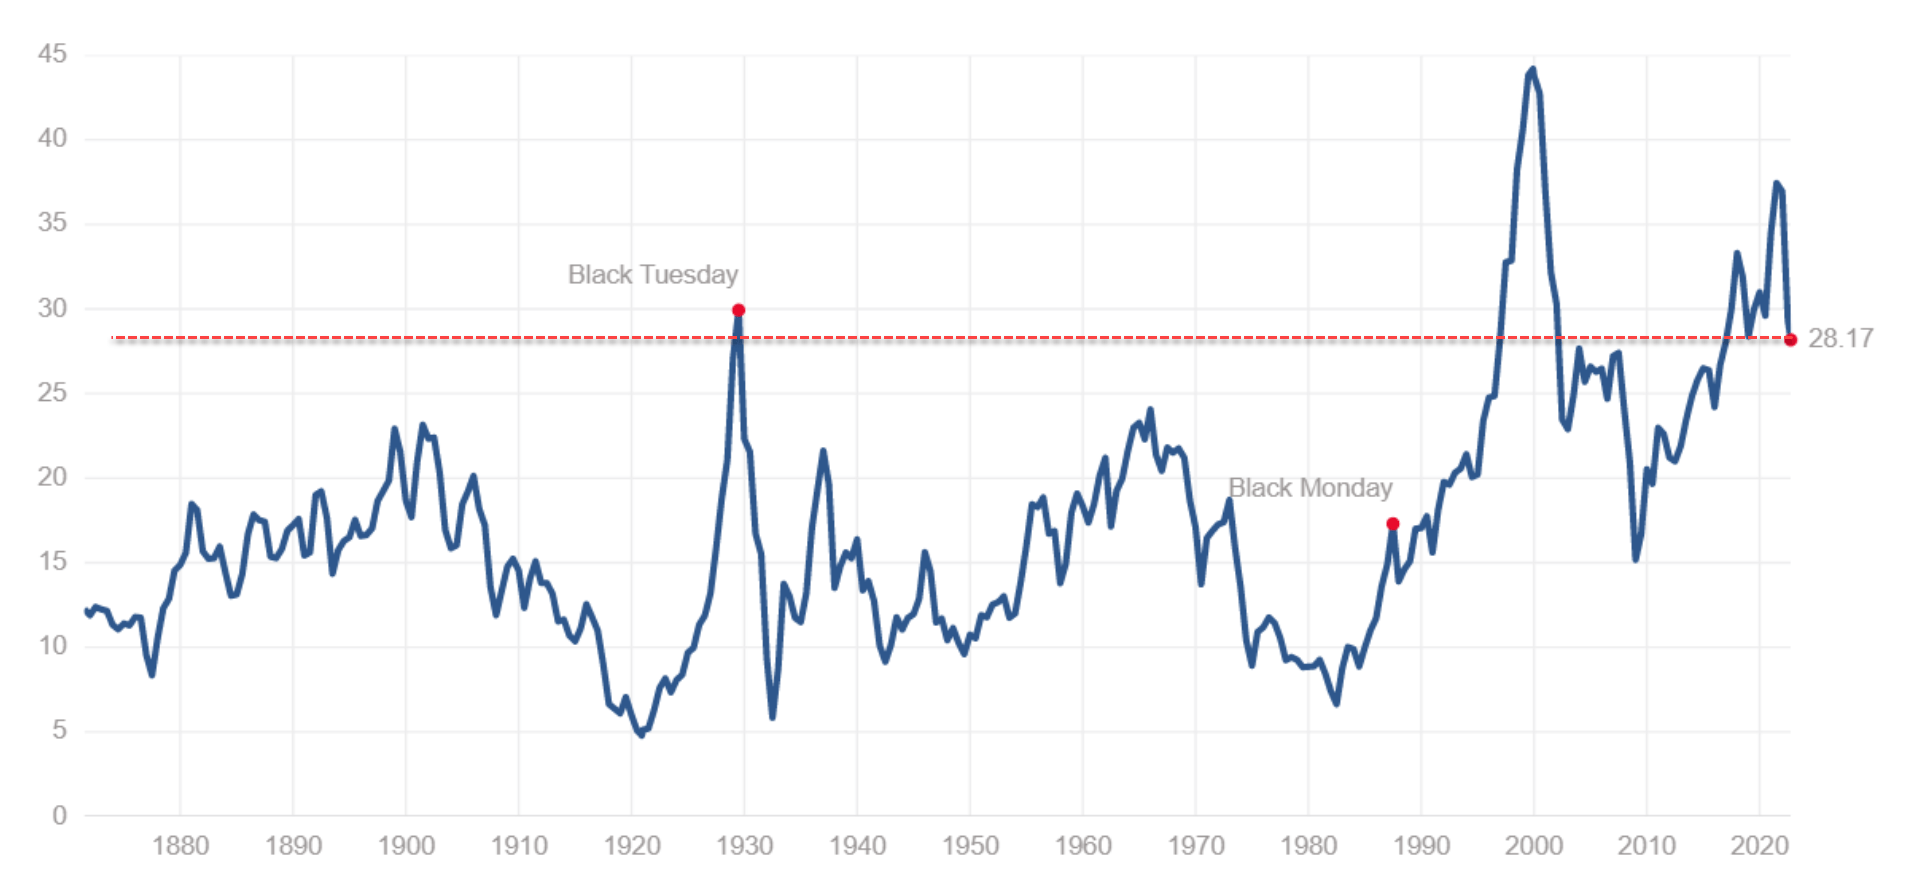
Such a valuation, combined with the rent hikes in treasury rates, has sent the equity market’s yield spread also to the 2008 level, as seen in the next chart.
Driven by high inflation, central banks around the world have been aggressively hiking interest rates. Take 10-year government bonds as an example, the rates have been rising at the fastest pace since the 1990s in all major economies such as the U.S., Britain, Germany, and also France. U.S. 10-year yields have risen more than 110 bps since Aug. 1 and UK 10-year yields are up 123 bps (the fastest rate since 1994). As a result, the yield spread between the equity market (approximated by SPY’s TTM dividend yield) and treasury rates (taken as the U.S. 10-year treasury bond rates) currently hovers around negative 2.0%. As shown, the last time the yield spread was at this level against needs to date back to 2008.
Looking forward, I won’t be surprised if the Fed’s federal funds rate and U.S. Treasury yields (and also likely the U.S. unemployment rate) all rise to the 4%-5% range. In that case, the equity market will have to bulge in tandem.
Source: Author based on Seeking Alpha data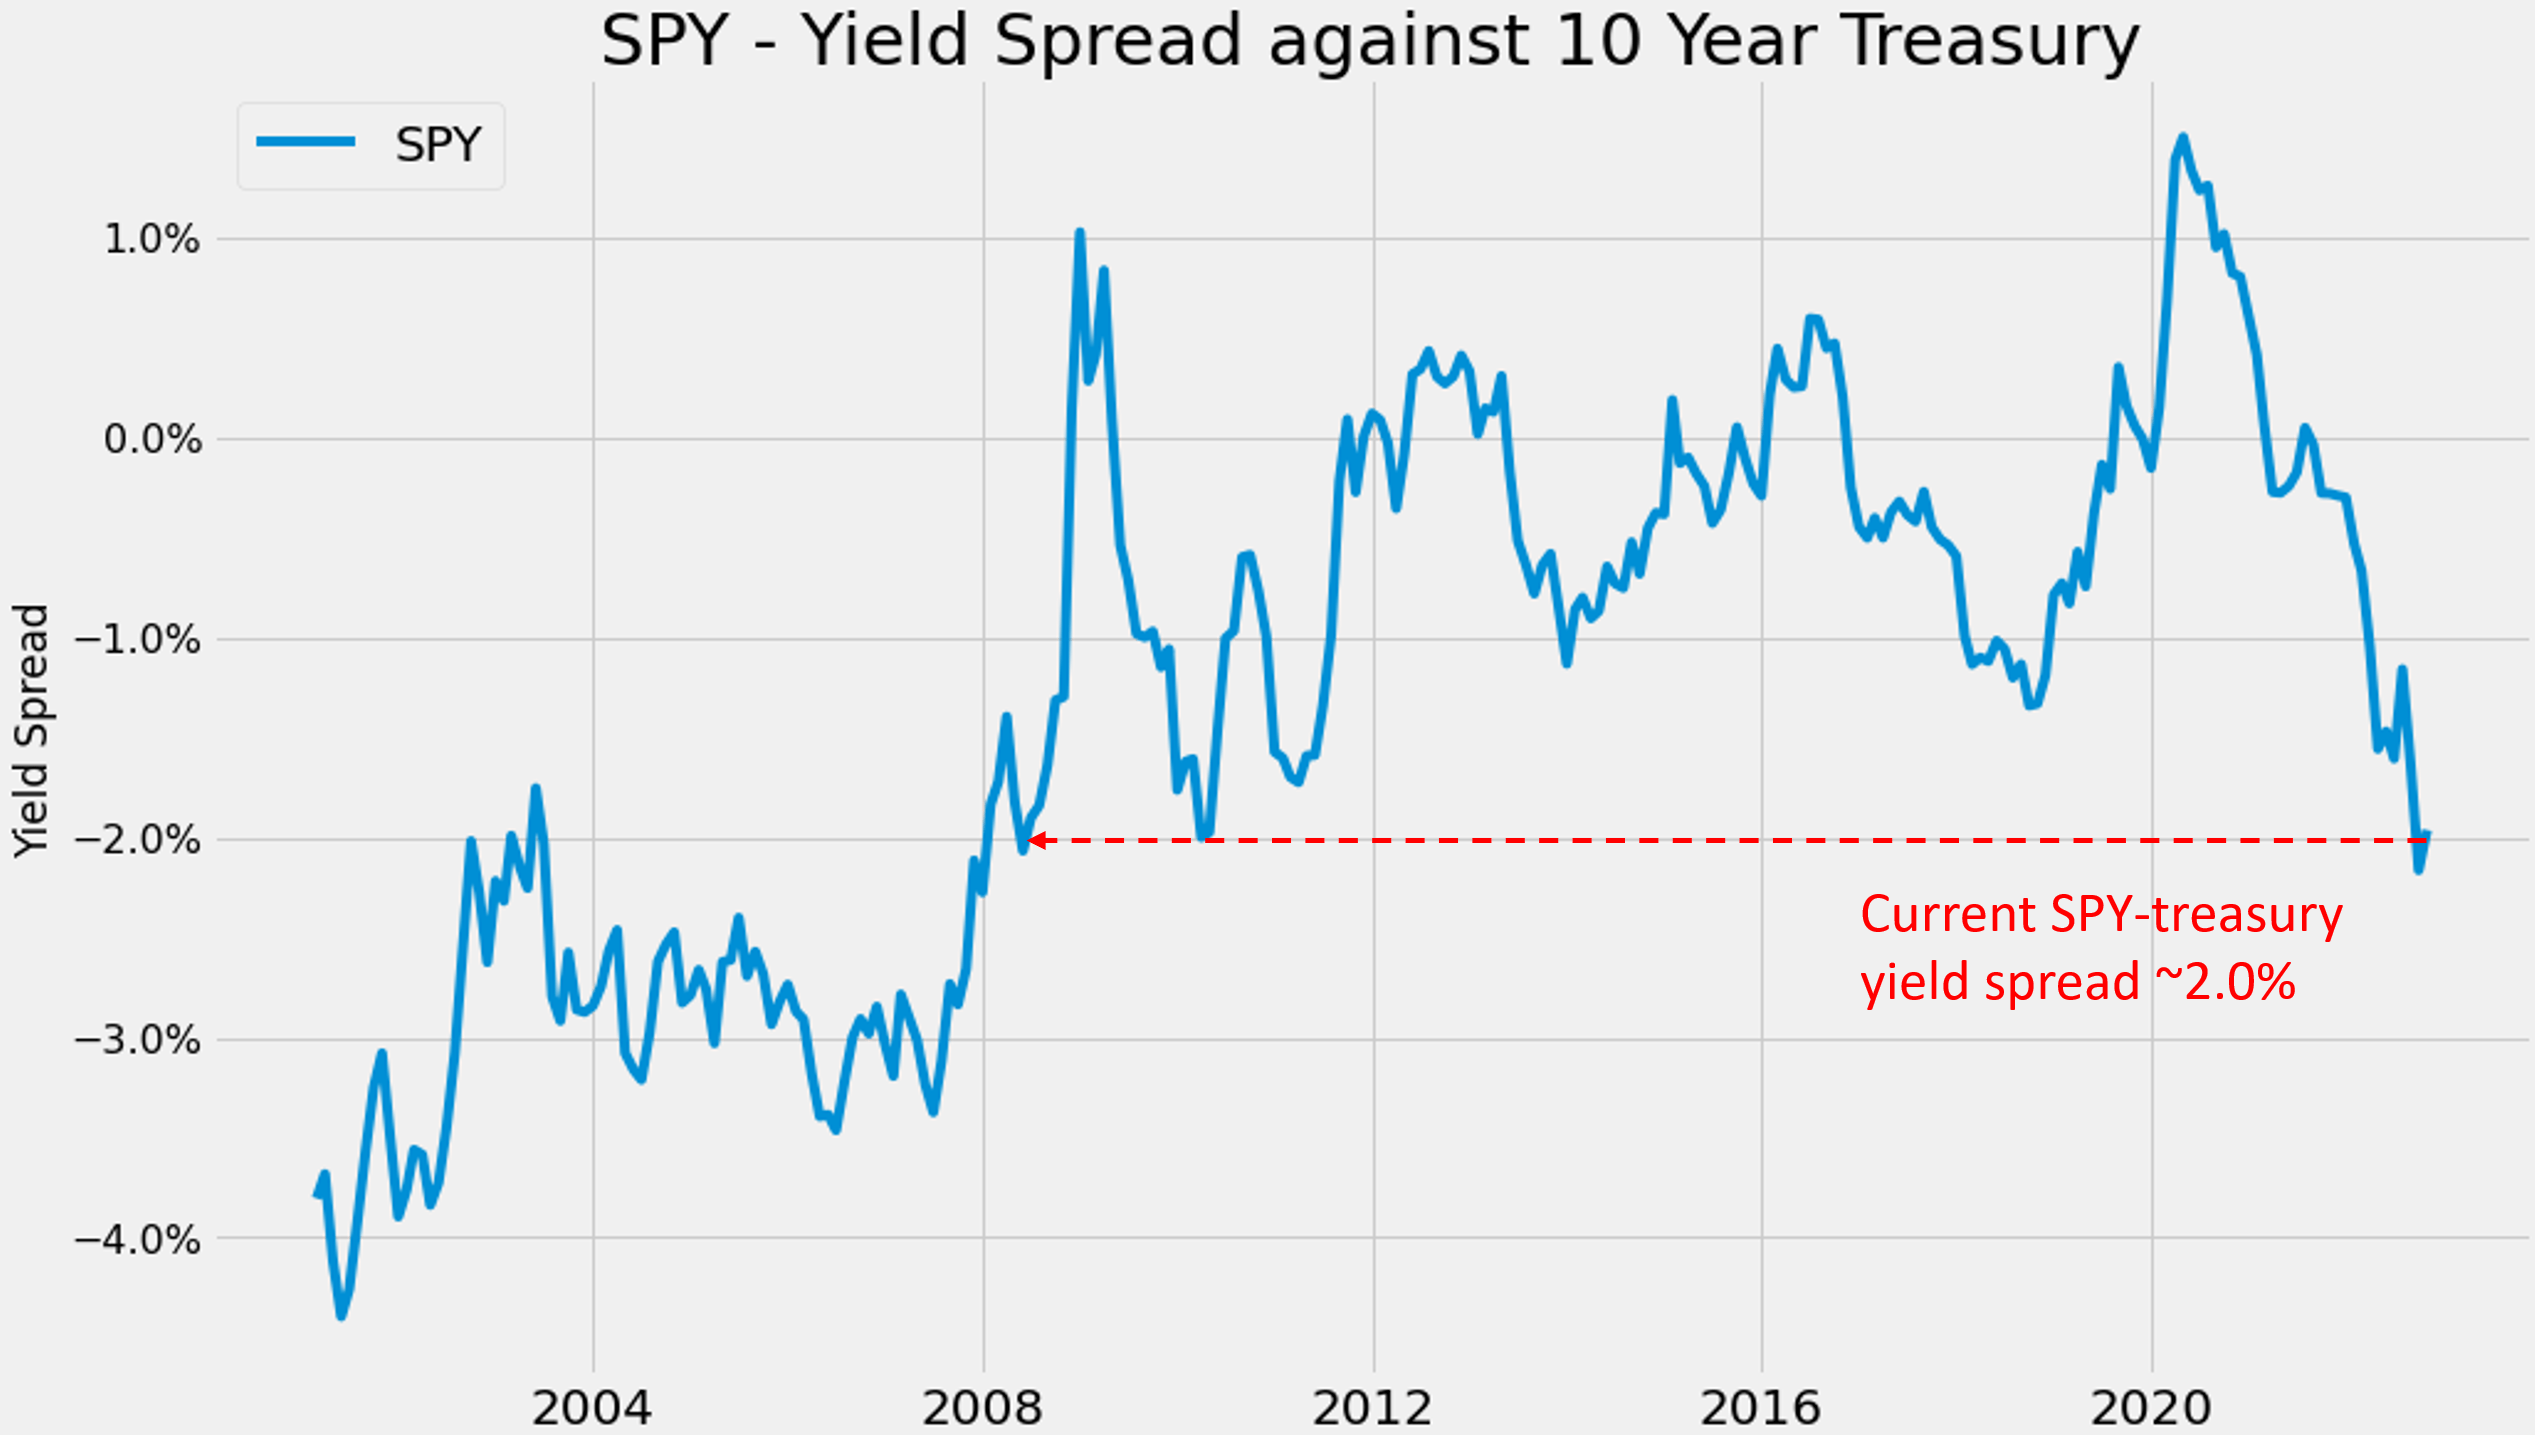
Anti-Lehman Signal 1 – Thicker BAA yield spread
After seeing two Lehman signals, now let me show you two anti-Lehman signals. First, the yield spread between BAA bonds and risk-free interest rates is much thicker than in 2008 as you can see from the chart below. It shows Moody’s Seasoned Baa Corporate Bond Yield Relative to Yield on 10-Year Treasury Constant Maturity. Currently, the BAA-treasury yield spread is at 2.27%. It is admittedly closer to the thinner end considering the peak levels are around 4%.
However, the BAA-treasury spread was as thin as 1.6% before the 2008 crisis as seen. Meaning, the market was hot enough to swallow BAA bonds with only a 1.6% risk premium relative to treasuries. This time, the 2.27% spread signals that the market is a lot more cautious.
Source: Author based on FRED data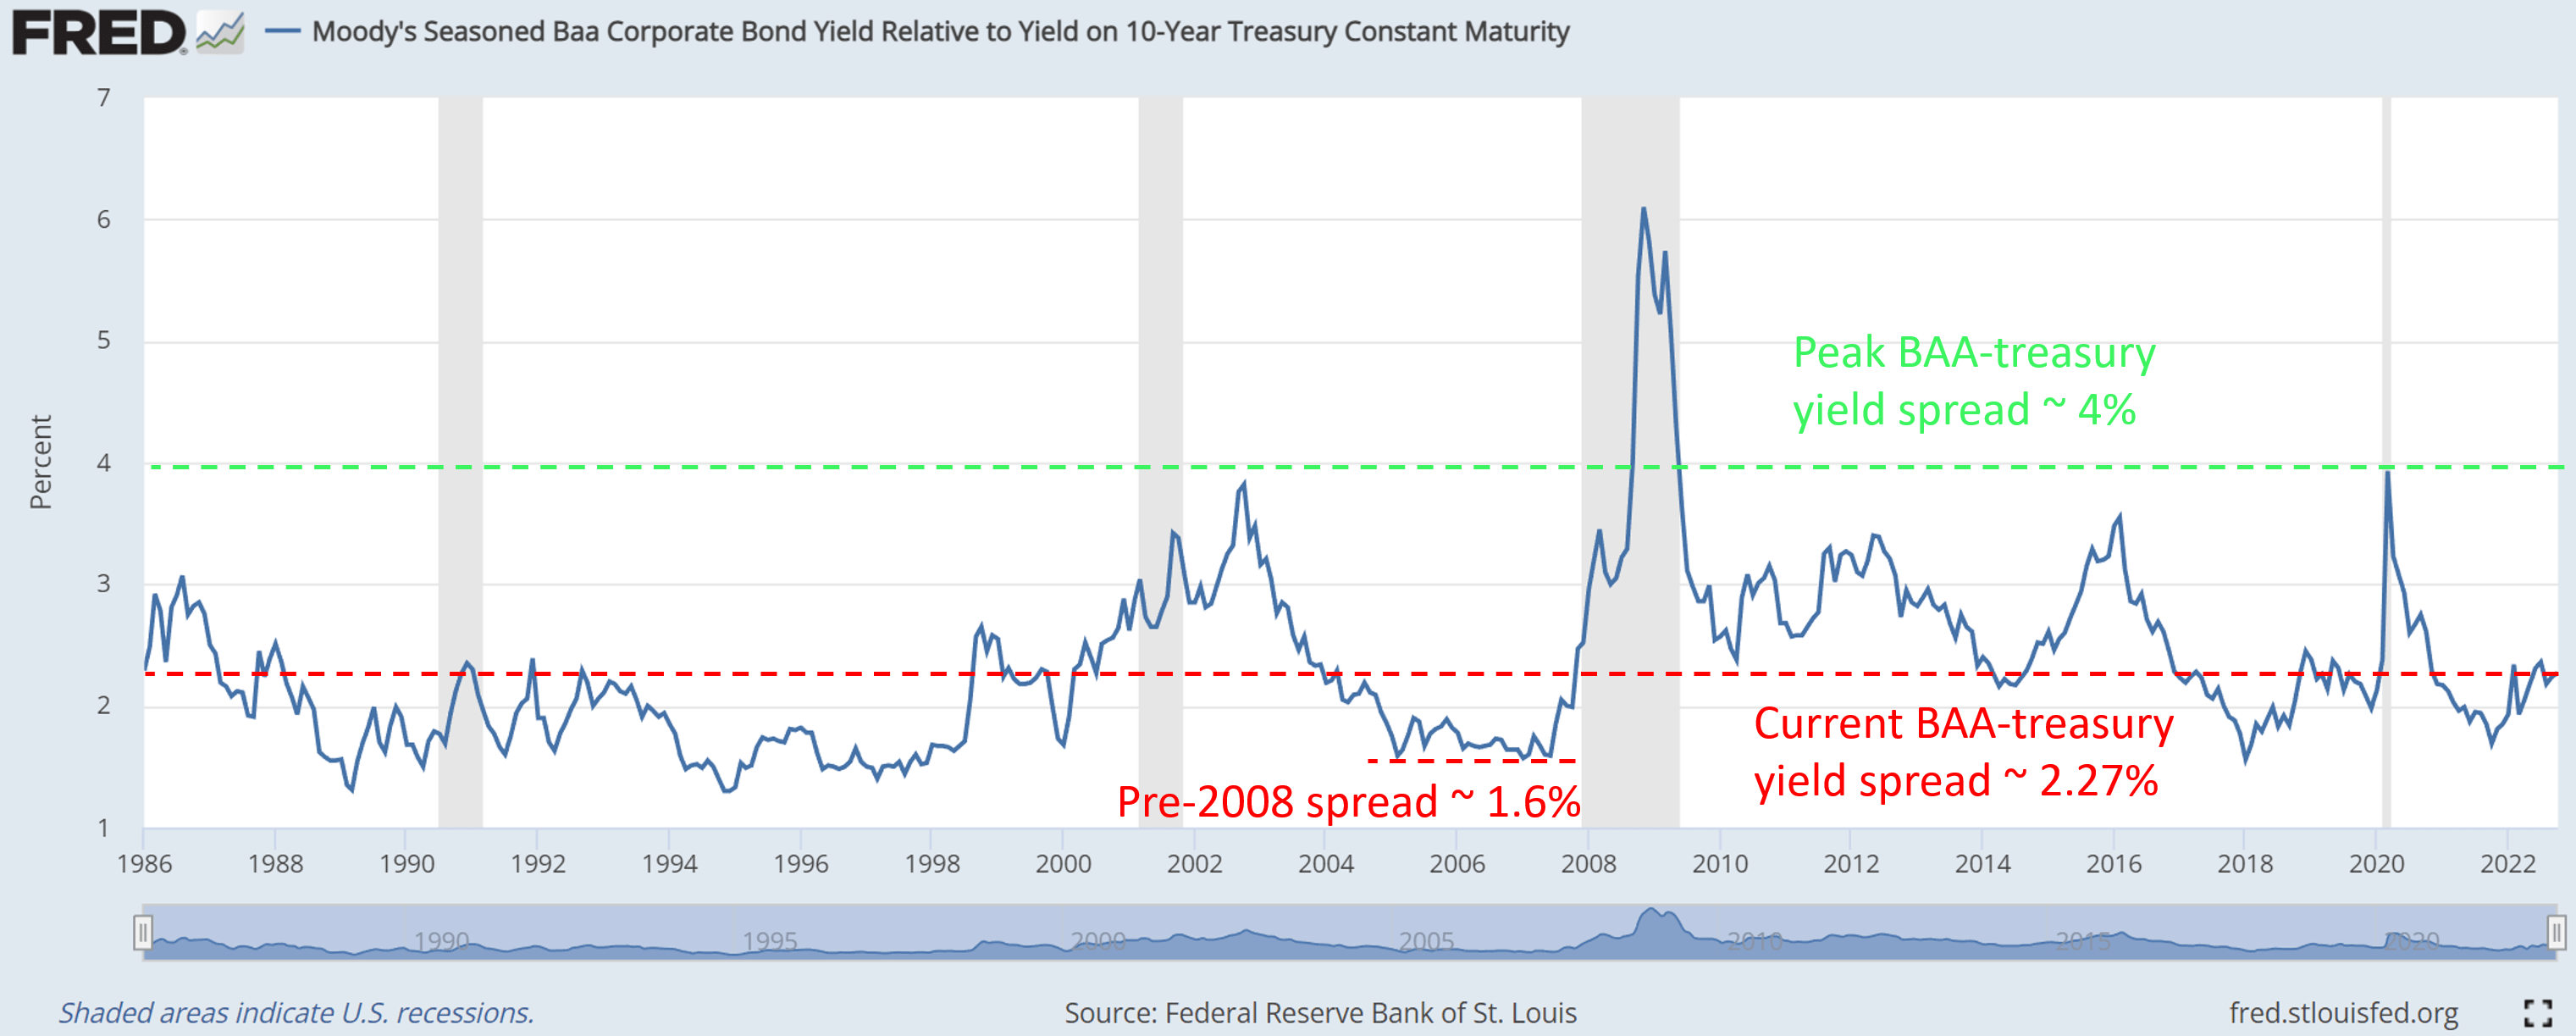
Anti-Lehman signal 2 – Much more manageable debt level
As another anti-Lehman signal, the debt level is also much more manageable than in 2008. Take Consumer Debt as an example. The following chart shows the Consumer Debt Service Payments as a Percent of Disposable Personal Income. Currently, the percentage stands at 5.67%. And as you can see, the percentage was much higher prior to the 2008 crisis. The percentage peaked at 6.73% right after the 2002 recession (almost 19% higher than the current level in relative terms). Even after a continuous decline between 2002 and 2008, the percentage was still 6% right before the 2008 crisis broke out.
Source: FRED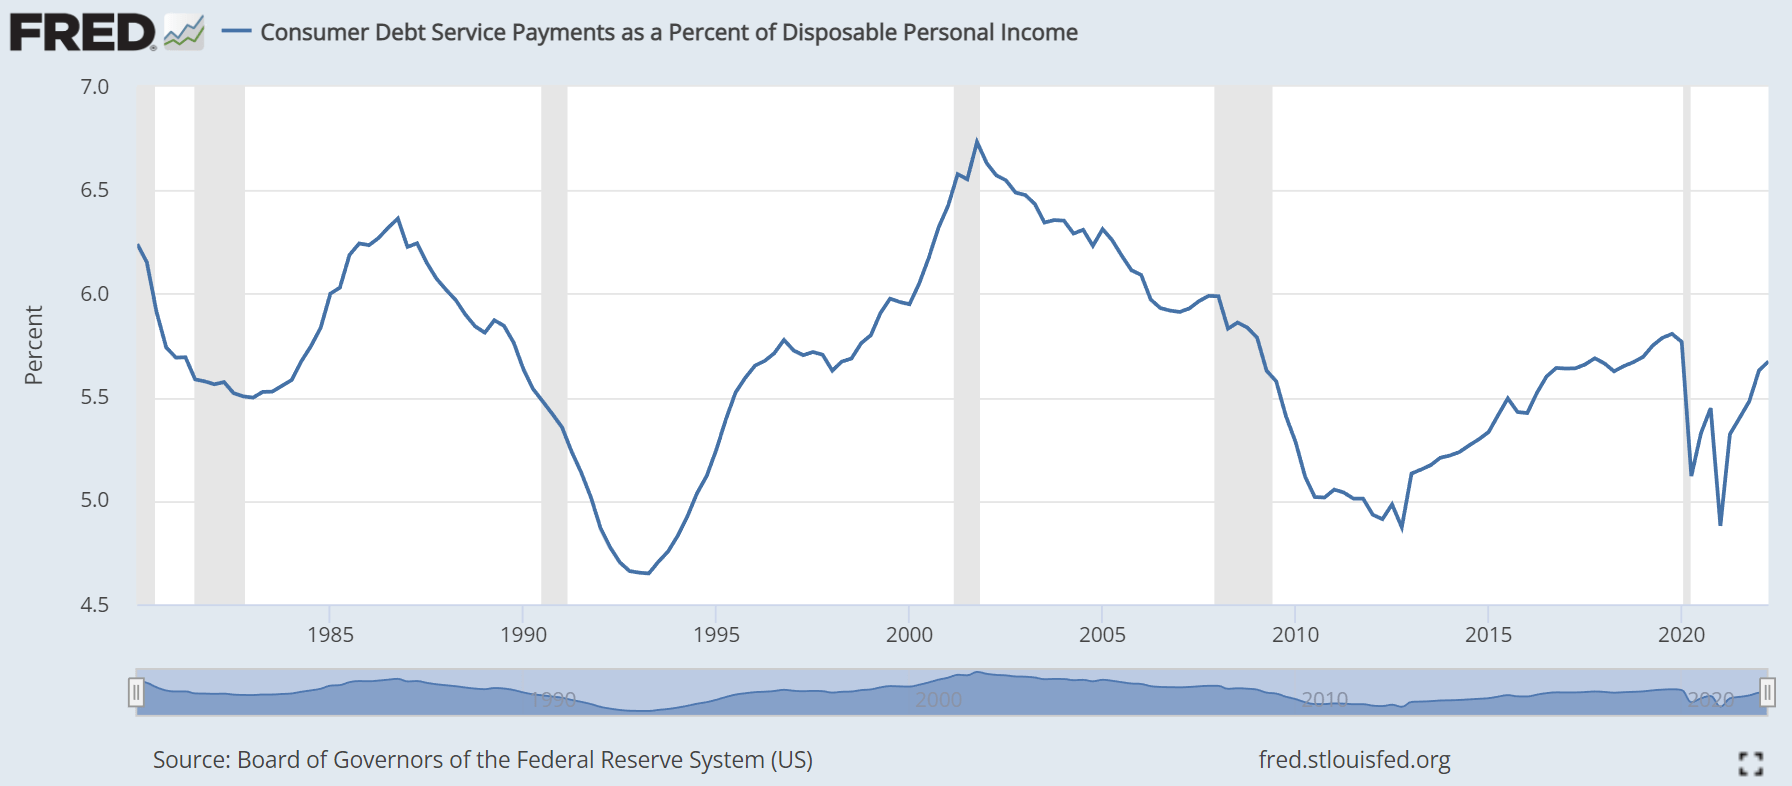
Final thoughts and actionable ideas
All told, I view the CS issues as issues largely restricted CS itself and our current investing landscape as very different from that right before the 2008 crisis. As such, we ourselves are still investing with our “business as usual” allocation model, and we do not suggest you panic either. As detailed in our other articles, our “business as usual” allocation is based on barbell models to completely separate short-term survival risks and long-term risks. Based on this model, here are a few actionable ideas tailored for a spectrum of investors.
For investors whose primary goal is capital preservation, you can tailor your cash position by monitoring a simple exposure index (“EI”) derived from SPY data and 10-year treasury rates. And you are welcome to export the Google sheet we use to monitor the EI at this link. As detailed in an earlier article,
The EI is defined as the summation of SPY dividend yield and 10-year treasury yield, thus providing an overall measure of the opportunity cost of holding cash. If the EI becomes higher, I will reduce cash because I could earn a higher yield either from bonds, or equity, or both. And vice versa. Against this background, you can see that the current EI is quite attractive. And the key trigger points for us are:
- When the EI reaches 6.0%, the highest level since 2010, we will further reduce our cash reserve to a minimum and increase our position either in bonds, or equity, or both.
- And when the EI reaches 7.0%, which is the EI reached during the 2008 Great Recession, we will start increasing our leverage
Source: Author based on Seeking Alpha data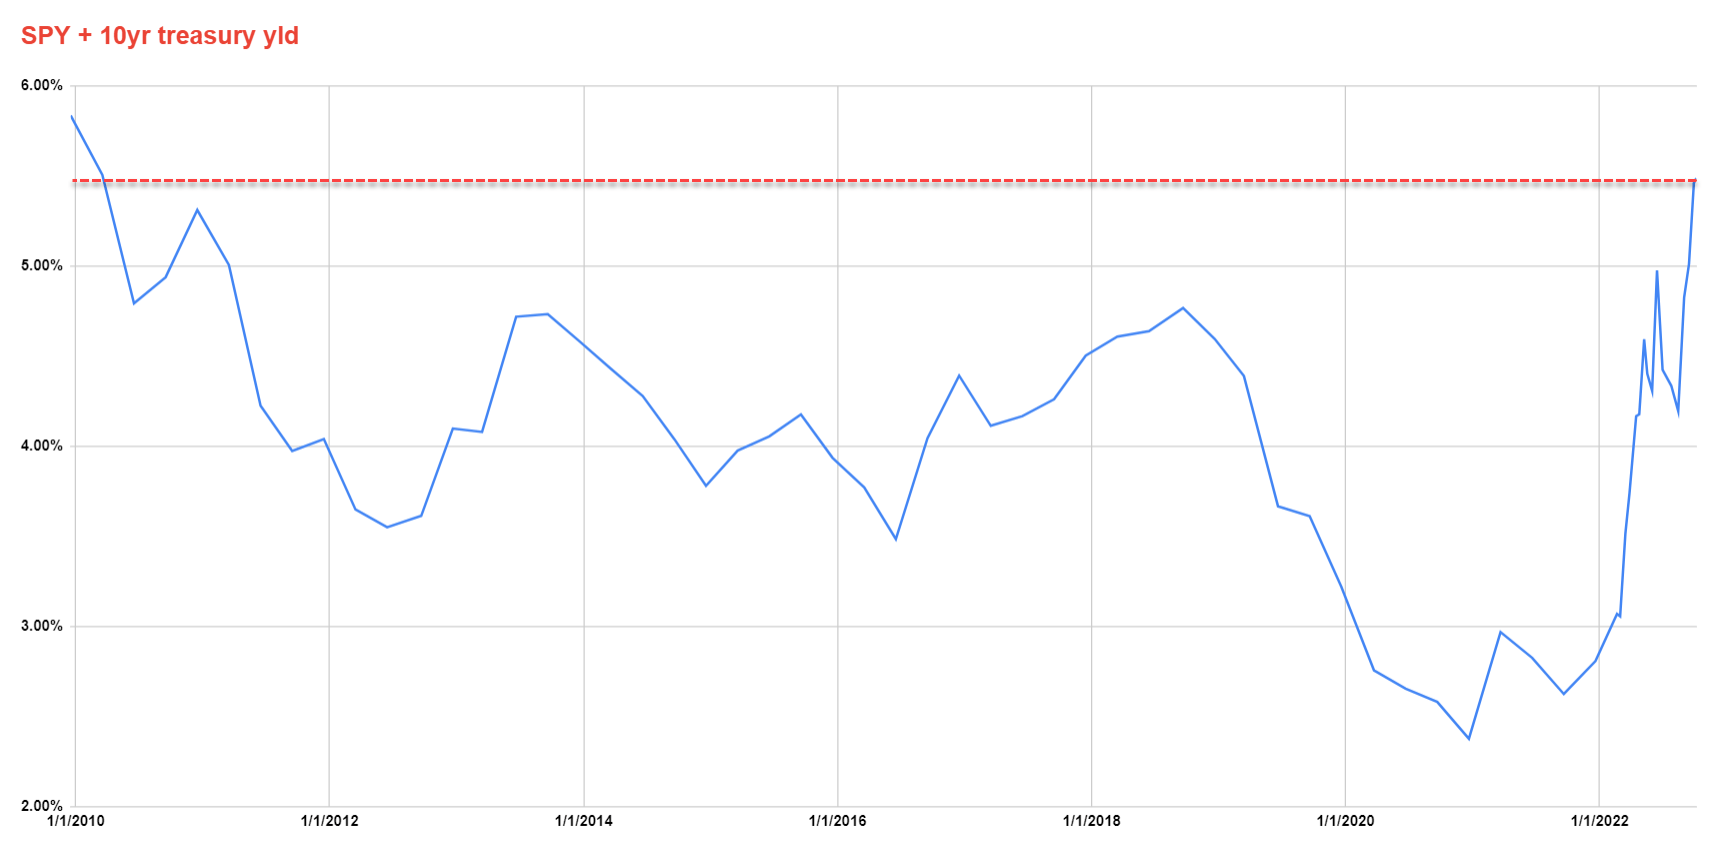
For investors whose goal is current income generation, covered-call strategies appear attractive to us. For example, the Global X Russell 2000 Covered Call ETF (RYLD) currently yields around 15%, almost 50% above its 4-year average of ~10%. Other covered-call ETFs are equally attractive such as QYLD, QQQX, et al. Besides providing generous current income, these funds also feature a thick yield spread against risk-free interest rates, thus providing an effective hedge against inflation and interest rate uncertainties. And lastly, their dividends tend to increase at elevated volatilities, therefore also providing a hedge against market volatility. More details about these funds can be found in our recent article here.
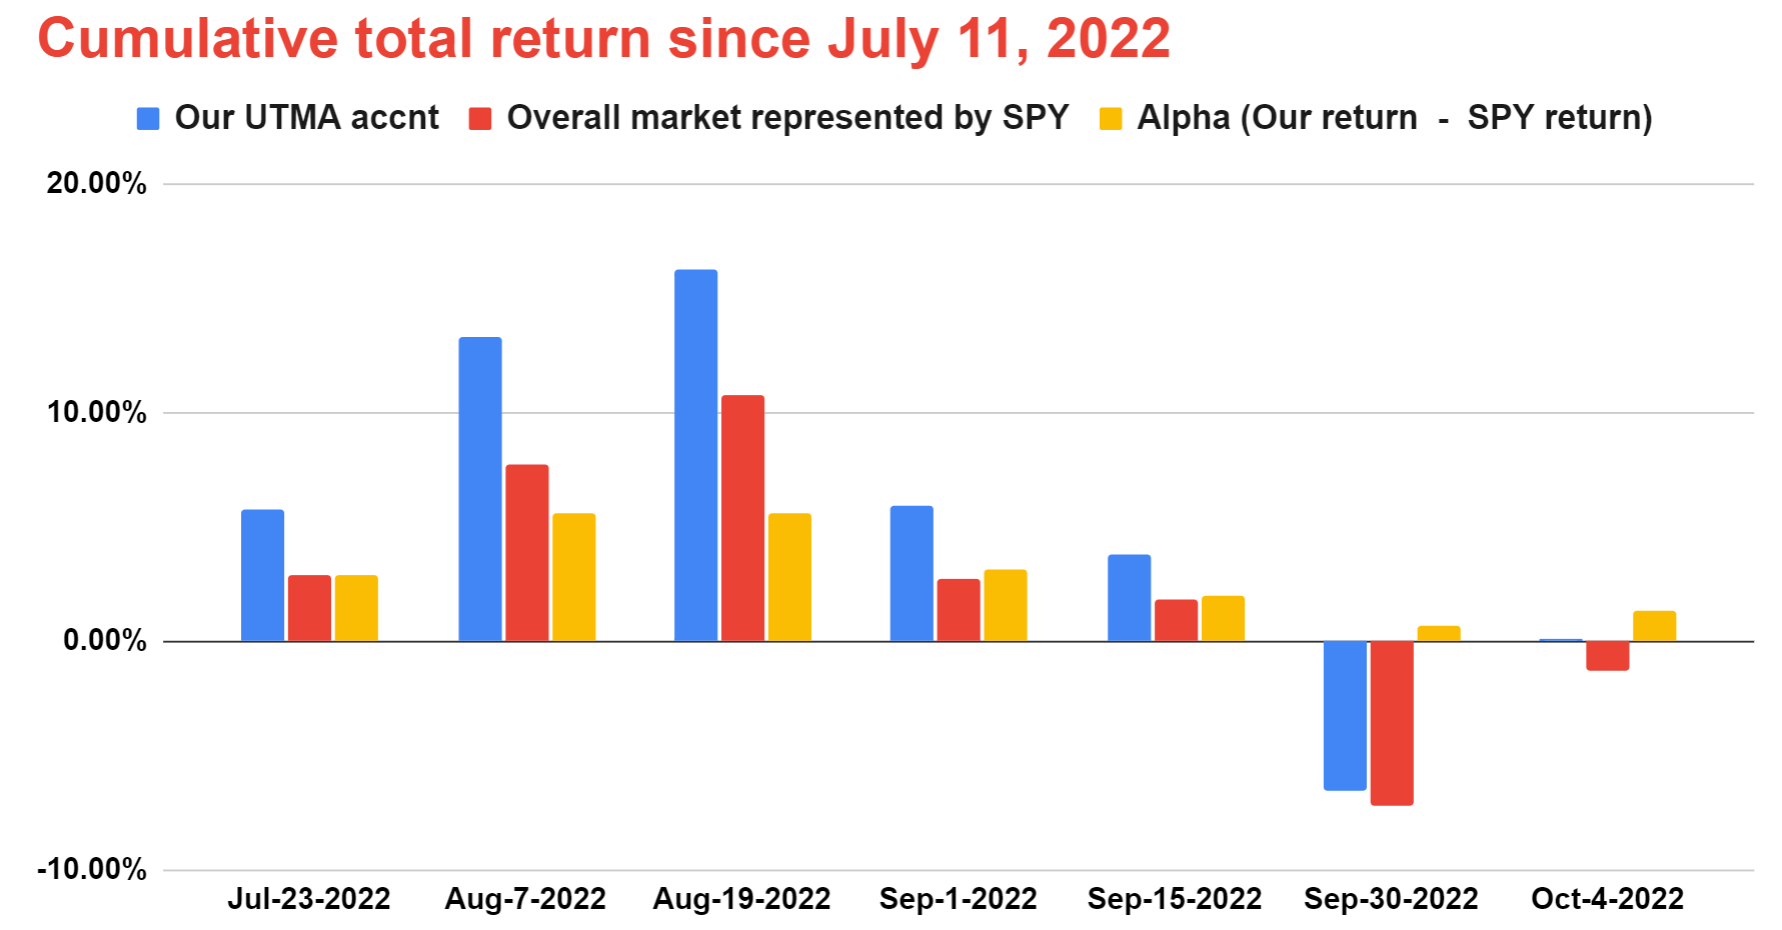
Lastly, for investors whose goal is aggressive growth (we first want to urge you to follow the barbell model and ensure survival first), we suggest a concentrated portfolio of value stocks. Contrary to traditional wisdom, we don’t mind buying deeply cyclical stocks. We actually like buying them near a cyclical bottom valuation, and our view is that the current market condition offers many attractive opportunities here. Our example portfolio, an account we manage for our young son, is shown below. As seen, we hold only 6 stocks and quite a few of them are highly cyclical (MU, ROI, and F). Yet, the portfolio actually suffered lower downside volatility and consistently performed SPY despite the extreme market volatility since July when first published this portfolio.
Source: Author based on Seeking Alpha data Source: Author based on Seeking Alpha data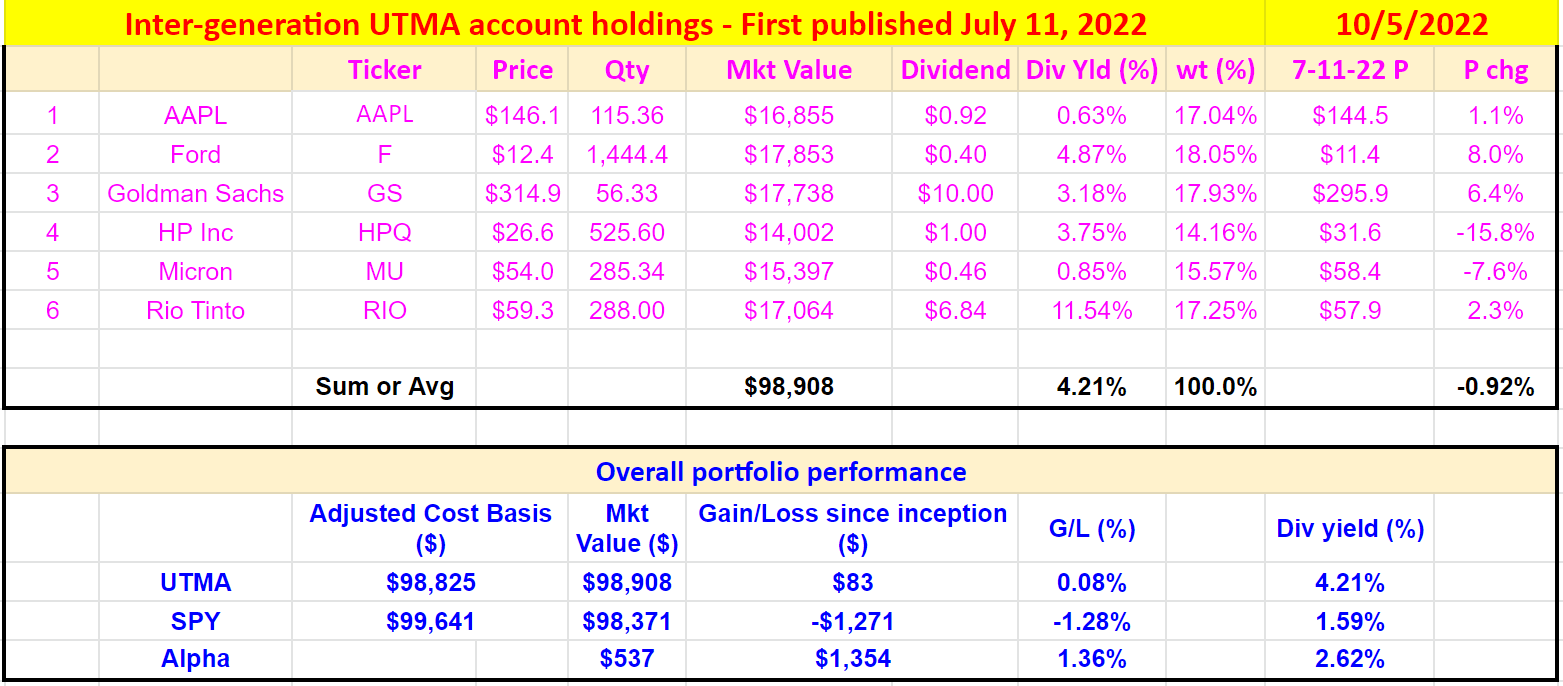
Be the first to comment