


Gwengoat
Any analysis of the economy should start with context surrounding the four corners or four major segments of an economy.
Every economy has income, consumption, production, and employment, and these four segments work together, feeding on each other in a cyclical fashion.
More income leads to increased consumption which requires more production, which demands more employment. Of course, the process can cycle in reverse as well.
We can see that the growth rate of all four corners of the US economy are falling or showing slower rates of growth, but none are negative, which would be indicative of a recession.
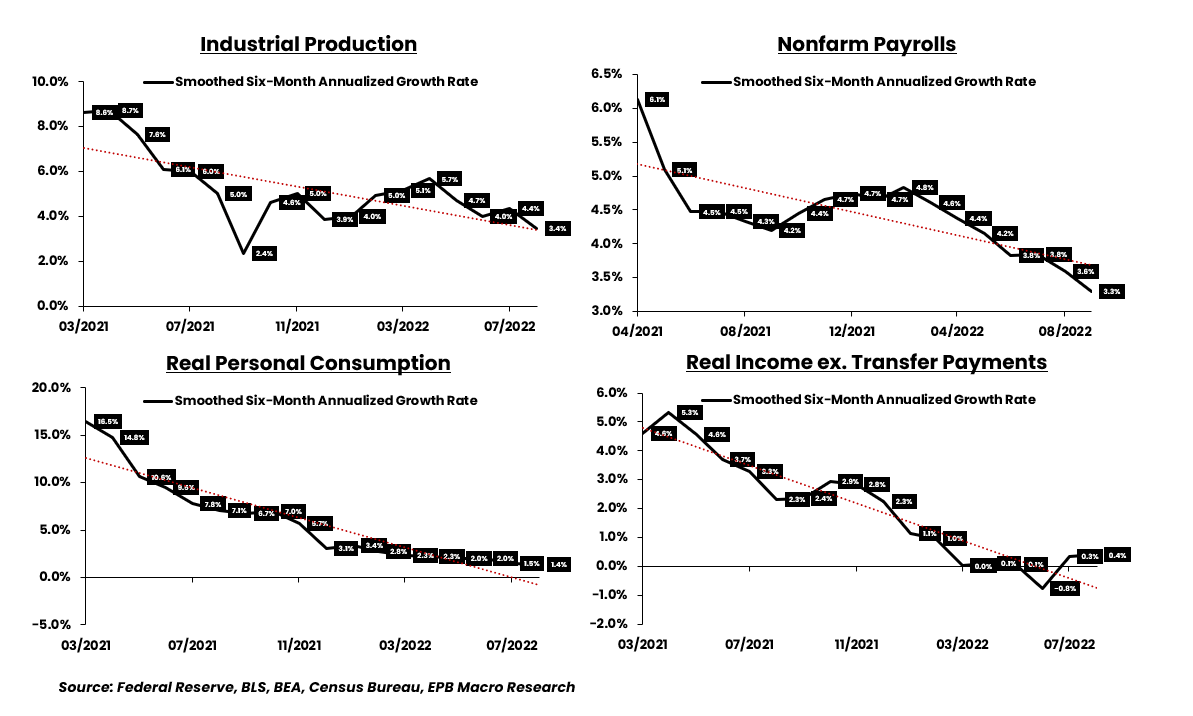
Federal Reserve, BLS, BEA, Census Bureau, EPB Macro Research
This analysis will focus on the recent employment data and will cover everything you need to know about the state of the US labor market.
Most mainstream financial media outlets only report one number to judge the entire labor report, the monthly change in nonfarm payrolls.
In this update, we’ll take a much deeper and more comprehensive look at the entire employment situation.
To start, when analyzing any data point, we almost always look at the data in growth rate form on at least a six-month basis. Month-to-month changes are too noisy, but year-to-year can sometimes move too slowly.
There are three ways to look at the data or three questions to ask:
1) Is the growth rate increasing or decreasing?
2) Is the growth rate above trend or below trend?
3) Is the growth rate positive or negative?
Starting with total nonfarm payrolls, we can see that the growth rate is decreasing, but it is above trend and above zero.
So the labor market, based on this one measure, is softening but is still tight and is certainly not recessionary yet.
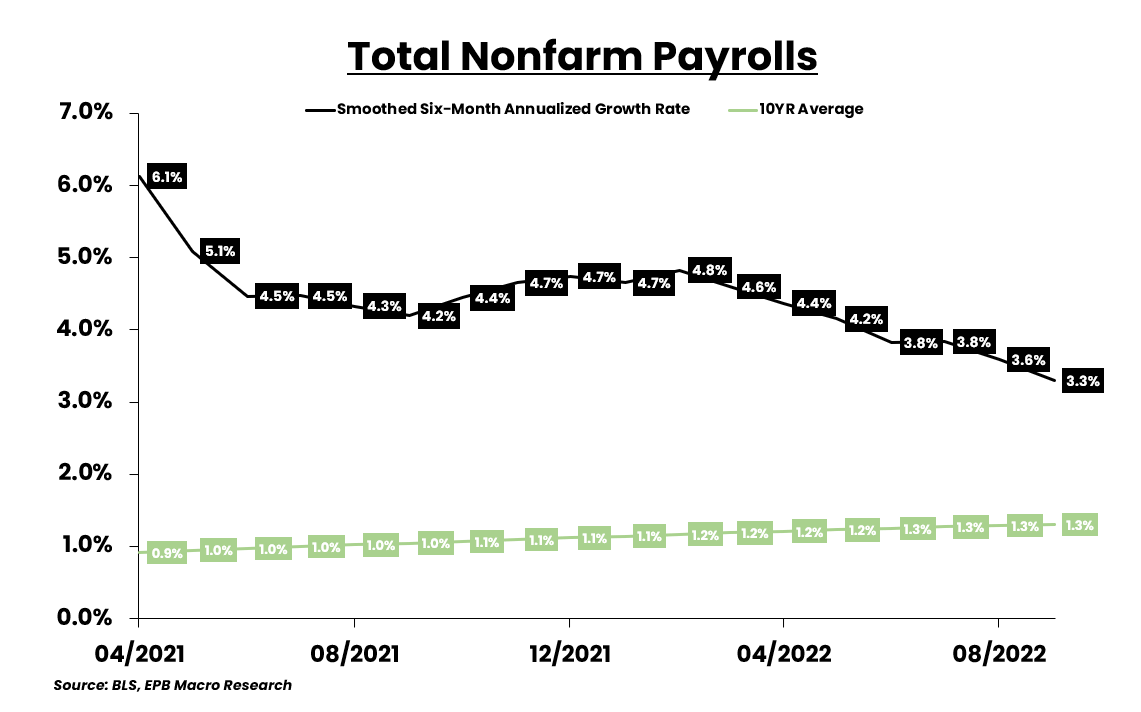
BLS
Not many people are aware, but there’s an alternative measure of employment from the jobs report called the employment level.
Both nonfarm payrolls from the Establishment Survey and the employment level from the Household Survey seek to measure the same thing but with different methodologies.
The employment level only counts multiple job holders once, while nonfarm payrolls count multiple job holders more than once.
The employment level is showing a weaker trend which could be evidence that as the labor market is starting to soften, there has been an uptick in multiple job holders.
Both measures of employment are telling the same story when measured our three ways. Both are showing declining growth but above-trend growth and above-zero growth.
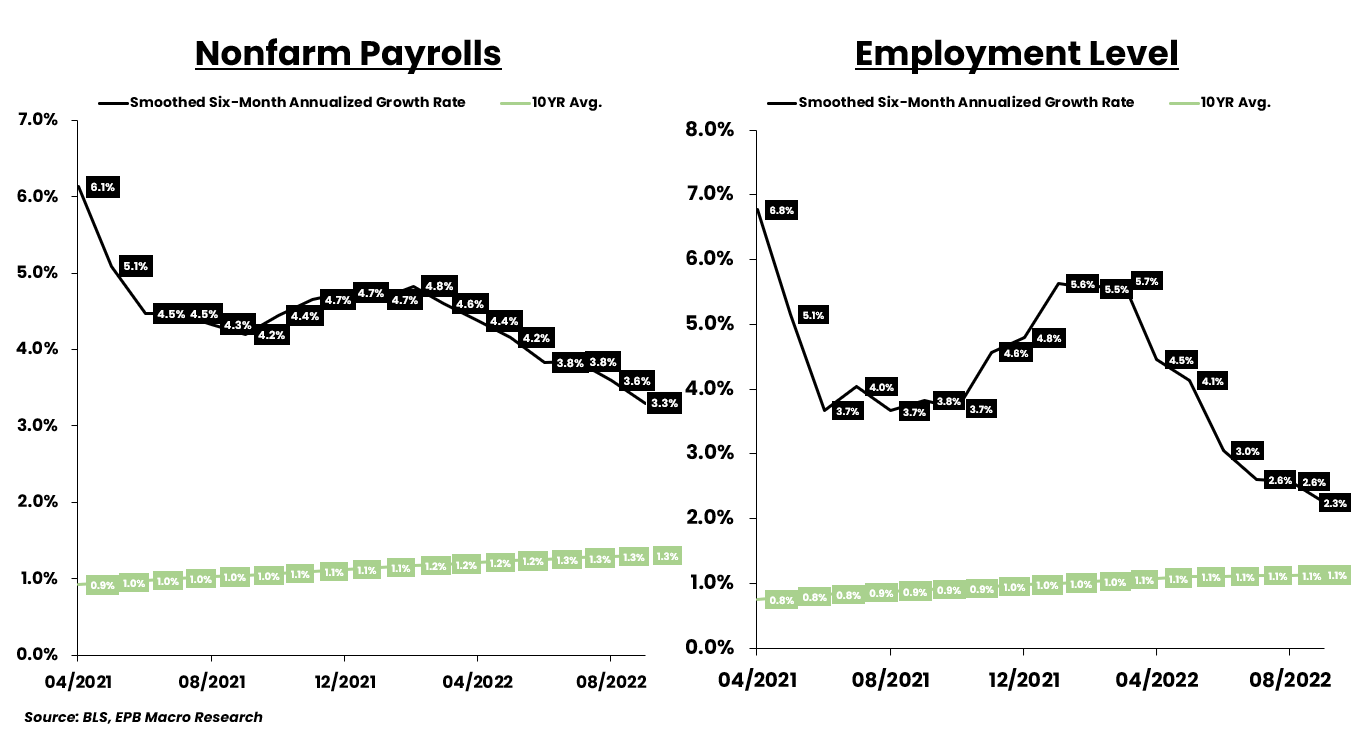
BLS
Digging deeper, we want to focus on cyclical jobs or volatile industries. Construction and manufacturing only make up about 20 million jobs compared to the roughly 150 million total jobs, but most industries are not cyclical and hardly ever suffer layoffs like healthcare and education.
Both the construction and manufacturing sectors were red hot after the COVID boom but are now seeing softening rates of employment growth. Still above trend and above zero, but directionally starting to cool.
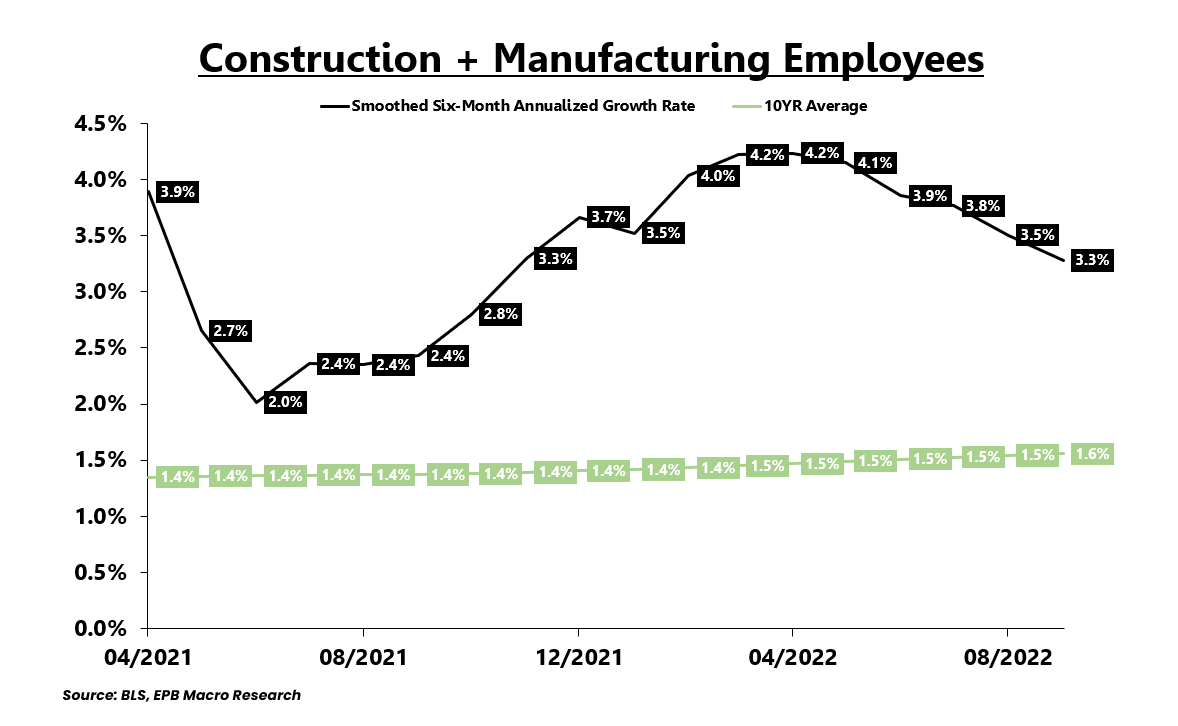
BLS
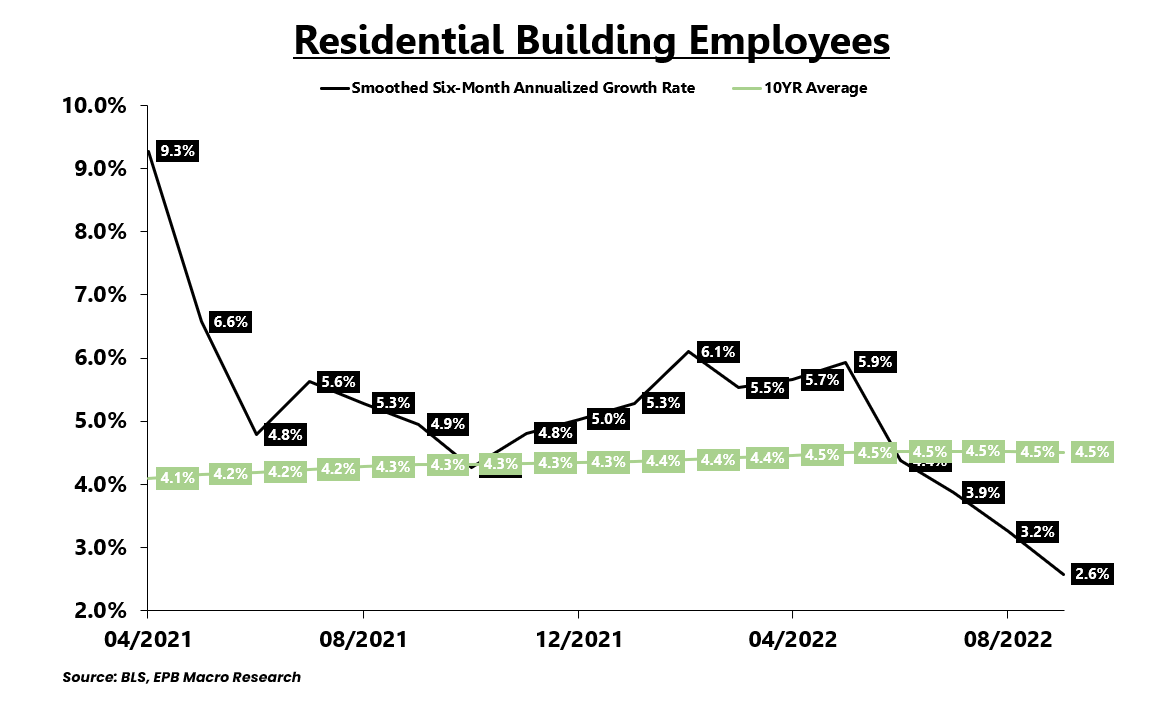
The aggressive Federal Reserve tightening has been hitting the housing market the hardest, as usual, and we can see a major change in the employment growth for residential buildings.
Of the major cyclical areas of employment I track, residential building is the only one that is showing below-trend rates of growth.
So employment growth for residential building is declining, below trend, and closing in on zero.
In fact, over the last four months, residential building employment fell by 1,000 jobs.
BLS
The great thing about the employment report is that we can gather information on another corner of the economy, not just employment.
We also can understand trends in income because the employment report contains data on weekly earnings and hourly earnings.
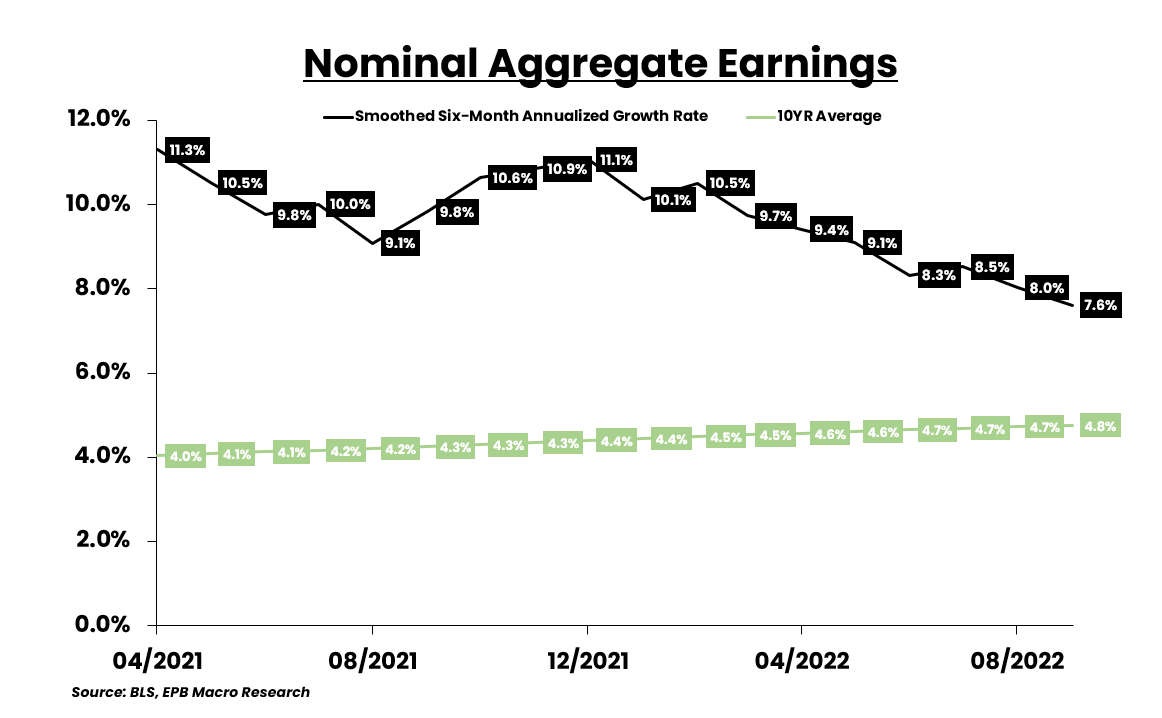
If we look at the total number of private employees times how much they make each week, we can get a sense of nominal earnings growth.
Nominal earnings growth is trending at 7.6%.
The growth rate is cooling from the 2021 peak but is still above trend and way above zero, providing much room for the Fed to squeeze in rate hikes.
BLS
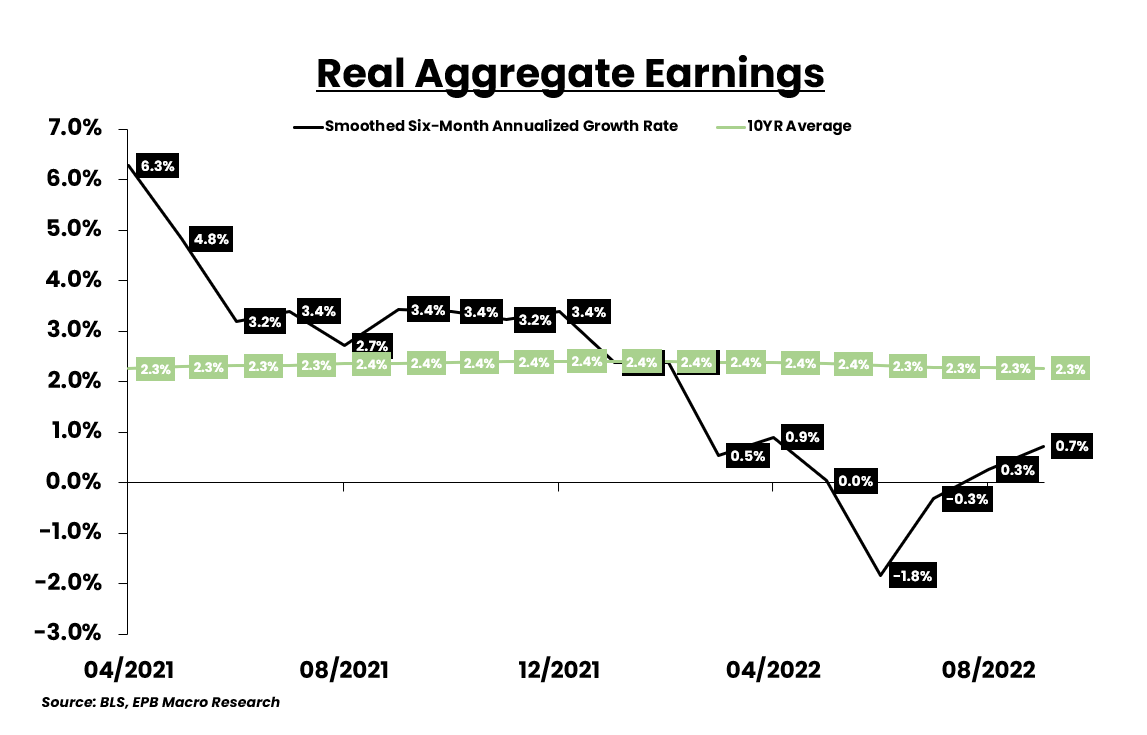
If we adjust that nominal earnings data for inflation, we can see the problem for the economy.
Real income or real earnings growth has downward momentum, fell below trend in late 2021, and is flirting with negative or recessionary territory.
BLS
The employment report is so broad, it can be hard to boil all the information down into one easy-to-understand chart. Everyone tries to do that by quoting one number, the monthly change of nonfarm payrolls, but that is not sufficient.
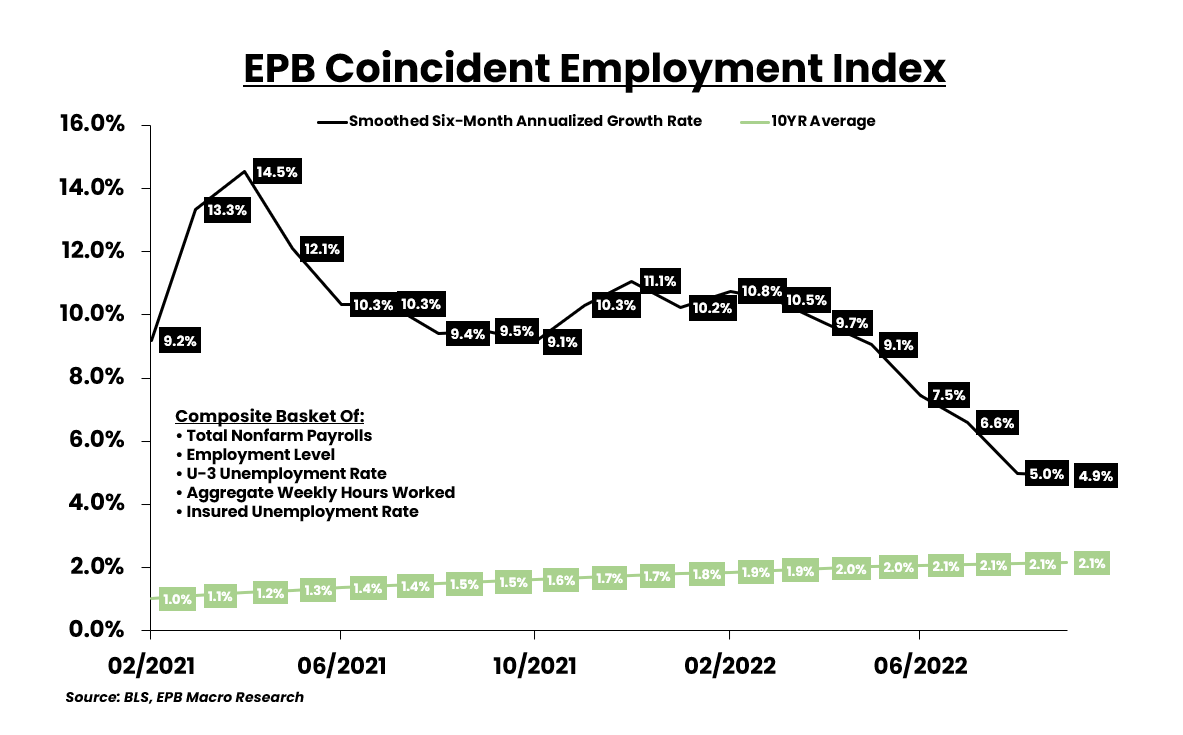
I created a coincident index with five components that provide a much broader and more comprehensive view of the employment situation with data including the number of jobs, the number of hours worked, and the unemployment rate.
Our coincident index of employment is showing declining growth but levels of growth that are still comfortably above trend and well above zero.
The Federal Reserve will therefore continue raising interest rates because their dual mandate is employment and inflation and the most recent coincident data for employment shows the first part of the mandate is not yet at risk.
BLS, EPB Macro Research
Now, coincident data doesn’t tell us where the trend is heading, it only defines the trend as it stands today.
Our leading index of employment is showing a worsening trend which means the downward momentum we are seeing in coincident employment growth will continue.
Our coincident measure of employment growth is declining but is above trend and above zero.
Our leading index of employment growth is declining, below trend, and flirting with the negative territory.
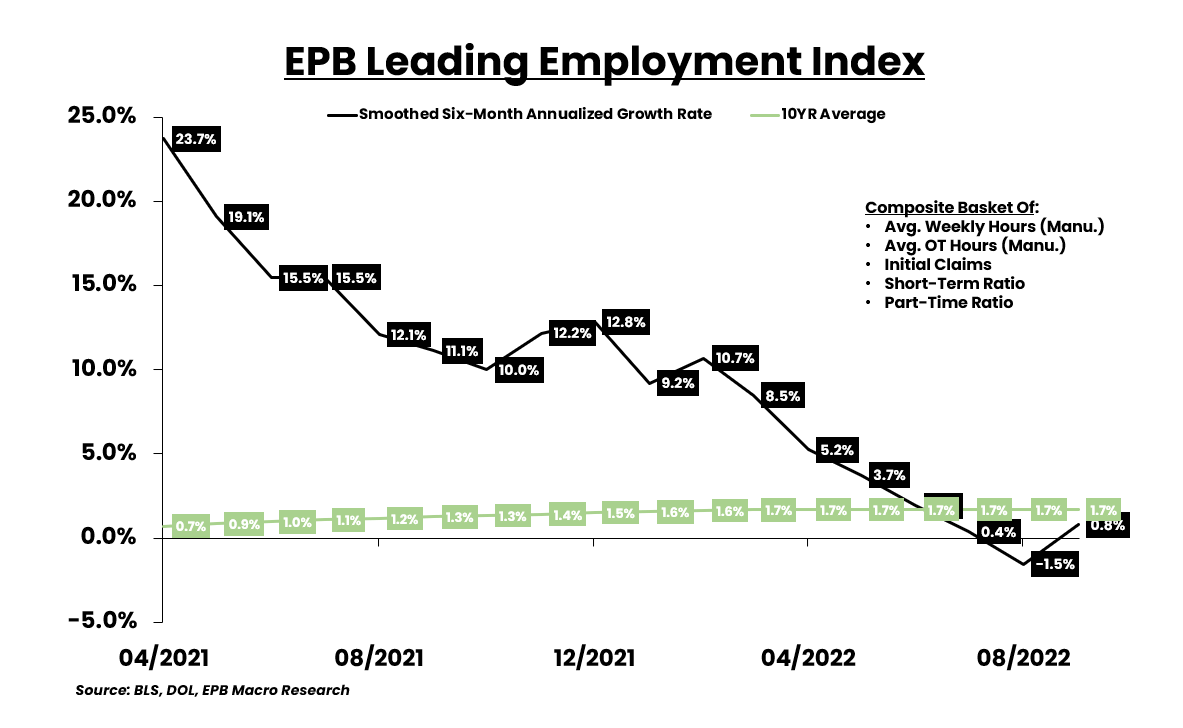
BLS
So the Fed is making progress in its quest to soften the labor market, and the leading indicators tell us that within a few months, the growth rate for coincident measures of employment should keep falling and move below trend.
After the employment data was released, the interest rate market responded appropriately by raising short-term rates and expecting more tightening from the Fed.
The Eurodollar futures market is expecting the Fed to raise interest rates to roughly 4.6% by March 2023, which is exactly what the Fed guided towards in their last Summary of Economic Projections.
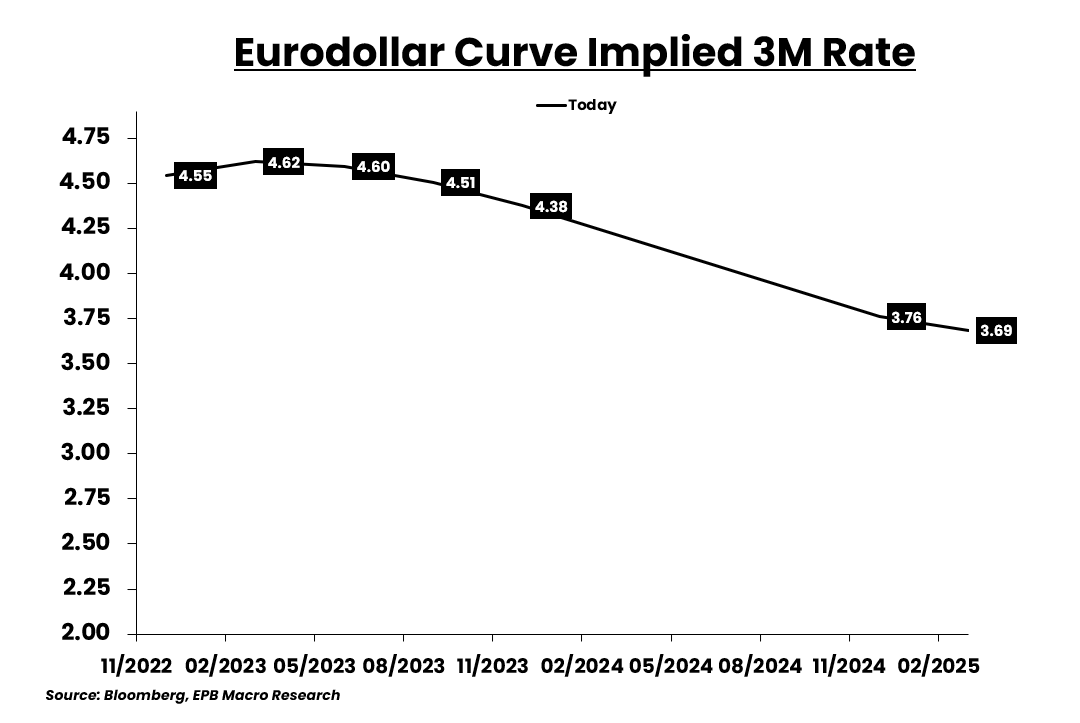
Bloomberg
Stocks declined sharply, as did Treasury bonds. It’s very useful to compare the relative performance between assets, as that often sheds light on a more confusing picture.
The ratio of IWM/TLT is the market’s proxy for nominal GDP growth. If nominal GDP growth was expected to rise, IWM would rise against TLT.
If nominal GDP growth was expected to fall, then IWM would perform worse than TLT, and this ratio would decline.
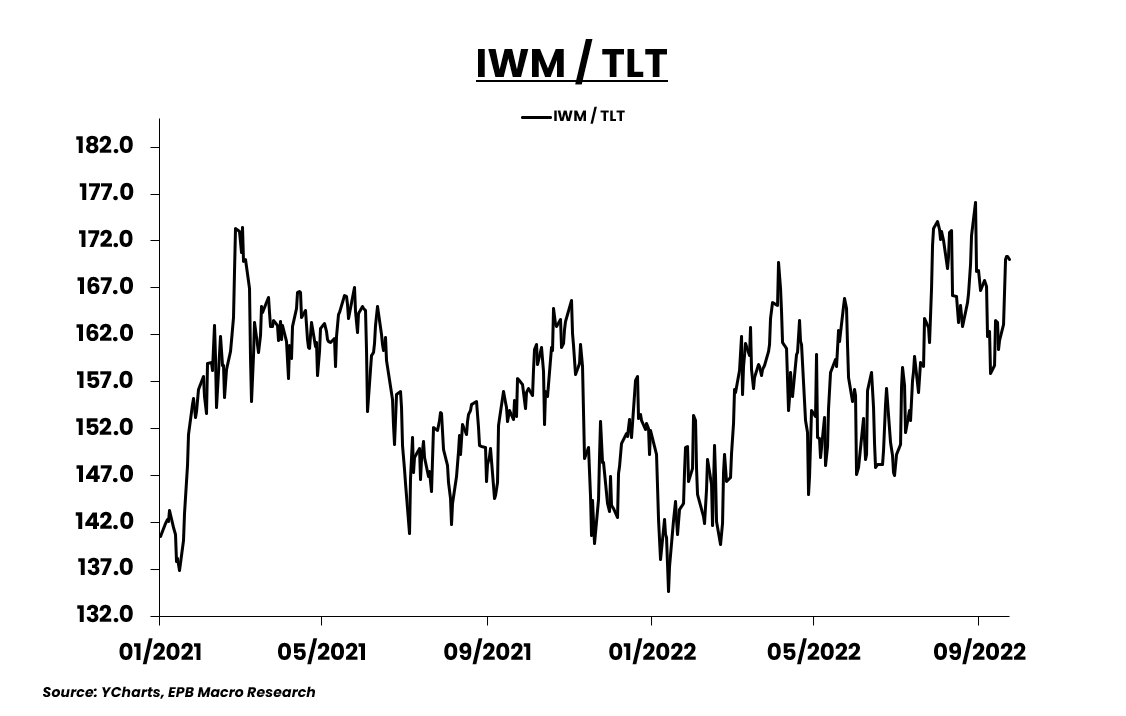
YCharts
If we look at the right-hand chart, we can see that nominal growth or growth + inflation has been trending mostly sideways, mirroring the movement in the ratio of IWM/TLT.
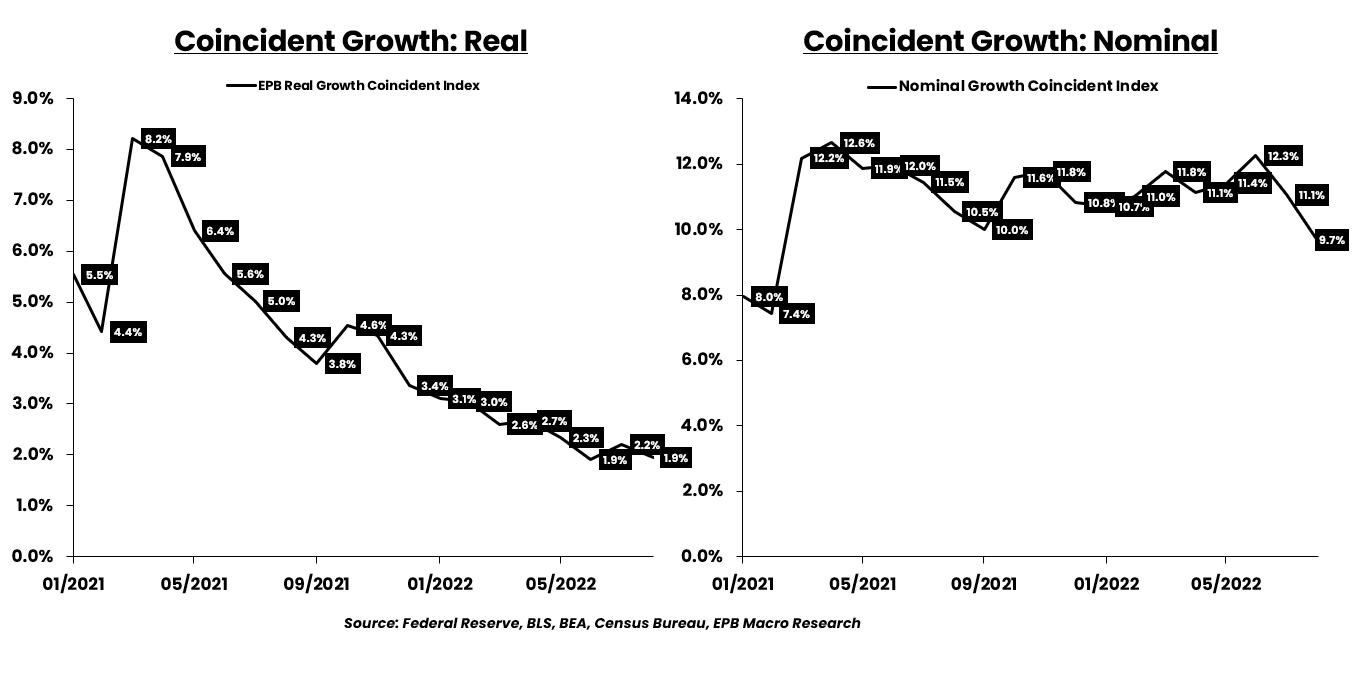
EPB Macro Research
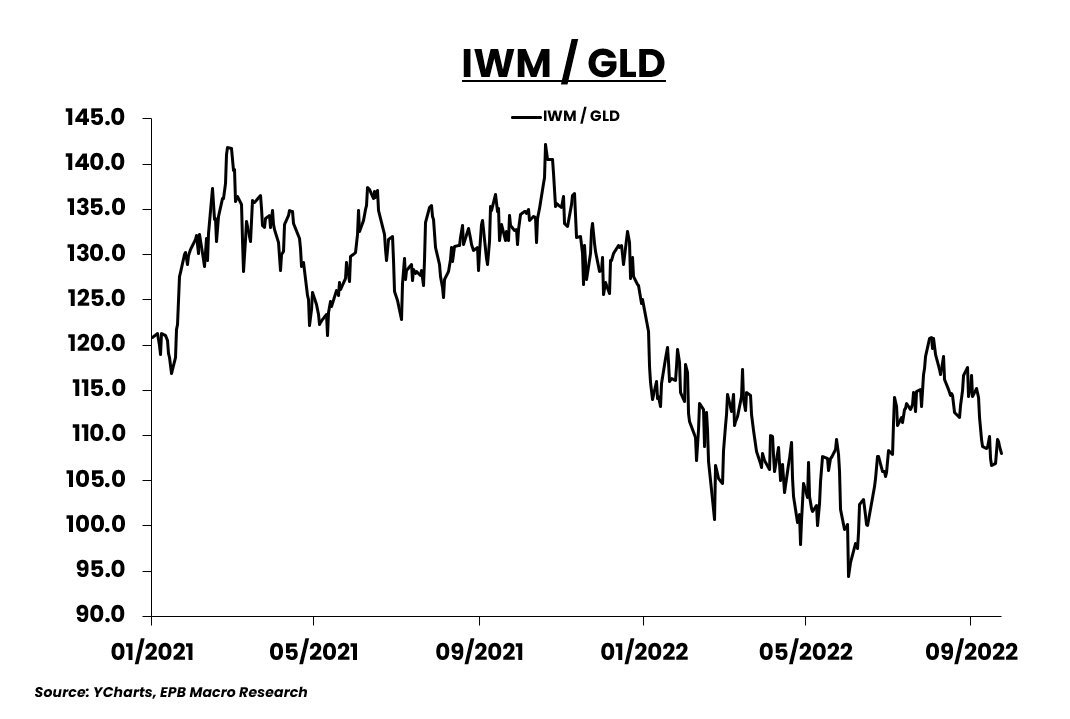
The ratio of IWM/GLD is the market’s proxy for real GDP growth. Increases in inflation should be normalized by gold which is why this ratio helps clarify the market’s view on real growth.
IWM has been falling against GLD since 2021 and is moving back toward the cyclical lows.
YCharts
If we look at the coincident index of real growth on the left, we can see that real growth has been falling much more rapidly, and thus IWM/GLD has been falling much more sharply than IWM/TLT.
EPB Macro Research
Ultimately, the jobs report was bad news for risk assets like stocks.
Employment growth is declining, and economic growth is tumbling under the weight of aggressive monetary tightening, but employment growth is not below trend or negative.
Furthermore, inflation has not been successfully contained yet, so without any hindrance from the employment side of the mandate, the Fed has a green light to continue raising interest rates which will slow economic growth even further.
As a result, IWM/GLD should keep grinding lower.
Eventually, the monetary tightening will cause a recession and break the back of inflation, likely causing a sharp downdraft in the ratio of IWM/TLT. But for now, with the labor market still showing above-trend levels of growth, the market still thinks inflation will remain high for the foreseeable future.
I believe the market is greatly overestimating the path of nominal growth, given the tightening that’s already been done and the tightening that is coming over the next few months.
Be the first to comment