

Ahmed Fahmi/iStock via Getty Images
iShares MSCI Saudi Arabia ETF (NYSEARCA:KSA) is an exchange-traded fund designed to invest in Saudi Arabian stocks. Saudi Arabia is a developed economy and relatively economically complex, ranking at position 32 on the OEC website for economic complexity. However, the country is still largely an oil nation; the country’s largest export category in 2020 was Crude Petroleum at $95.7 billion, followed by Propylene Polymers ($5.28 billion), Acyclic Alcohols ($3.22 billion), Ammonia ($2.09 billion), and Tug Boats ($987 billion). Accordingly, the KSA ETF has some substantial exposures to the Materials sector, although Financials is the largest sector exposure.
iShares.com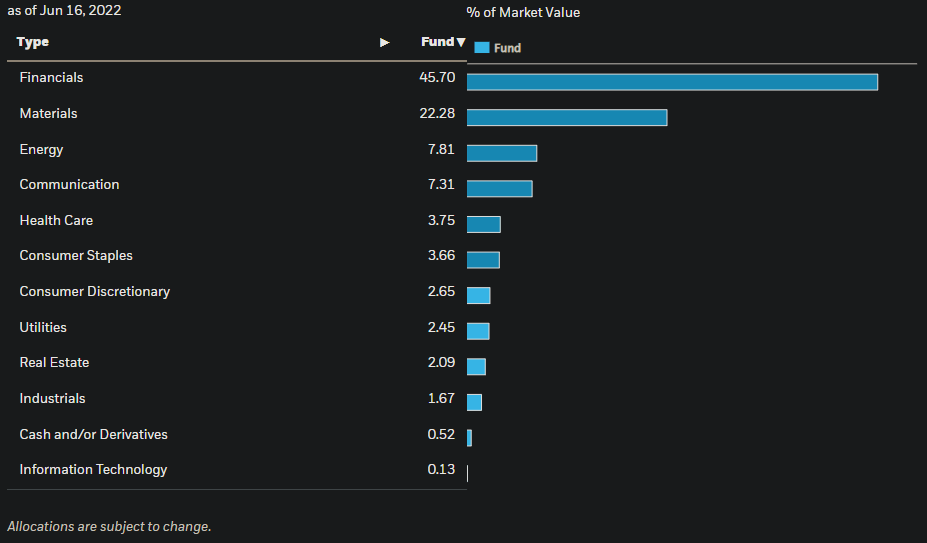
Somewhat surprisingly, at least to me, KSA has 98 holdings in total (as of June 17, 2022). The top 10 holdings make up a substantial portion of the portfolio, as is often the case with various other geographic funds (even the United States). But the fund is not overly concentrated. The top 10 represent about 62% of the overall portfolio.
Data from iShares.com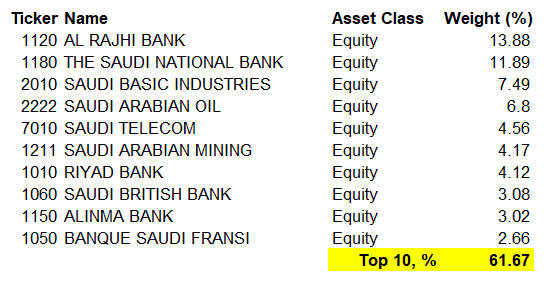
Assets under management were $1.2 billion as of June 17, 2022, and that follows positive net fund flows over the past year of about $327 million. Notice from the chart below that fund flows have been negative, in accord with a global equity market rout that has apparently not spared KSA.
ETFDB.com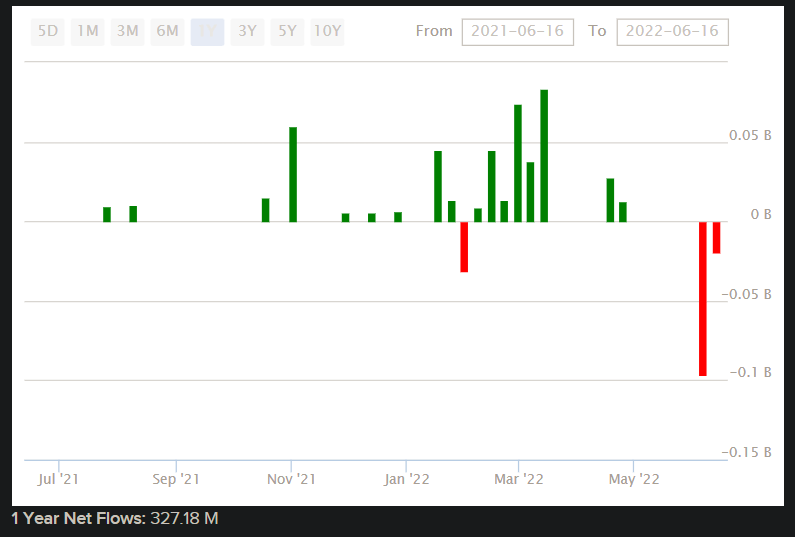
The expense ratio on KSA is quite high, at 0.74%. KSA can out-perform from time to time though; even this year, and even after performing well in 2021, KSA is in positive territory at the time of writing on a year-to-date basis. The same cannot be said for other major equity indices such as the United States’ S&P 500 Index, or for the Nasdaq-100.
KSA seeks to replicate the performance of its benchmark index, the MSCI Saudi Arabia IMI 25/50 Index. As of May 31, 2022, the index had trailing and forward price/earnings ratios of 20.98x and 17.59x, respectively, with a price/book ratio of 2.59x and an indicative dividend yield of 2.08%. The data imply a forward return on equity of 14.72%, and a forward one-year earnings growth rate of 19.27%. The distribution rate of earnings into dividends is implied as being about 44%.
Based on the above data, and using an approximate local 10-year yield of about 4% for the risk-free rate, I present the IRR gauge below. Bear in mind Morningstar have an anticipated three- to five-year average earnings growth rate of about 15.92% at the time of writing, but I am assuming a more modest 8.91% over three years and 6.56% over the five years, in line with a softening/declining return on equity from 14.7% to 12% by our terminal year. I am also keeping the forward earnings multiple constant at 17.59x.
Author’s Calculations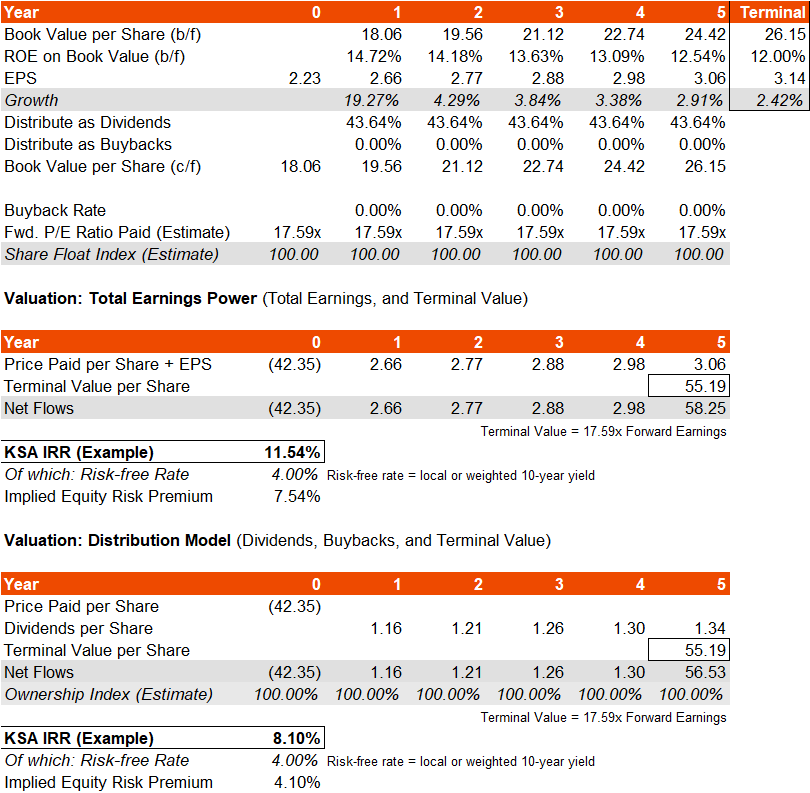
Based on my analysis, KSA’s IRR could be in the region of 8% on the low end, to 11.5% on the high end. The implied underlying equity risk premium is therefore about 4.0-7.5%. On the higher end, that is very constructive, while on the lower end you have the potential for some further downside. For a mature market, I would expect the equity risk premium to be about 4.2-5.0% (with certain exceptions; for example, tech stocks specifically can enjoy very tight risk premiums during bull markets). Saudi Arabia probably does deserve some kind of additional country risk premium on top of that.
Professor Damodaran, as of January 2022, estimated the country risk premium for Saudi Arabia as being 0.70%. Also, KSA has a low beta, which has probably been helped by recent out-performance. So, the additional risk premium required here is possibly quite small; adding 0.70% to a range of 4.2-5.0% gets you to 4.9-5.7%. Therefore, if we value KSA on a total earnings power basis, you could argue that it is undervalued, and potentially due for further upside of as much as 30% (11.54% IRR estimate over 8.9% cost of equity, being comprised of a 4.9% ERP as above, plus the 4% current risk-free rate).
The forward earnings multiple of 17.59x, if we extract from this a forward earnings yield and strip out a range of ERP estimates (plus the risk-free rate), implies a forward earnings growth rate to perpetuity of 1.9-2.5%. For comparison, while Saudi inflation is volatile, it has averaged about 2% over the past 25 years.
TradingEconomics.com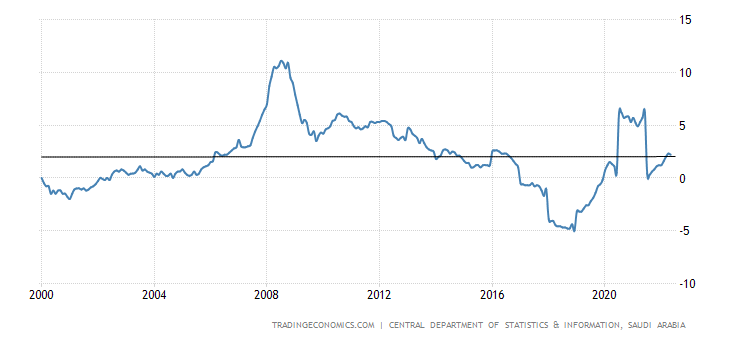
Near-term earnings growth is projected to be firmly in the black, so we can probably justify the current forward earnings multiple. However, while I would generally take a constructive view on KSA at this time, I would not be bullish on the potential for too much earnings multiple expansion. KSA seems like more of a longer-term hold, and if KSA does see another short-term rebound, it may quickly become an opportunistic sell.
Also, while Fidelity research (see chart below) suggests that major economies such as the United States are not even in the later stage of the current business cycle yet, an approaching recessionary phase would likely hit economies like Saudi Arabia harder given their commodity exposures.
Fidelity.com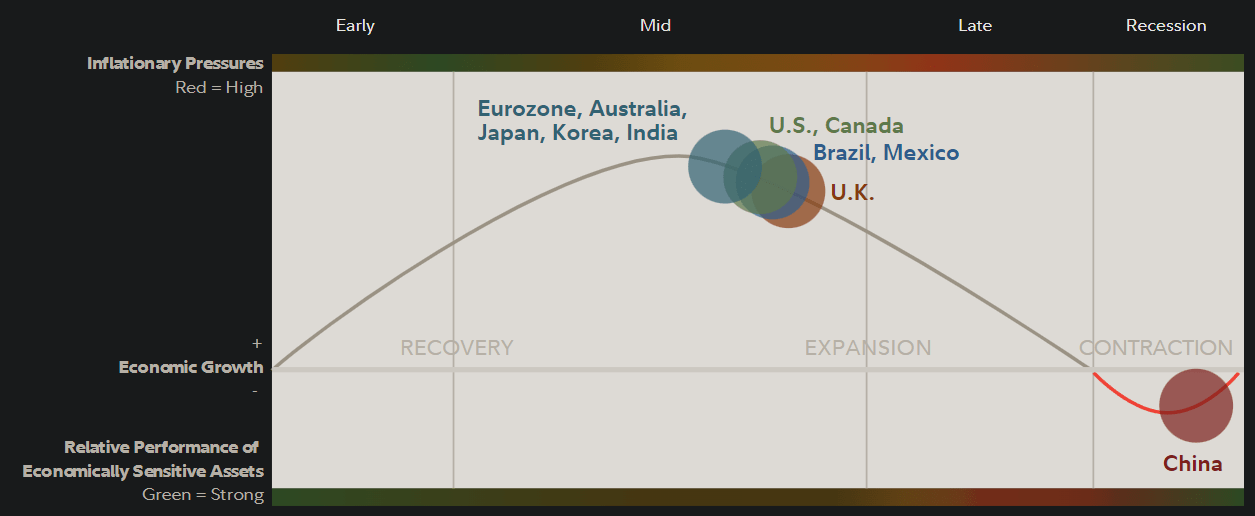
As with my commentary on other ETFs with heavy exposures to volatile markets like commodities and materials, I would be bullish on KSA, but would recommend against making the fund a large position in one’s portfolio.
Be the first to comment