

Parradee Kietsirikul/iStock via Getty Images
2022 is a bad year for the traditional 60/40 portfolio as both equities and bonds are down. A logical solution could be to go short the 60/40 portfolio, but this is of course a risky bet. In the past month, both equities and bonds were up. Another solution is to look for alternative investments like e.g. commodities, real estate, and currencies. A third solution is to a hedge fund like strategy that is somehow a combination of solutions 1 and 2: the trend following approach that is used by managed futures hedge funds.
The most famous managed futures index is the Mount Lucas Index. And there is an ETF that follows this index: the KFA Mount Lucas Index Strategy ETF (NYSEARCA:KMLM).
Trend following performs well when the macro volatility is high. This is currently the case, and we expect this to remain that way. Managed futures are also a very good portfolio diversifier.
The current weakness in the dollar and the lower interest rates caused a drop in the KMLM share price. That’s why it is a good idea to buy the dip in KMLM now.
60/40
2022 isn’t a stellar year for the traditional 60/40 portfolio. Both equities (including real estate) and bonds are down.
Figure 1: Total return chart (Yahoo! Finance, Author)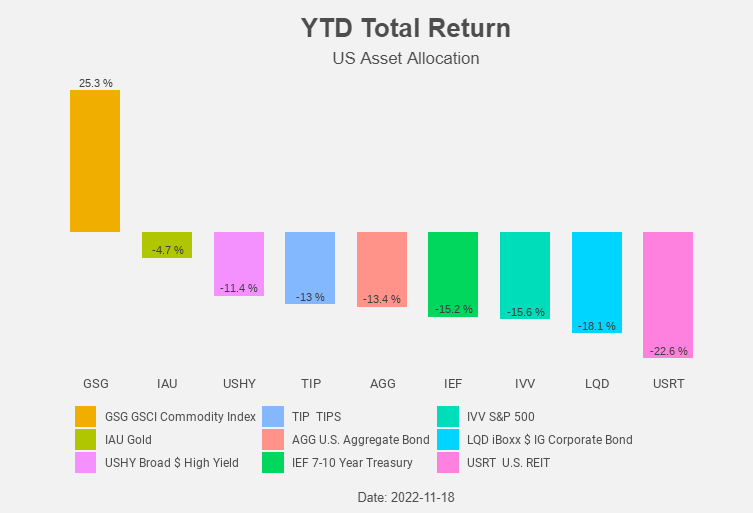
And when we look at the trends, the future isn’t looking bright for equities, bonds, and REITs.
Figure 2: Trend (Yahoo! Finance, Author)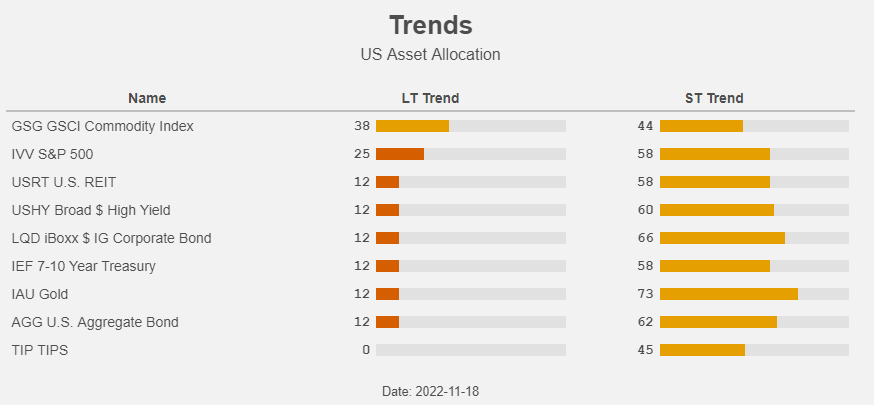
In general, we can say that it’s a good idea to look for strategies that are uncorrelated to the 60/40 portfolio. Commodities are certainly a good idea, and REITs might become interesting after the end of the Fed rate hikes. Another good idea is a so-called trend following approach.
Trend following
Trend following involves taking long and short positions in futures contracts. The contracts can be in currencies, commodities, fixed income, and equities. This strategy is used by so-called managed futures hedge funds. The ability to go long and short allows to benefit from both up-and downtrends in markets. It goes without saying that trend followers perform best when there are clear trends in global markets. This goes often hand in hand with periods of heightened economic volatility as currently is the case.
Mount Lucas Management established already in 1988 the first index to measure the returns to trend following in futures markets: the Mount Lucas Index. And there is an ETF that tracks this index: KFA Mount Lucas Index Strategy ETF.
Trend following may reduce both risk and drawdown when used as a complement to a 60/40 portfolio. Allocating as little as 10% may yield risk-adjusted performance benefits as demonstrated in Figure 3.
Figure 3: Risk return chart (KFA Funds)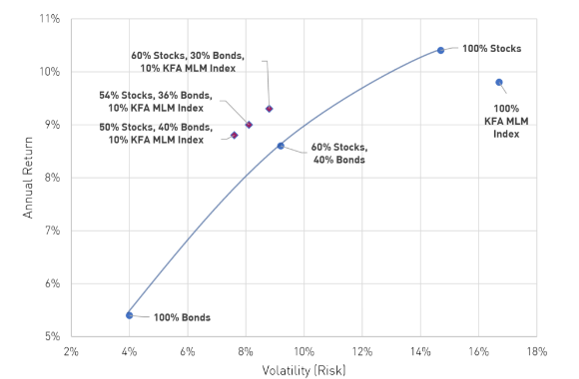
KMLM
KMLM is benchmarked to the KFA MLM Index. It’s a passive, rules-based index that is rebalanced monthly. Of course, the index is at the same time dynamic or active due to its ability to switch from long to short exposures.
Trend following is not only diversifying but also diversified on its own. The KFA MLM Index consists of a portfolio of 22 liquid futures contracts traded on U.S. and foreign exchanges. The index includes futures contracts on:
- 11 commodities,
- 6 currencies, and
- 5 global bond markets.
These three baskets are weighted by their relative historical volatility, and within each basket, the constituent markets are equally weighted.
Figure 4 shows the current exposures in commodities, currencies, and bond markets, as well as the exposure range. The commodity exposure is almost neutral while the exposure in currencies and bonds is very short.
Figure 4: Sector exposures (KFA Funds)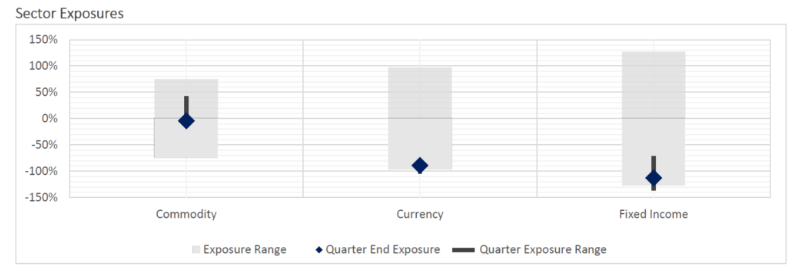
The current commodity exposures are a mix of long and short positions in base and precious metals, agricultural and energy commodities.
Figure 5: Commodity exposures (KFA Funds)
The fund is short the major currencies and hence long USD. And we all know how well the dollar is performing this year!
Figure 6: Currency exposures (KFA Funds)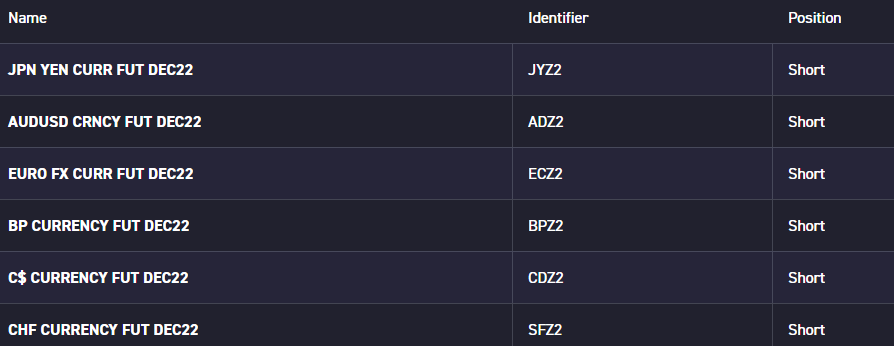
The fund is also short all the major global treasury bond markets. Given the rising rates (and falling bond prices) around the world, this was a major contributor to the excellent performance of KMLM this year.
Figure 7: Fixed income exposures (KFA Funds)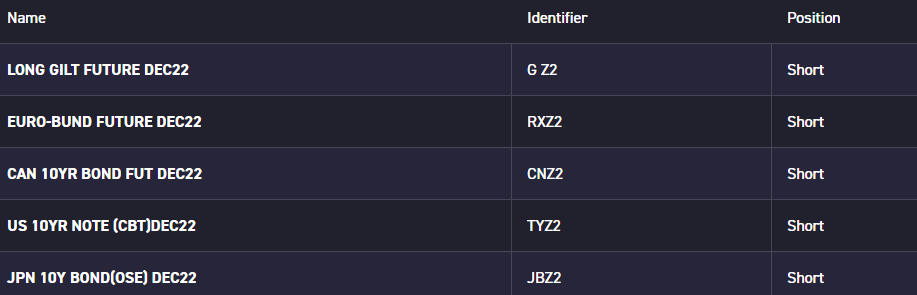
KMLM has an expense ratio of 0.90%.
Trend following performs well when the macro volatility is high, as is currently the case. And this is reflected in the returns so far this year. KMLM is even outperforming commodities!
Figure 8: Total return chart (Yahoo! Finance, Author)
In the past month, the return was less stellar. The weakness in the dollar and the lower treasury rates are to blame for this drop in the KMLM share price.
Figure 9: Total returns (Yahoo! Finance, Author)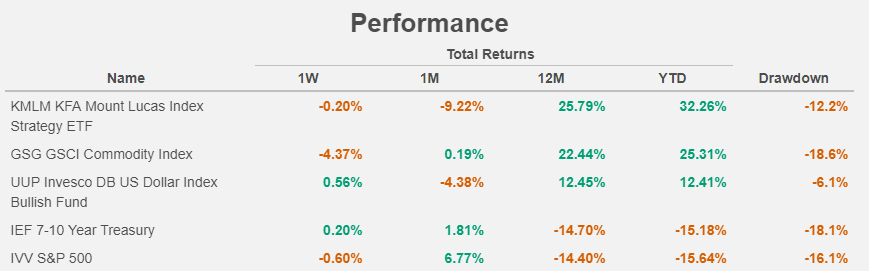
The trend for equities and bonds is still down. Commodities are in neutral (as is the commodity exposure in the fund) and the dollar is still in a clear uptrend.
Figure 10: Trend (Yahoo! Finance, Author)
KMLM fell back to its 200-day moving average and is (close to) oversold. A nice moment to pick up some shares.
Figure 11: Total return chart (Yahoo! Finance, Author)
What could go wrong?
Trend following performs best when there are clear trends in the markets, like this year. This often coincides with economic or macro volatility.
Research by AQR shows how the period of low macro volatility in the 2010s led to a poor performance for trend following. A return to those circumstances would be bad news for KMLM, but this would require a quick moderation in inflation, and this will not occur overnight.
Figure 12: Macro volatility and trend performance (AQR)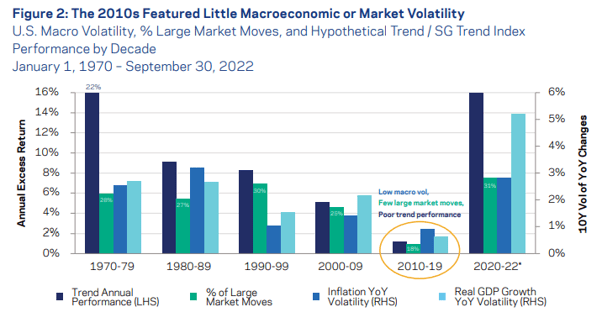
According to AQR, there is a reasonable chance that the high macro volatility trend will continue. Periods of significant macro volatility tend to be followed by continued elevated macro volatility. Good news for trend followers.
Figure 13: Macro volatility persistence (AQR)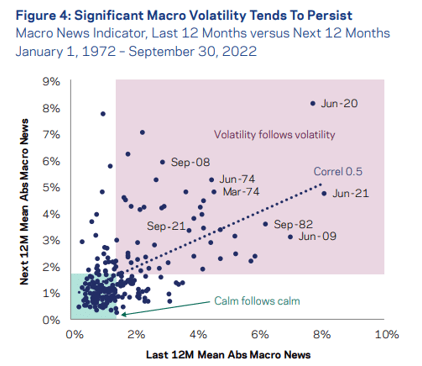
Conclusion
2022 is a bad year for equities and bonds. Commodities perform well, but trend following strategies perform even better. Trend following performs well when the macro volatility is high. This is currently the case, and we expect it to remain that way. The current weakness offers a nice entry point for the KFA Mount Lucas Index Strategy ETF: buy!
Be the first to comment