

RiverNorthPhotography/iStock Unreleased via Getty Images
The fifth installment of my regional bank analysis covers KeyCorp (NYSE:KEY), a Cleveland, Ohio-based bank holding company with $187 billion in assets (Q2) and branches in 15 states across the northeast, upper Midwest and Western portions of the United States. An interesting point about the company’s geographic footprint is that in the 1970s and 1980s, there was a concerted effort to prevent the banks based in New York, where the company was at the time, from acquiring New England-based banks. To counter that effort, the company’s CEO at the time, Victor Riley, looked to the West. Correctly anticipating that the Asian trade would continue to pick up and the western states’ economies would strengthen, the bank went on a shopping spree. It bought western banks, which were cheaper than those in the East. Furthermore, the bank focused on low population areas, while other banks focused on larger cities. By doing so, the bank avoided the pricing wars that were typical of more competitive markets.
KeyCorp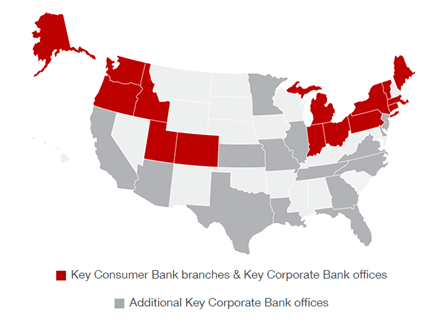
While the company’s headquarters remained in Albany, the bank was expensive to manage across such a wide region. However, one benefit of picking up smaller banks in rural regions was that personnel usually stayed with the acquired banks, which helped maintain strong customer relationships. This relatively conservative mindset served the company well as it continued to thrive in the 1990s, even through the thrift crisis.
The company became much more acquisitive under the helm of Robert Gillespie. His actions in the 1990s and early 2000s established the basis for the regional banking powerhouse that KeyCorp is today.
Income Statement
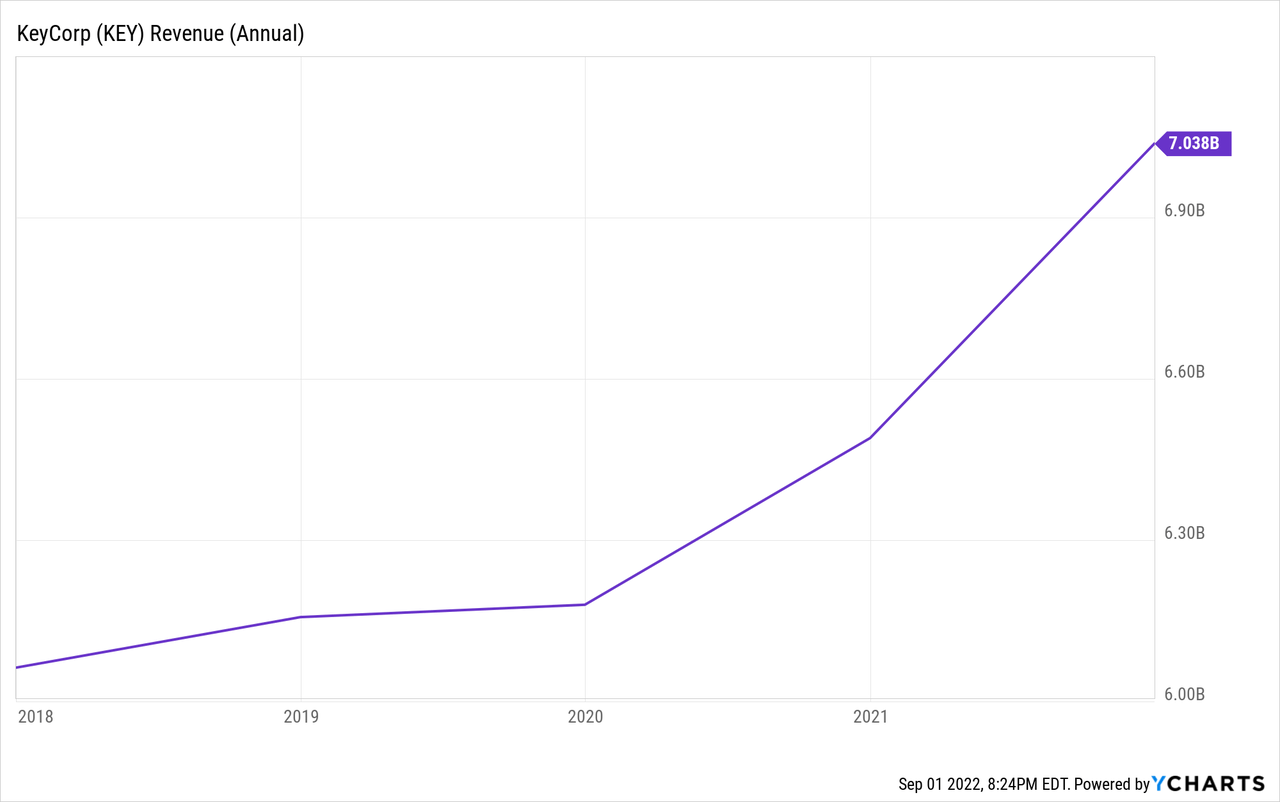
KEY has a very strong history of generating solid revenue growth. Even during the shutdown of 2020, the company still managed to increase revenues 5%. Looking at the bigger picture, the company has produced non-interest revenue growth of 9.1% annually over the past five years. Growth has been led by investment banking and the cards/payments business. One thing to point out here is that while the majority of the bank’s revenue is from net interest income, this bank has much more revenue from non-traditional banking businesses than its peers. Over the past five years, non-interest revenues averaged 40% of total net revenues. Coming off the quarantined year of 2020, the company managed 20% growth in non-interest revenues. All segments produced very strong growth.
2022, however, has been somewhat of a disappointment, with a year-to-date decline in non-interest revenues of 8.3%. Investment banking, cards/payments, and mortgages all led the decline with heavy double-digit decreases.
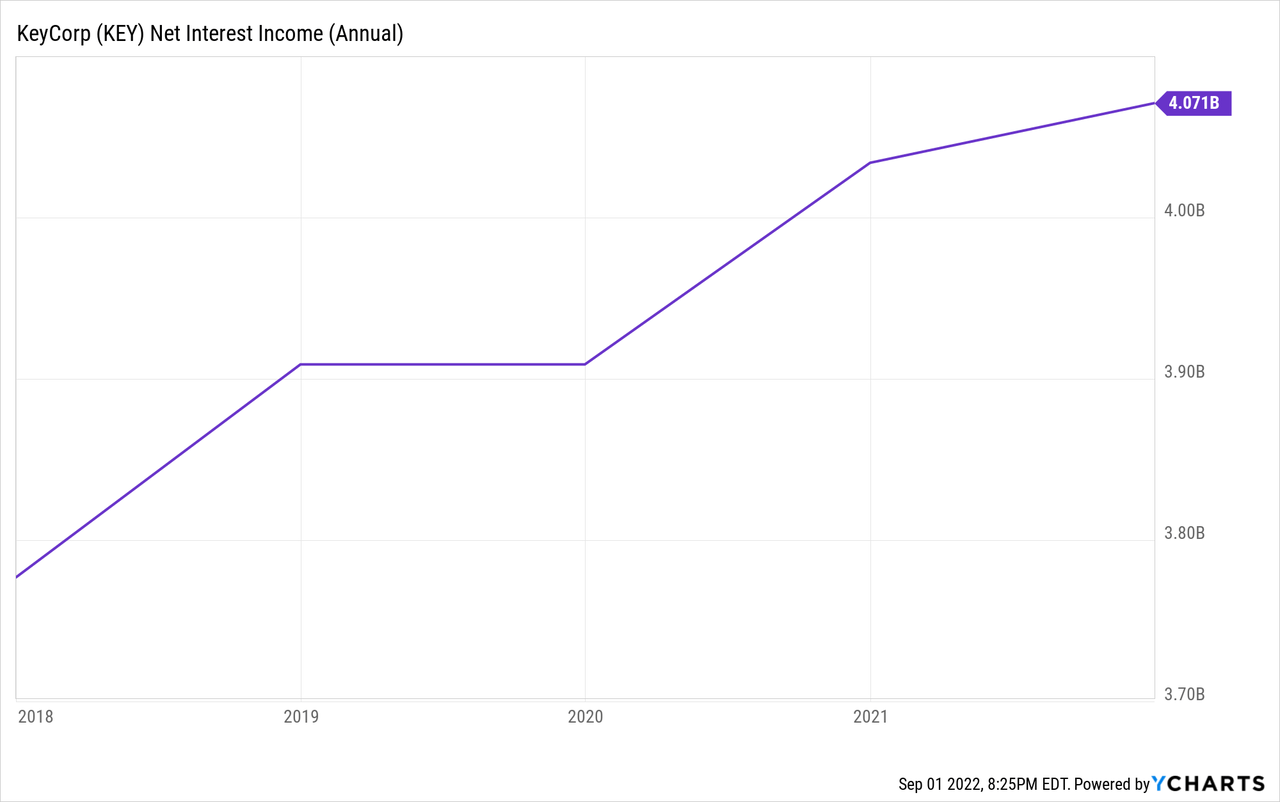
Net interest income growth has been very strong as well, with the company posting 6.9% five-year CAGR. Growth in net interest income in the first six months of this year has been the sole bright spot, with year-over-year growth of 4.4%. Overall, net revenues have increased 7.8% annually over the past five years, with 8.7% growth in 2021. Net revenues posted a 1% decrease in 2022 compared to the first half of last year.
Similar to the other regional banks I have reviewed, the activity surrounding the provision for credit losses is interesting. For the full year 2021, the company reported a benefit of $418 million, the first benefit from loan losses since at least 2012. At the time, the company said the benefit was due to “improvements in the economic outlook and asset quality as well as lower net charge-offs.” For the first six months of 2022, the company has recorded a provision of $128 million. The company has indicated that the increase in the provision is due to “the impact of a reserve release in each respective year-ago period as uncertainty by the pandemic subsided”, which is somewhat different from comments made by the peer group. Reading between the lines, the future is not going to look as good as it did coming out of the pandemic in 2021. As I have stated before, investors need to watch this line carefully, as well as what management says about future credit losses as the economic outlook is generally regarded to be somewhat shaky over the near term.
On the expense side, the company has historically been very consistent with non-interest expenses. Compensation is the largest expense category for financial firms. At KEY, the compensation expense ratio has averaged 0.36 over the past five years, with 2021 coming in at 0.35. Through the first half of 2022, the ratio was 0.356, in line with the historical average. The efficiency ratio, a measure of overall expenses, has averaged 0.62 over the past five years, with 2021 finishing at 0.61. Through the first six months of this year, the efficiency ratio was 0.618, slightly above the first six months of 2021. Computer processing expenses were the driver of the higher spend in the first half of 2022, which is similar to comments from some of the competitors. The historical numbers are very steady, probably the most consistent of any of the banks I have looked at so far. That should give investors comfort that management is capable of maintaining solid expense control, despite the strong revenue growth over the past few years, and into a downturn in revenues this year.
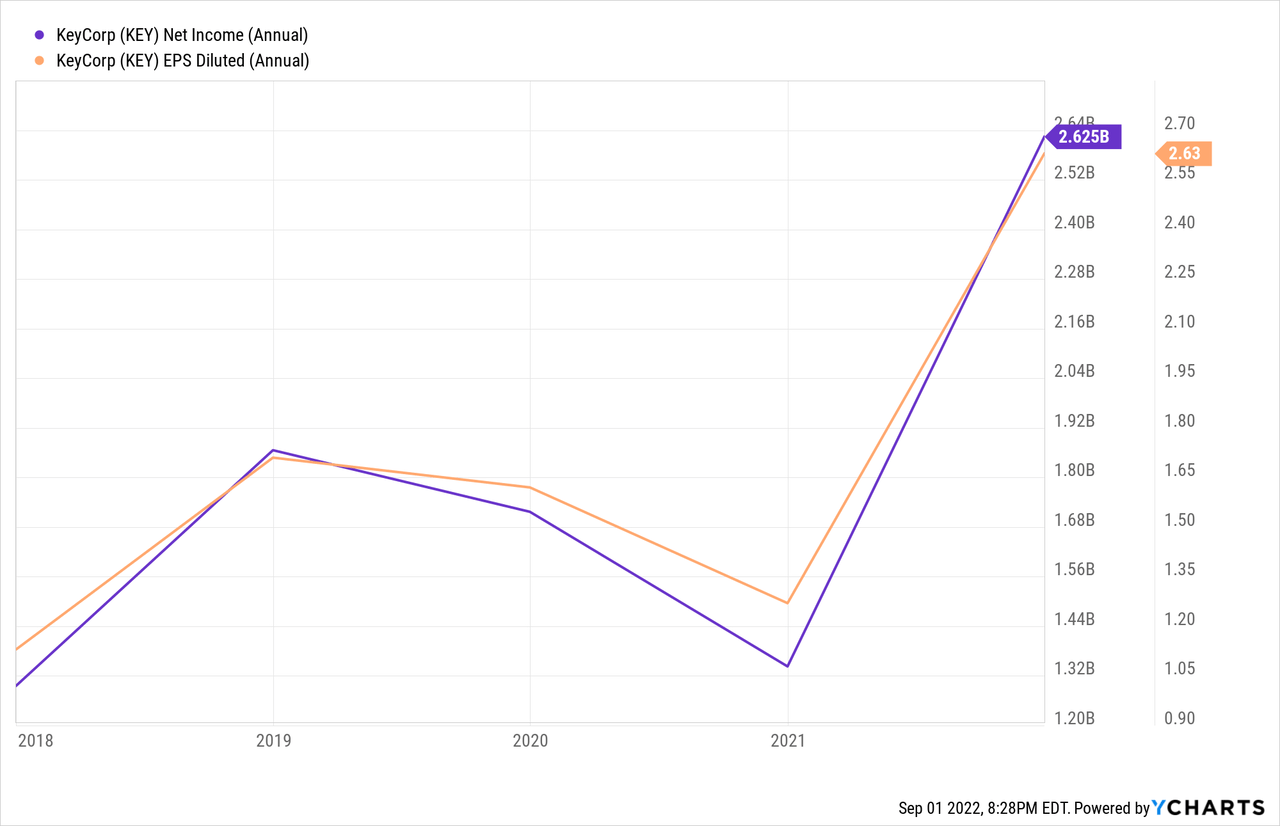
The bottom-line net income numbers have been really strong for KEY. Operating margins have averaged 33% over the past five years, with 2021 coming in at 45%; however, the company did have that loan loss benefit mentioned above. Operating margin for the first half of this year was 34.5%, compared to 47.8% last year, due to the loan loss benefit. Five-year net income for common stockholders has increased at 27.3% annually which is huge. EPS has increased at a similar 26.9% annually over the past five years. However, in the first half of 2022, net income decreased 28% to $928 million, while EPS decreased 26% to $0.99 per share.
Balance Sheet
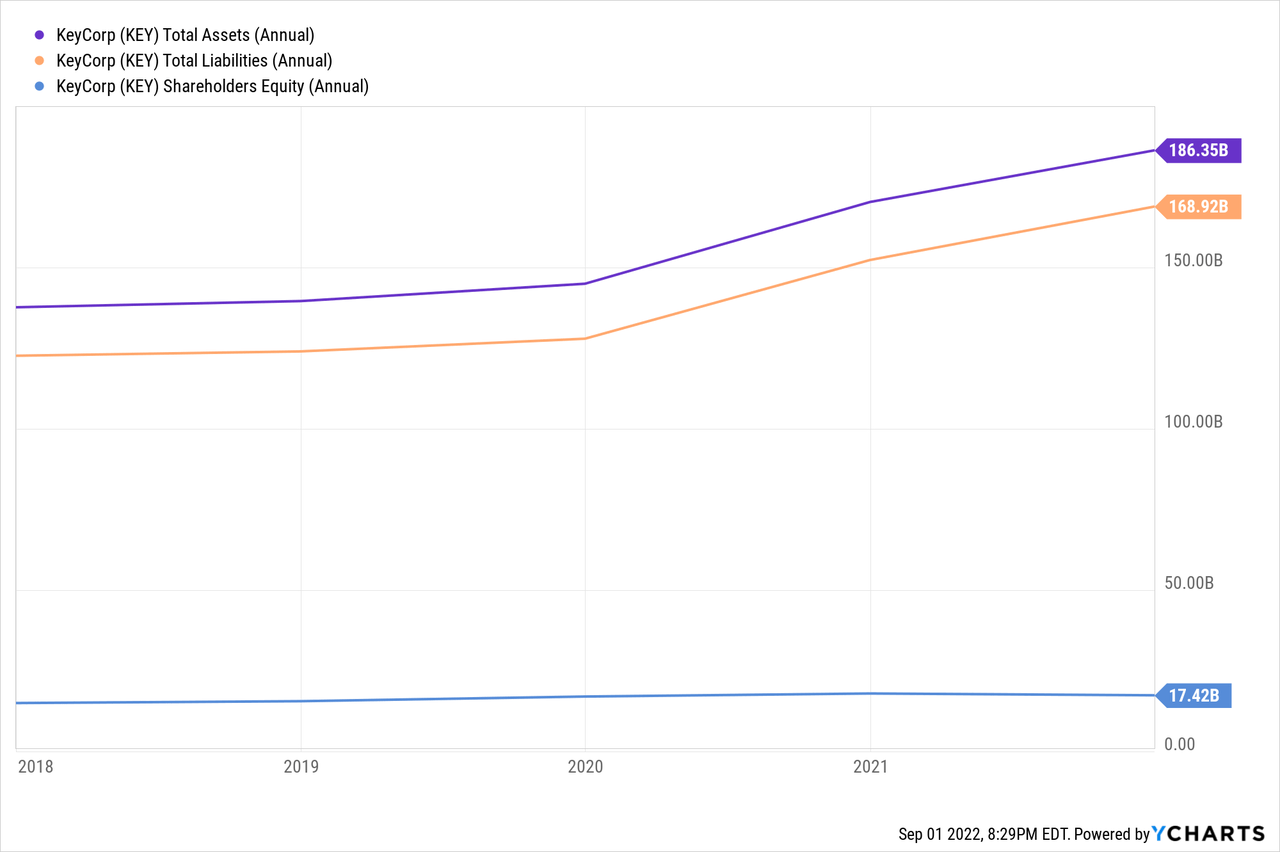
Looking at the balance sheet, total assets have increased 6.4% annually over the five-year period ending in 2021. Over this same period, loan growth has increased 3.4% annually, which is decent, but not great. Total liabilities have outpaced asset growth, though, with a 6.9% annual growth over the five-year period. Deposits have been strong, with a 7.9% annual growth rate over this time frame. Total assets reported at the end of Q2 2022 were $187 billion, about flat with year-end 2021.
Unlike some of its peers, long-term debt is basically flat from where it was five years ago, ending 2021 at $12 billion. And in the first six months of 2022, long-term debt increased to $16.6 billion. Management noted the increase reflects the use of both short and long-term borrowings to fund balance sheet growth. Finally, equity has increased 2.7% annually, with common equity and tangible common equity increasing 2.7% and 3.4%, respectively, over the past five years. The company has generally been an aggressive buyer of its outstanding shares, with the latest share repurchase authorization dated July 2021. At the time, the Board of Directors authorized the repurchase of up to $1.5 billion of common shares through Q3 2022. The company has about $746 million remaining under this authorization, as of the end of Q2.
Ratios
Return on equity averaged 9.3% in the years prior to the 2020 pandemic. After falling in 2020, ROE rebounded to 14.8% in 2021, which was the highest since 2012. At the end of Q2, ROE was 12.3% (annualized) due to reduced net income in the first half of the year. Return on common equity has followed the same trend, declining into the pandemic, but then rebounding to 15.9% in 2021. At the end of Q2, ROCE was 13.2% (annualized).
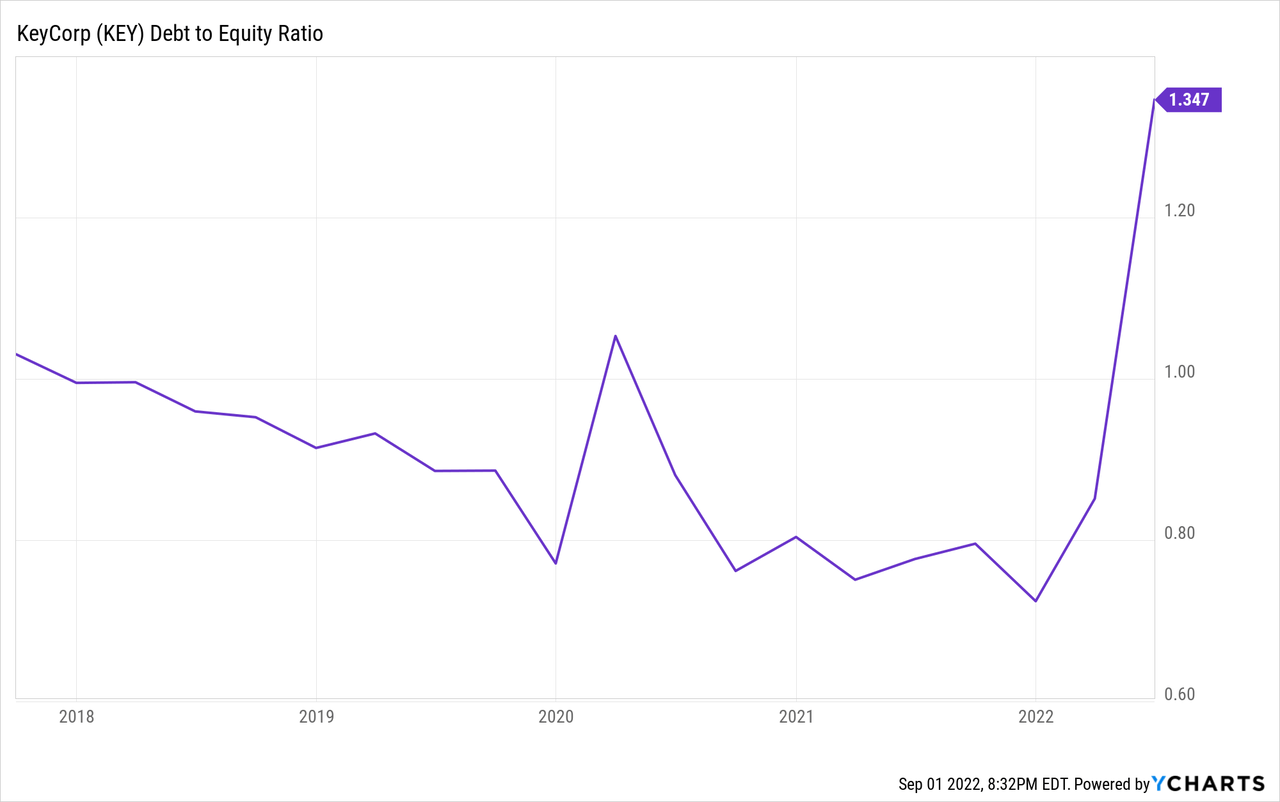
Debt to equity has been choppy over the past few years, peaking at 1.0 in 2017, then declining, increasing and declining again to 0.72 at the end of 2021. On the other hand, debt to total assets has steadily decreased from 0.11 in 2017 to 0.07 in 2021. Interest coverage ratios are strong, with 2021 reporting a 12.0x interest figure, well above the historical range. As interest rates continue to rise, this will be something that bears watching to ensure the company maintains adequate interest coverage.
Loan Quality
In terms of loan quality, the company maintains excellent credit. Net charge offs in 2021 were just 0.18% of loans.
Stock Performance and Valuation
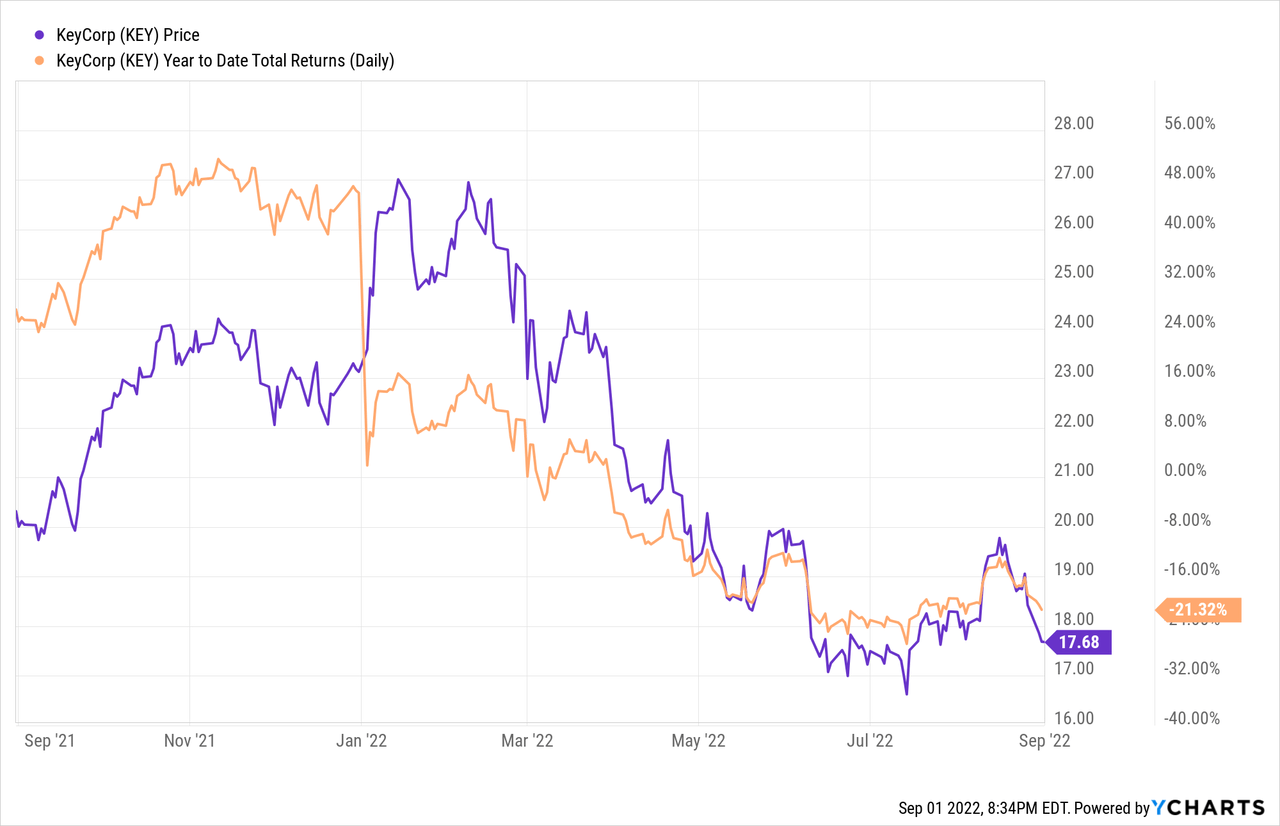
KEY is another good, quality regional bank. As with many stocks, the price has faced some dramatic headwinds over the past year:
Compared to its peers, KEY has underperformed over the past year:
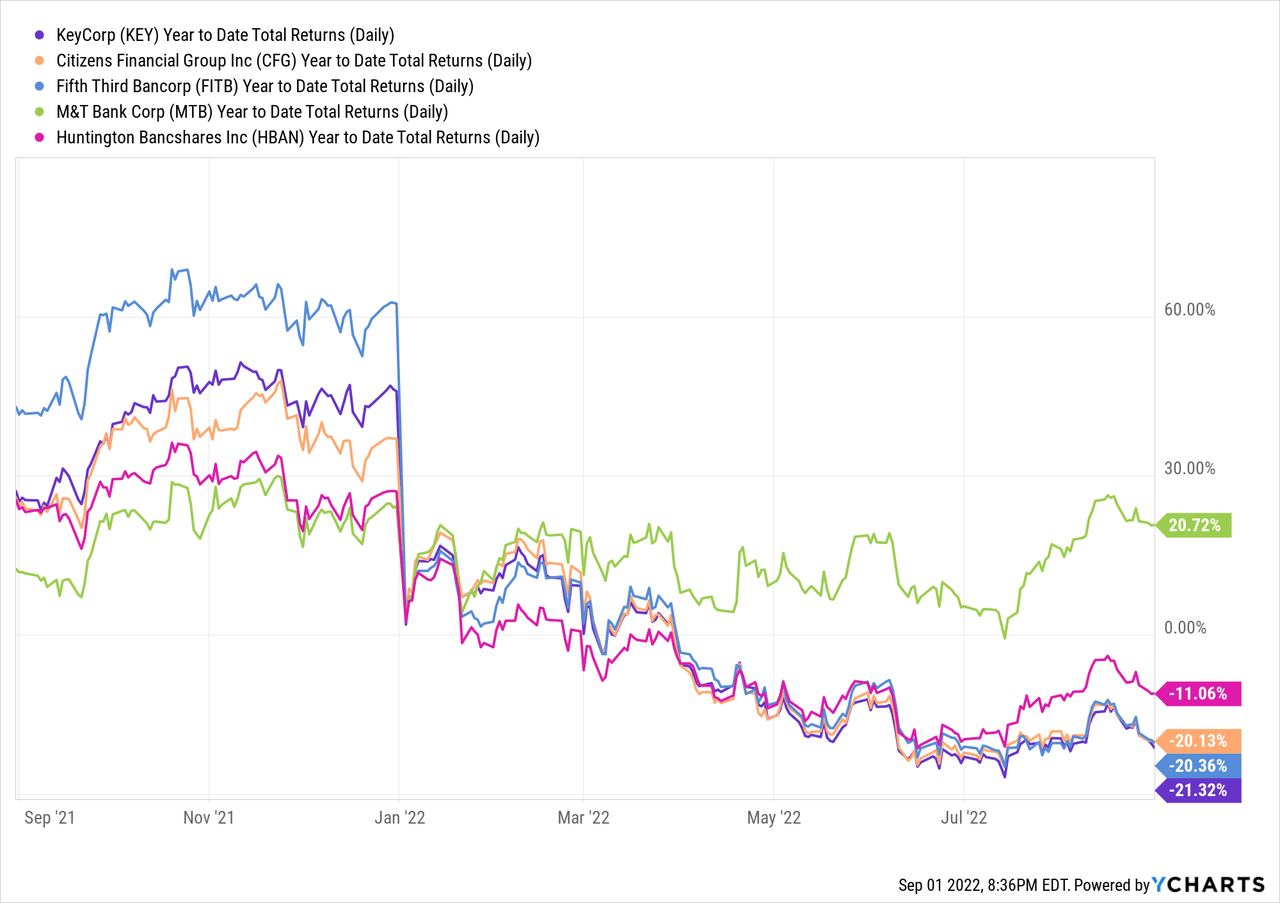
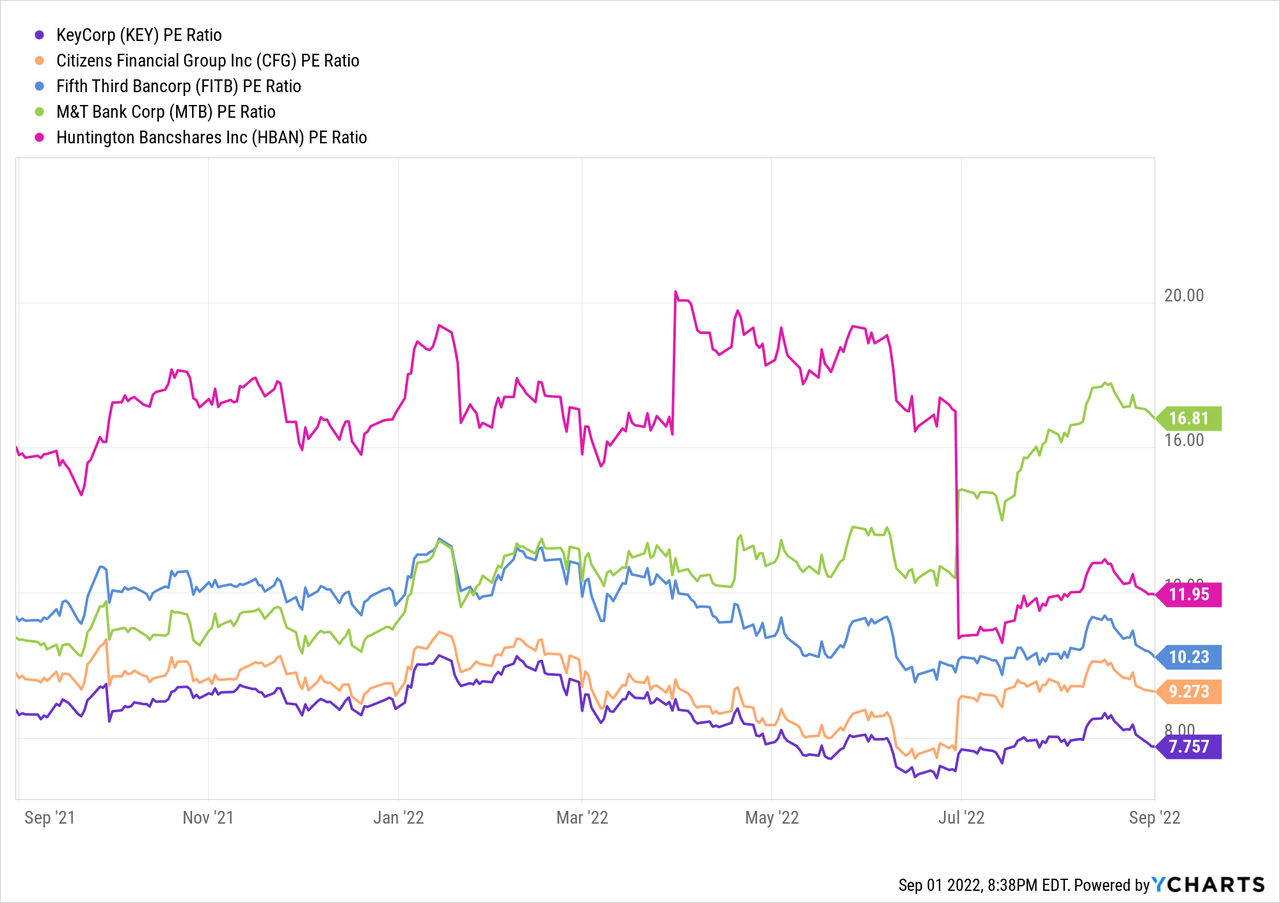
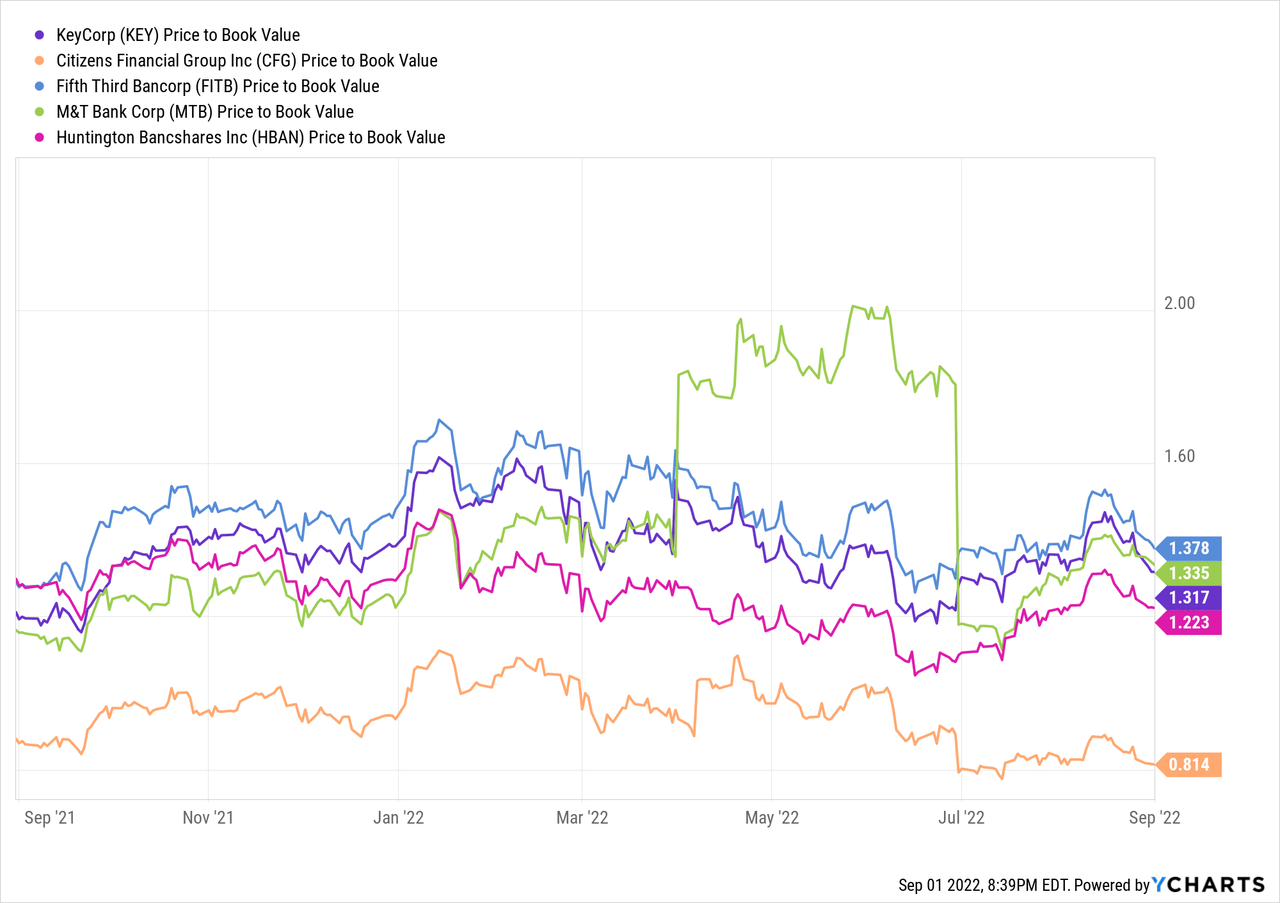
At a recent price of $17.68, the stock is trading at 7.8x last twelve months earnings with a 1.3x book value ratio. The P/E ratio is well below the five-year average, while the P/B is slightly higher than the five-year average. Compared to several of its peers, KEY has the lowest P/E ratio and a middle-of-the-road P/B.
Using a variety of valuation methods, the fair value for this stock is about $20, so the stock is currently underpriced. The current yield on the stock is 4.41%, which is above the peer average.
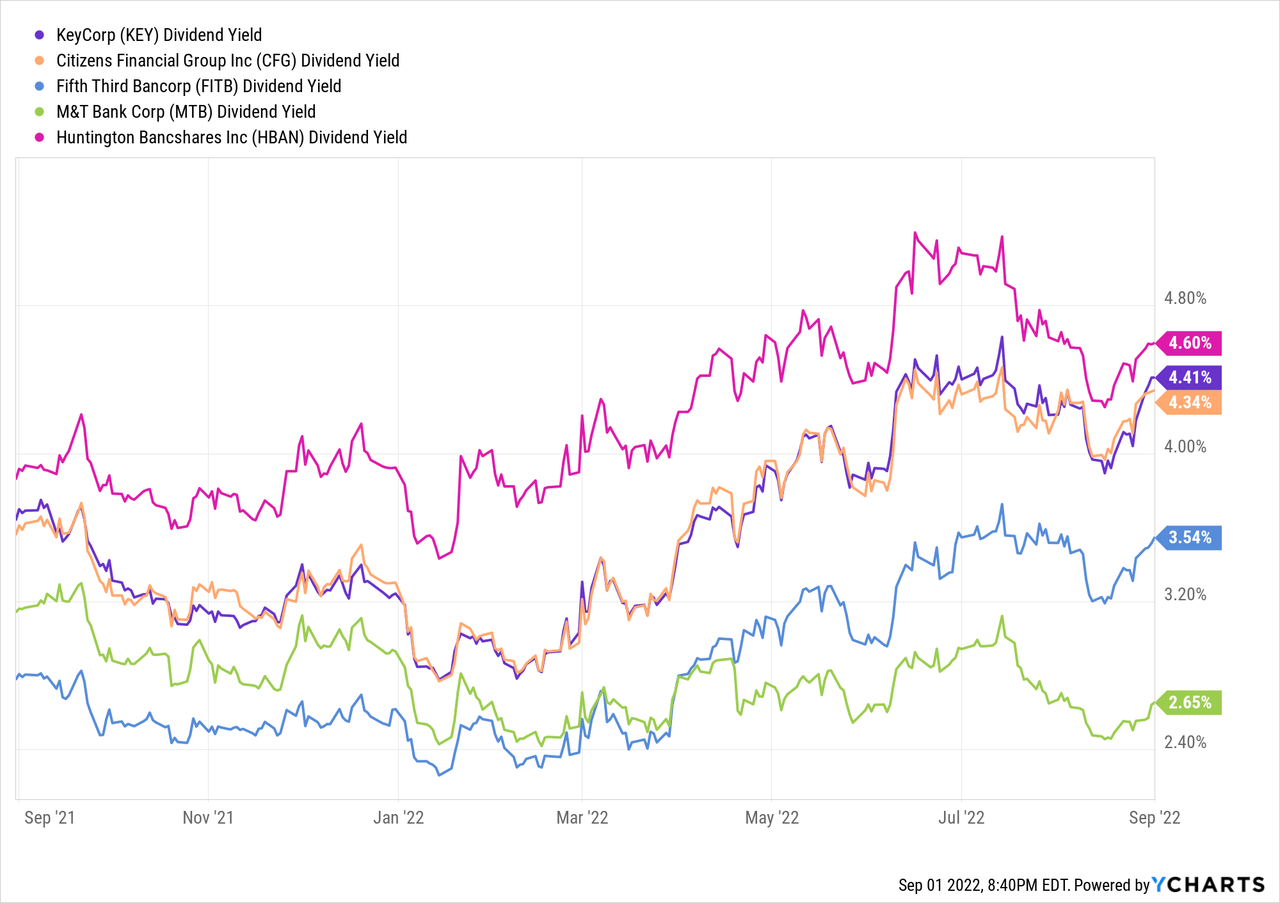
The stock is clearly cheaper than its peers right now. I think that compared to the peer group, KEY has a higher reliance on non-interest revenues and investment banking and investment management are going to be very volatile given the economic backdrop. The company is solid, with a very tight handle on expenses. I think investors who are looking for some regional banking exposure may find KEY to be of good value. With a fair value of about $20, that would represent a gain of about 15% plus the 4.33% dividend, which is quite attractive. Additionally, the company does typically repurchase its common shares, so that could also provide some additional tailwinds to the stock, particularly at these levels.
KeyCorp is one of many strong regional banks that I have covered. I like the fact that they are geographically diverse in regions across much of the United States. I think at these levels, there is a good margin of error. And for those who are looking for an above-average, consistent dividend, KEY may be a good pickup.
Be the first to comment