

Olivier Le Moal/iStock via Getty Images
Thesis
I have been writing a series of articles in the past year or so to caution readers about the potential risks of the JPMorgan Equity Premium Income ETF (NYSEARCA:JEPI). To recap, many investors might be attracted to its mouth-watering dividend yield (8.8% TTM as of this writing and 10%+ when I wrote my past articles). And my earlier articles analyzed the potential risks such as interest rate risks and the limited upside due to the use of option overlays.
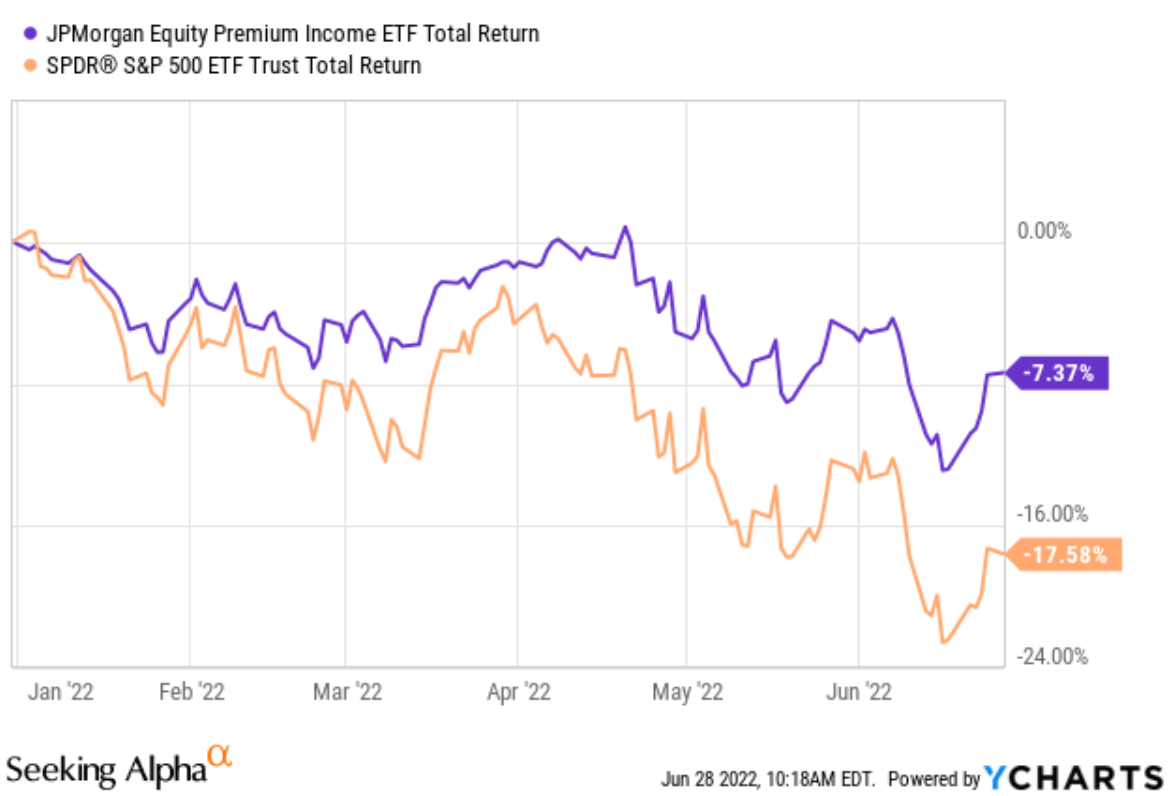
All told, the fund has suffered a sizable loss of 7.37% YTD. Although, on a relative basis, as you can see from the following chart, JPEI outperformed the overmarket by a good margin. The SPDR S&P 500 Trust ETF (NYSEARCA:SPY) lost more than 17.5% YTD. So JEPI’s outperformance is almost 10% in relative terms.
Now, looking forward, the natural questions are twofold. First, would the fund deliver a positive return in absolute terms in the near future? And second, would its relative outperformance continue?
You will see that my answers to the above two questions are VERY LIKELY and UNLIKELY, respectively, to these two questions. And we will dive into the details next.
Seeking Alpha Seeking Alpha
JEPI and SPY: Basic information
Both JEPI and SPY are benchmarked against the S&P 500 index, and both hold large-cap stocks. And many of their holdings overlap, as to be elaborated on later. JEPI is an actively managed fund and hence charges a higher expense ratio of 0.35% compared to 0.09% from SPY.
To compensate for the higher expense ratio, JEPI employed proprietary strategies to maintain capital appreciation compared to the S&P 500 index while also providing high current income at the same time and lower volatility. SPY, as you all know already, is indexed to directly mimic the S&P 500. The strategies employed by JPEI to achieve its goals are twofold: the identification of overvalued and undervalued stocks and the use of options. As detailed in the fund description (the emphases were added by me), the fund:
- Generates income through a combination of selling options and investing in U.S. large cap stocks, seeking to deliver a monthly income stream from associated option premiums and stock dividends.
- Constructs a diversified, low volatility equity portfolio through a proprietary research process designed to identify over- and undervalued stocks with attractive risk/return characteristics.
- Seeks to deliver a significant portion of the returns associated with the S&P 500 Index with less volatility, in addition to monthly income.
Source: ETF.com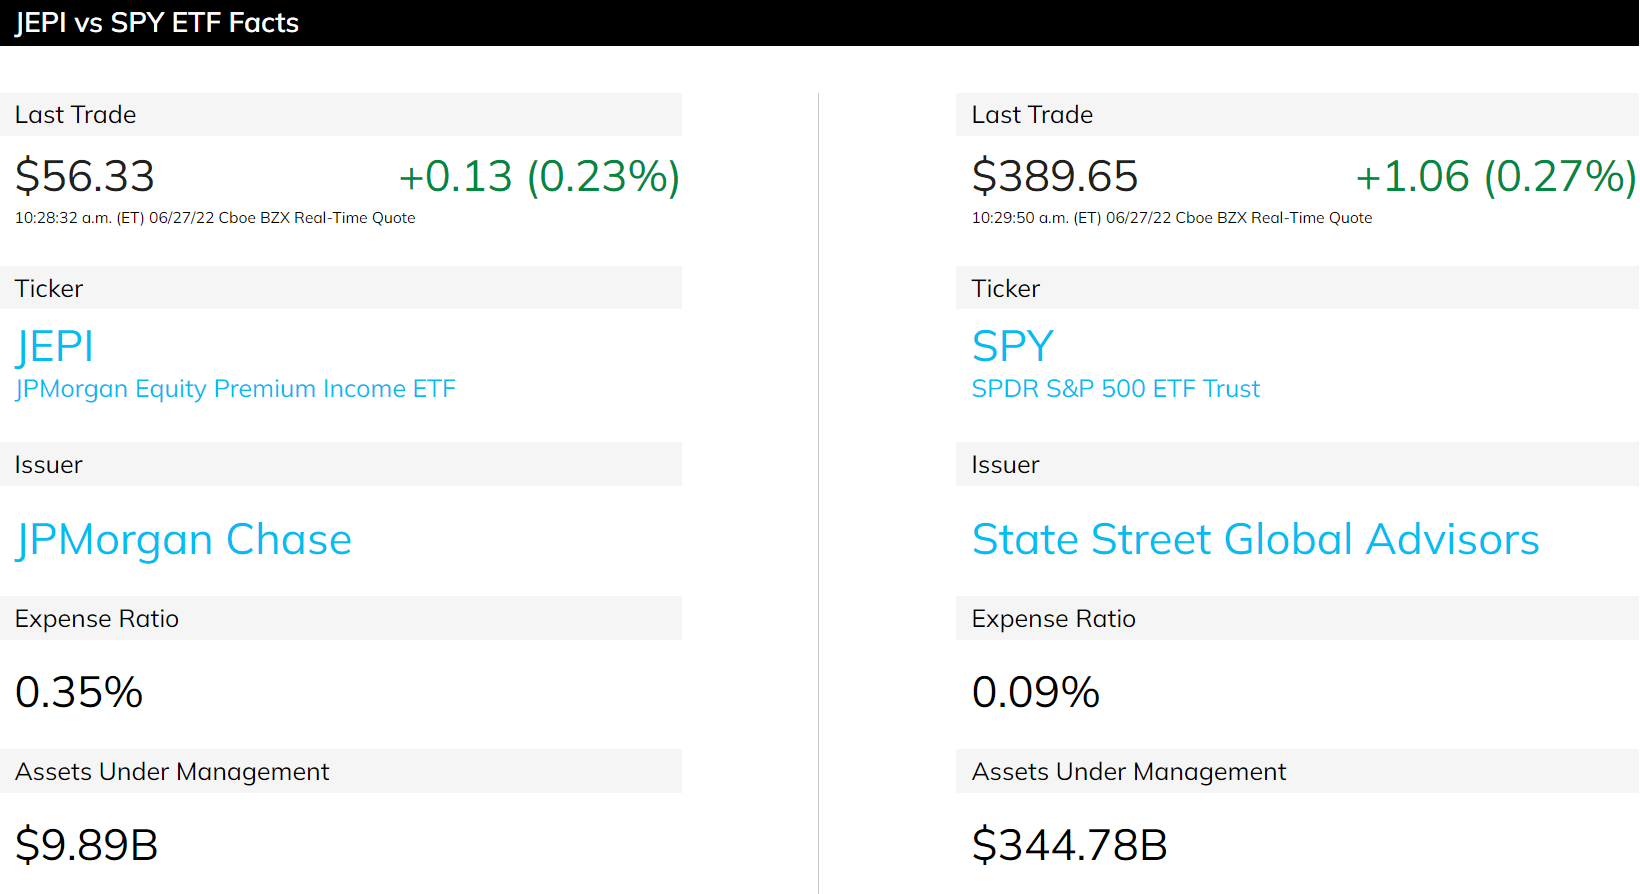
JEPI vs SPY: Value vs growth
As aforementioned, both JEPI and SPY hold large-cap stocks and many of their holdings overlap. As you can see from the following chart, even among their top 10 holdings, there are several overlapping holdings such as MSFT, UNH, and AAPL.
Although the differences are also very apparent. Firstly, SPY holds about 500 stocks as its name suggests. But JEPI holds a more concentrated portfolio with only about 100 stocks selected by its proprietary strategies. Secondly and more fundamentally, SPY’s holdings are passively indexed but JEPI’s are actively selected with an emphasis on value. As detailed in the fund description (abridged and emphases added by me),
In managing the equity portion of the Fund’s portfolio, the adviser employs a three-step process that combines research, valuation and stock selection. The research findings allow the adviser to rank companies according to what it believes to be their relative value… The Fund buys and sells securities in accordance… using the research and valuation rankings as a basis. In general, the adviser selects securities that are identified as attractive and considers selling them when they appear less attractive.
As a result of such a value-oriented approach, you can see that JEPI holds more value-oriented stocks than SPY. The top 10 holdings provide a very clear illustration of such difference. As you can see, JPEI holds more value-oriented stocks such as BMY, ABBV, and KO at a higher allocation than SPY; more growth-oriented stocks such as MSFT and AAPL at a lower allocation than SPY; and totally avoids expensively valued stocks like TSLA and NVDA.
Source: ETF.com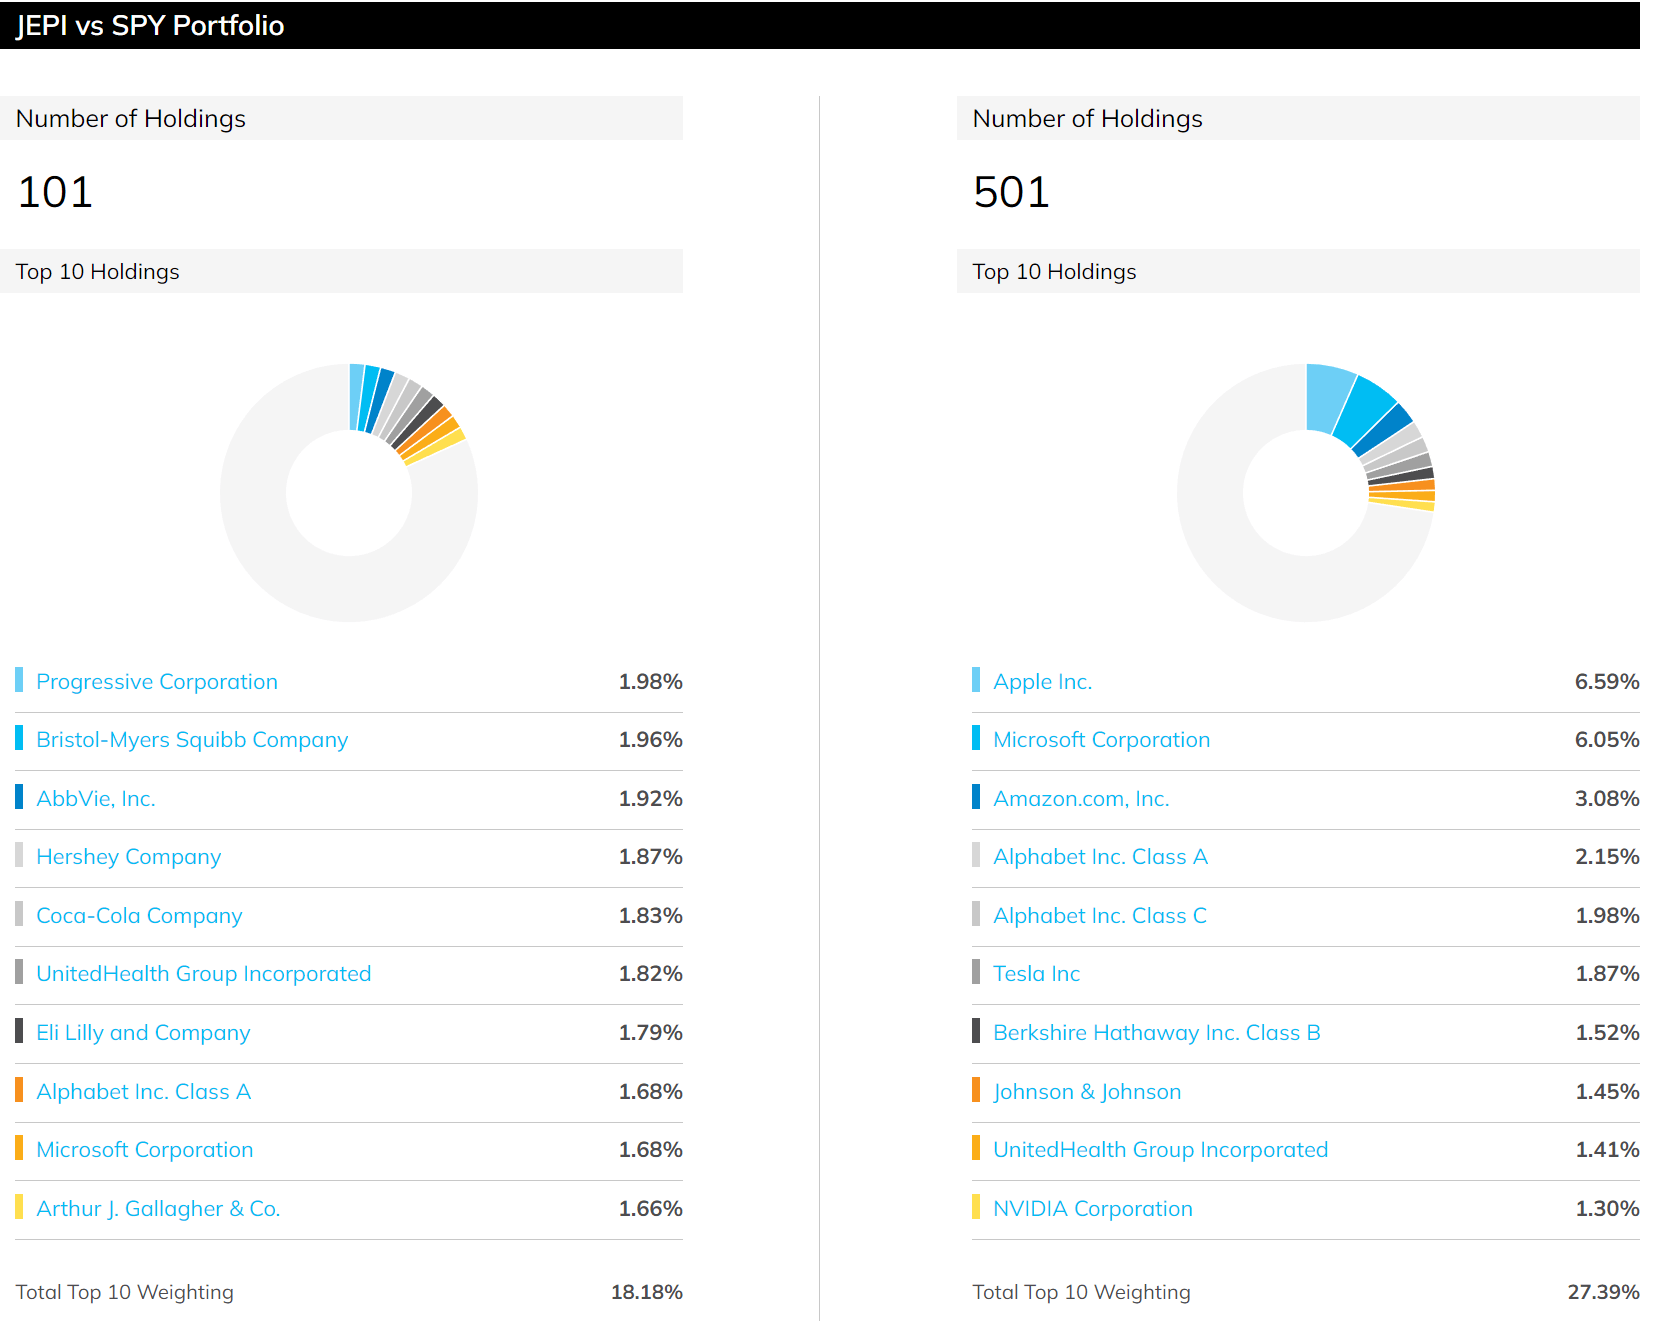
As a result of the above index indifferences, the outperformance of JEPI over SPY in the past year or so was largely due to the severe correction of the growth sector (mainly consumer discretionary and the technology sector).
And if we are going to bet that such outperformance will continue in the future, we are largely betting that value stocks will keep outperforming growth stocks. however, I see this assumption as a pretty weak assumption at this time, as you can see from the following chart.
The S&P 500 index has been valued at a large premium relative to value stocks such as consumer staples and healthcare in 2021 and early 2022. The FW PE of SPY during those times was around 24x, almost 1.6x of healthcare’s 15x FW PE. However, the S&P 500 index is currently valued at about the same PE as the value sectors such as consumer stable (like KO, the top 5 holding in JEPI) or healthcare (like BMY and ABBV, top 2 and 3 holdings in JEPI). SPY’s FW PE is about 15.9x, only higher than healthcare’s 14.8x by about 7% and actually lower than consumer staple’s 19.2x by about 17%.
Source:Yardeni.com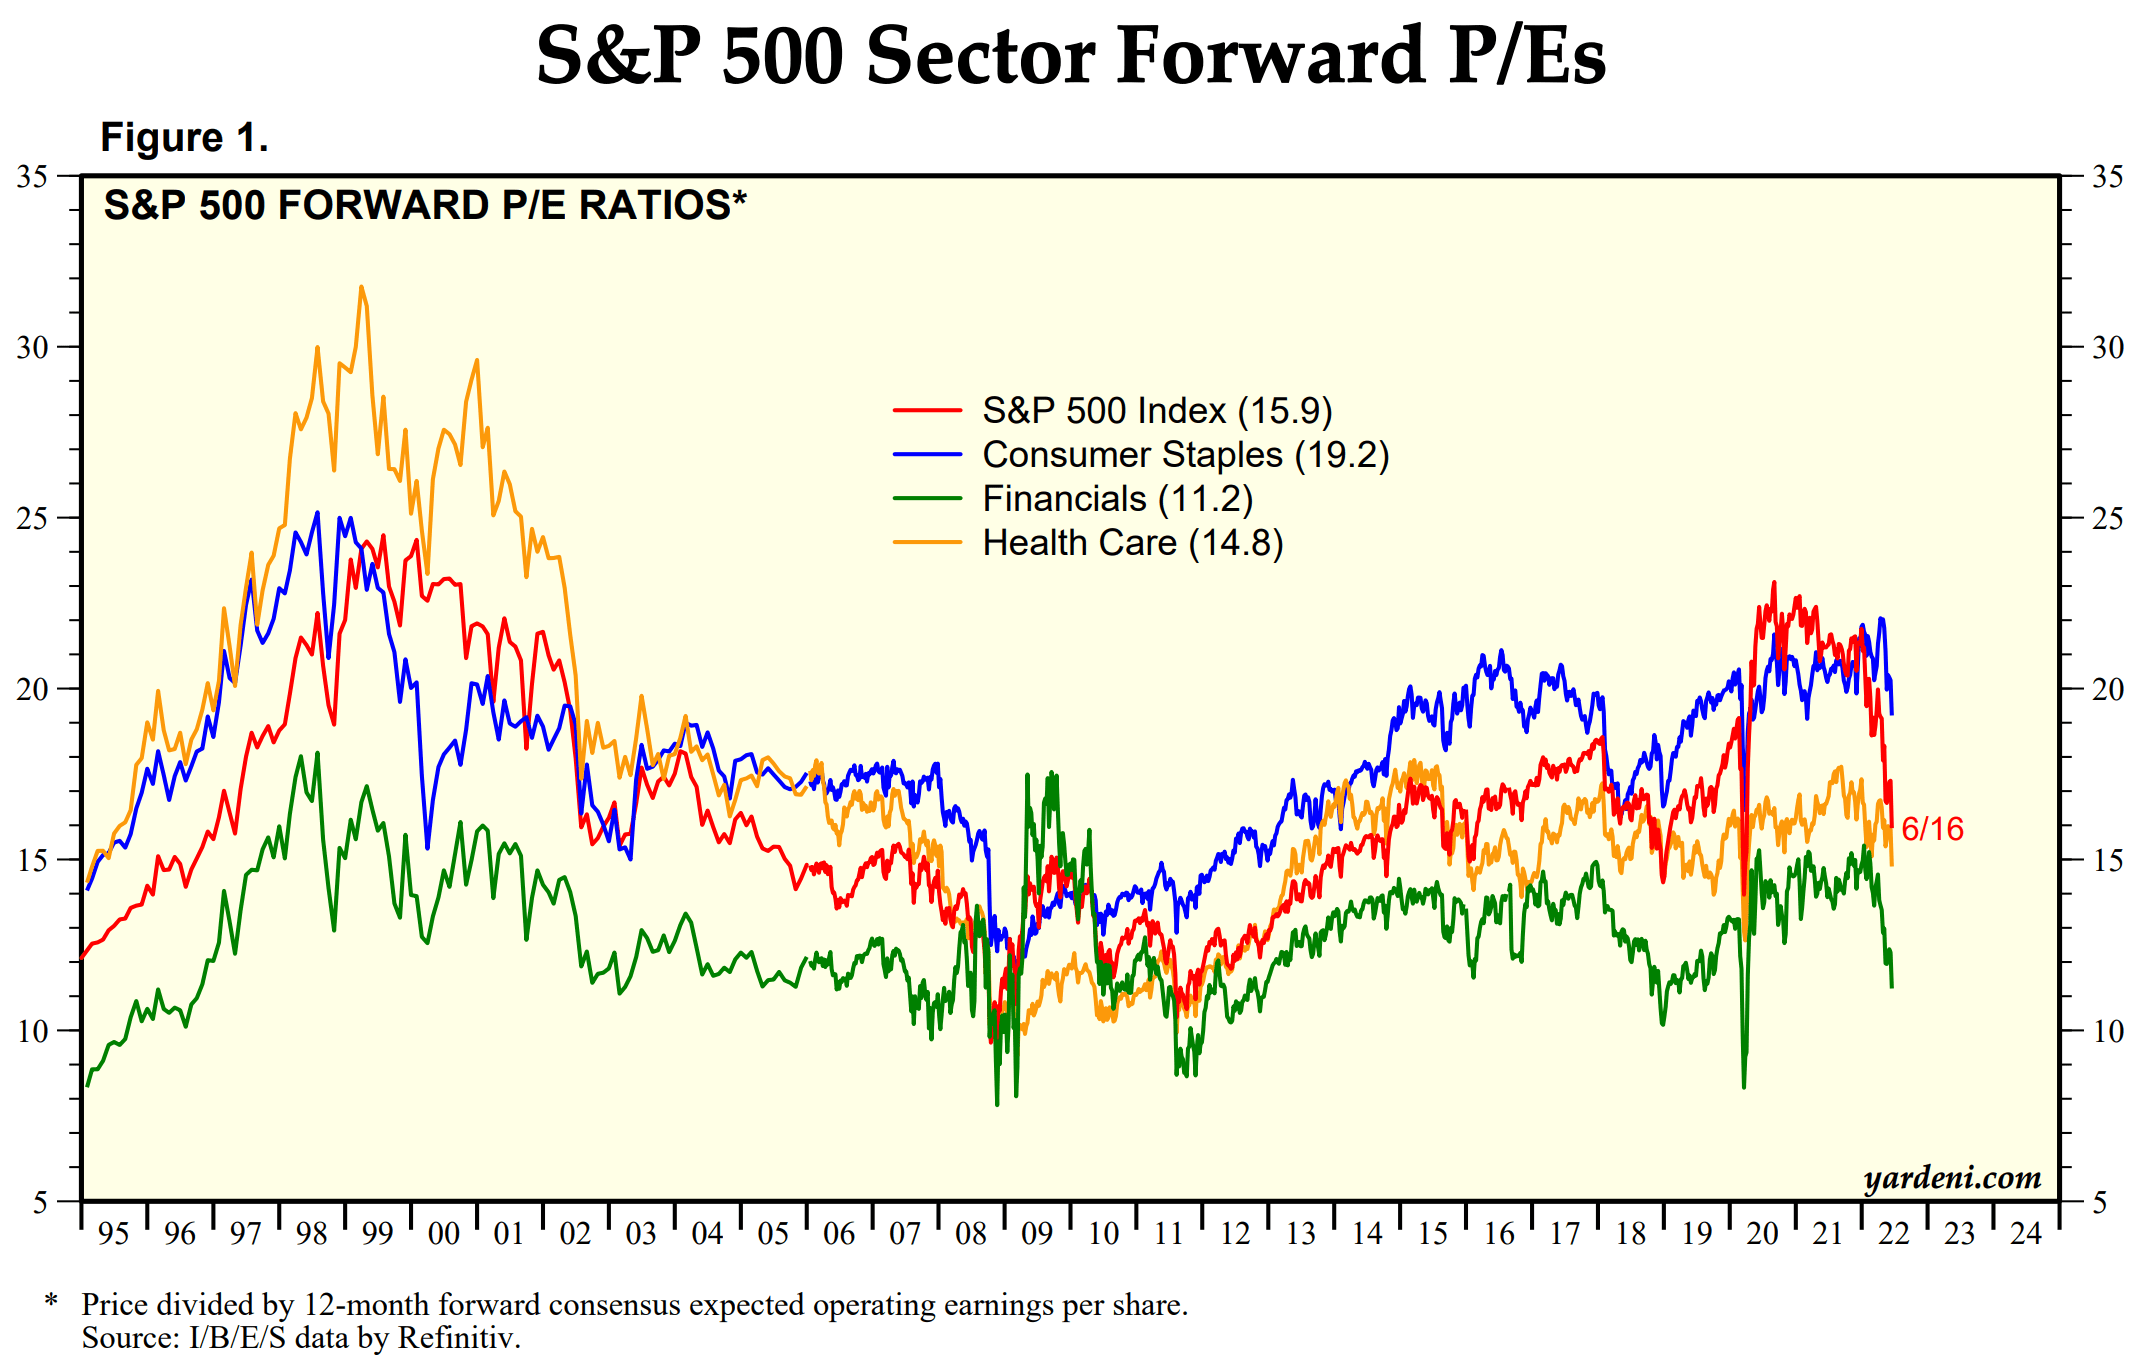
JEPI vs SPY: ELNs and long-term performance
Besides the shrinking valuation gap as aforementioned, JEPI’s use of option overlays (in the form of ELNs, Equity Linked Notes) will further limit its upside potential. JEPI invests up to 20% of its assets in option overlays. And as aforementioned, this will limit its upside potential as detailed by the fund description itself (abridged and emphases added by me),
In order to generate income, the Fund may invest up to 20% of its net assets in ELNs… ELNs in which the Fund invests are derivative instruments that are specially designed to combine the economic characteristics of the S&P 500 Index and written call options in a single note form. The ELNs provide recurring cash flow to the Fund based on the premiums from the call options the ELNs write and are an important source of the Fund’s return… Investing in ELNs may reduce the Fund’s volatility because the income from the ELNs would reduce potential losses incurred by the Fund’s equity portfolio. However, because of the call options written within an ELN, the investment would also reduce the Fund’s ability to fully profit from potential increases in the value of its equity portfolio.
The use of ELNs has certainly benefited investors in the past year (in addition to the value-growth rotation mentioned above). However, extending the time horizon a little bit wider, as seen in the first chart below, you can see the outperformance diminishes. Since its inception in 2021, the outperformance of JEPI relative to SPY has actually been only about 2% per year (10.5% CAGR vs 8.5% CAGR) including the dividends it earned from the ELNs. And part of this diminished outperformance was due to the upside limitation posed by the use of options.
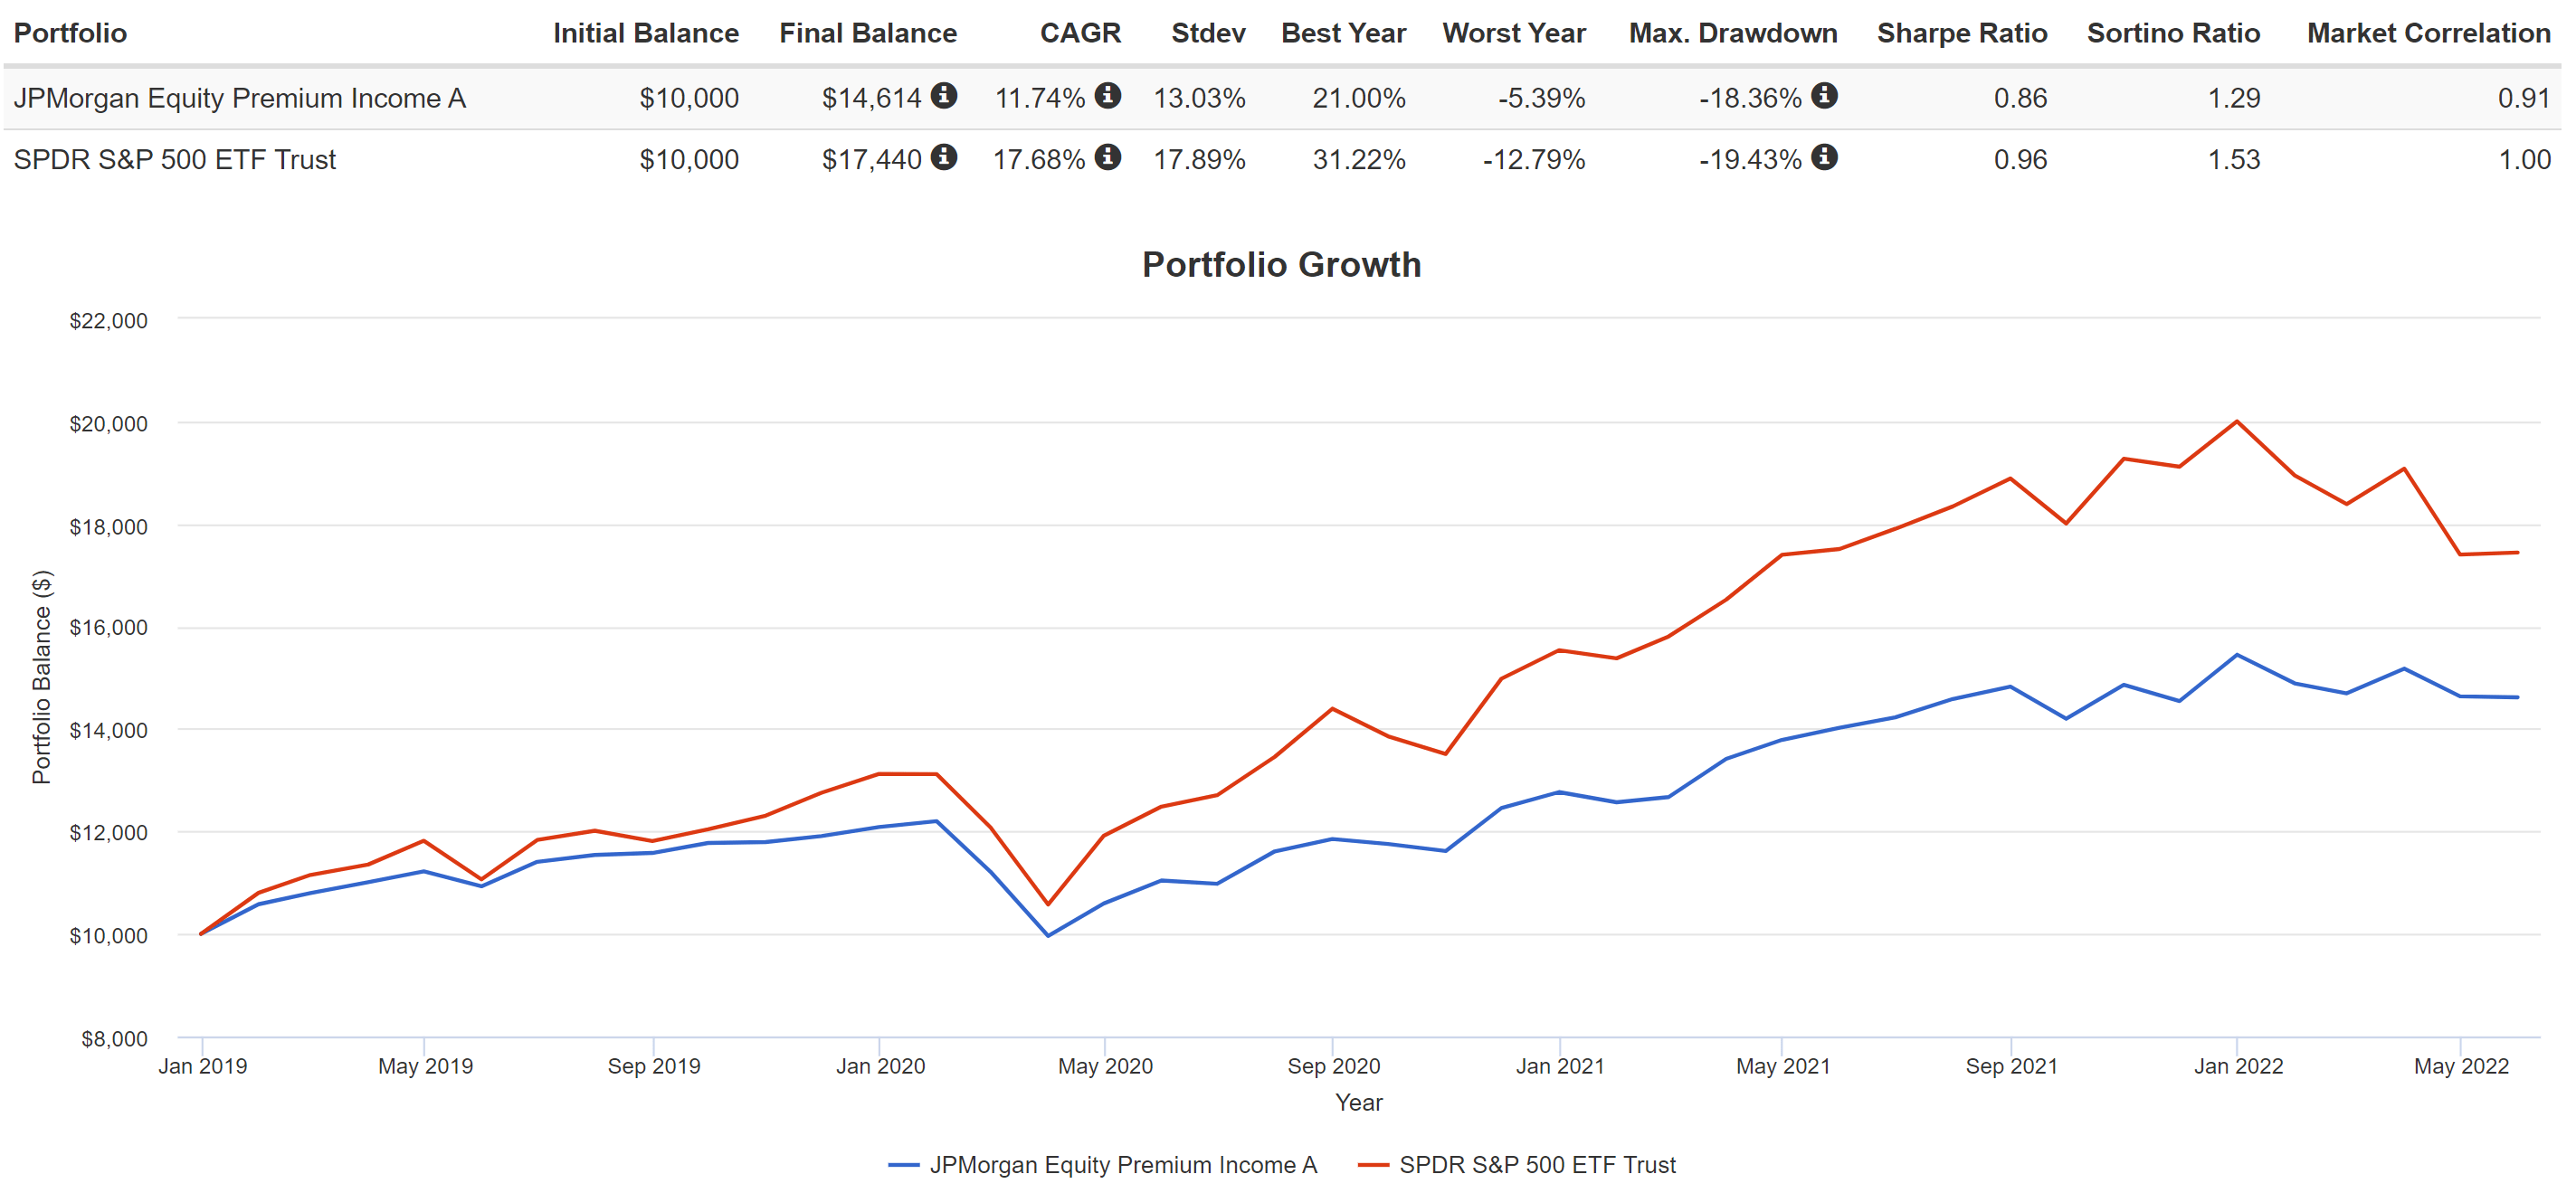
A comparison since 2021 is still a relatively short timeframe for many investors. To gain a more comprehensive understanding, we will have to do a bit of extrapolation using the data from a similar fund with a longer period of data: JEPAX. The JPMorgan Equity Premium Income Fund Class A A (JEPAX) fund was launched back in 2019, thus providing about 3 years of historical data. Now as you can see from the 2nd chart below, JEPAX lagged SPY by a wide margin. SPY delivered a CAGR of almost 17.7% and a total return of 74% in the past 3 years or so. In contrast, JEPAX delivered a CAGR of about 11.7% and a total return of 46% in the same period, lagging SPY by almost 6% on an annual basis and more than 28% on a cumulative basis. And again, a fundamental reason is the use of option overlays that capped its upside potential.
Source: www.portfoliovisualizer.com Source: www.portfoliovisualizer.com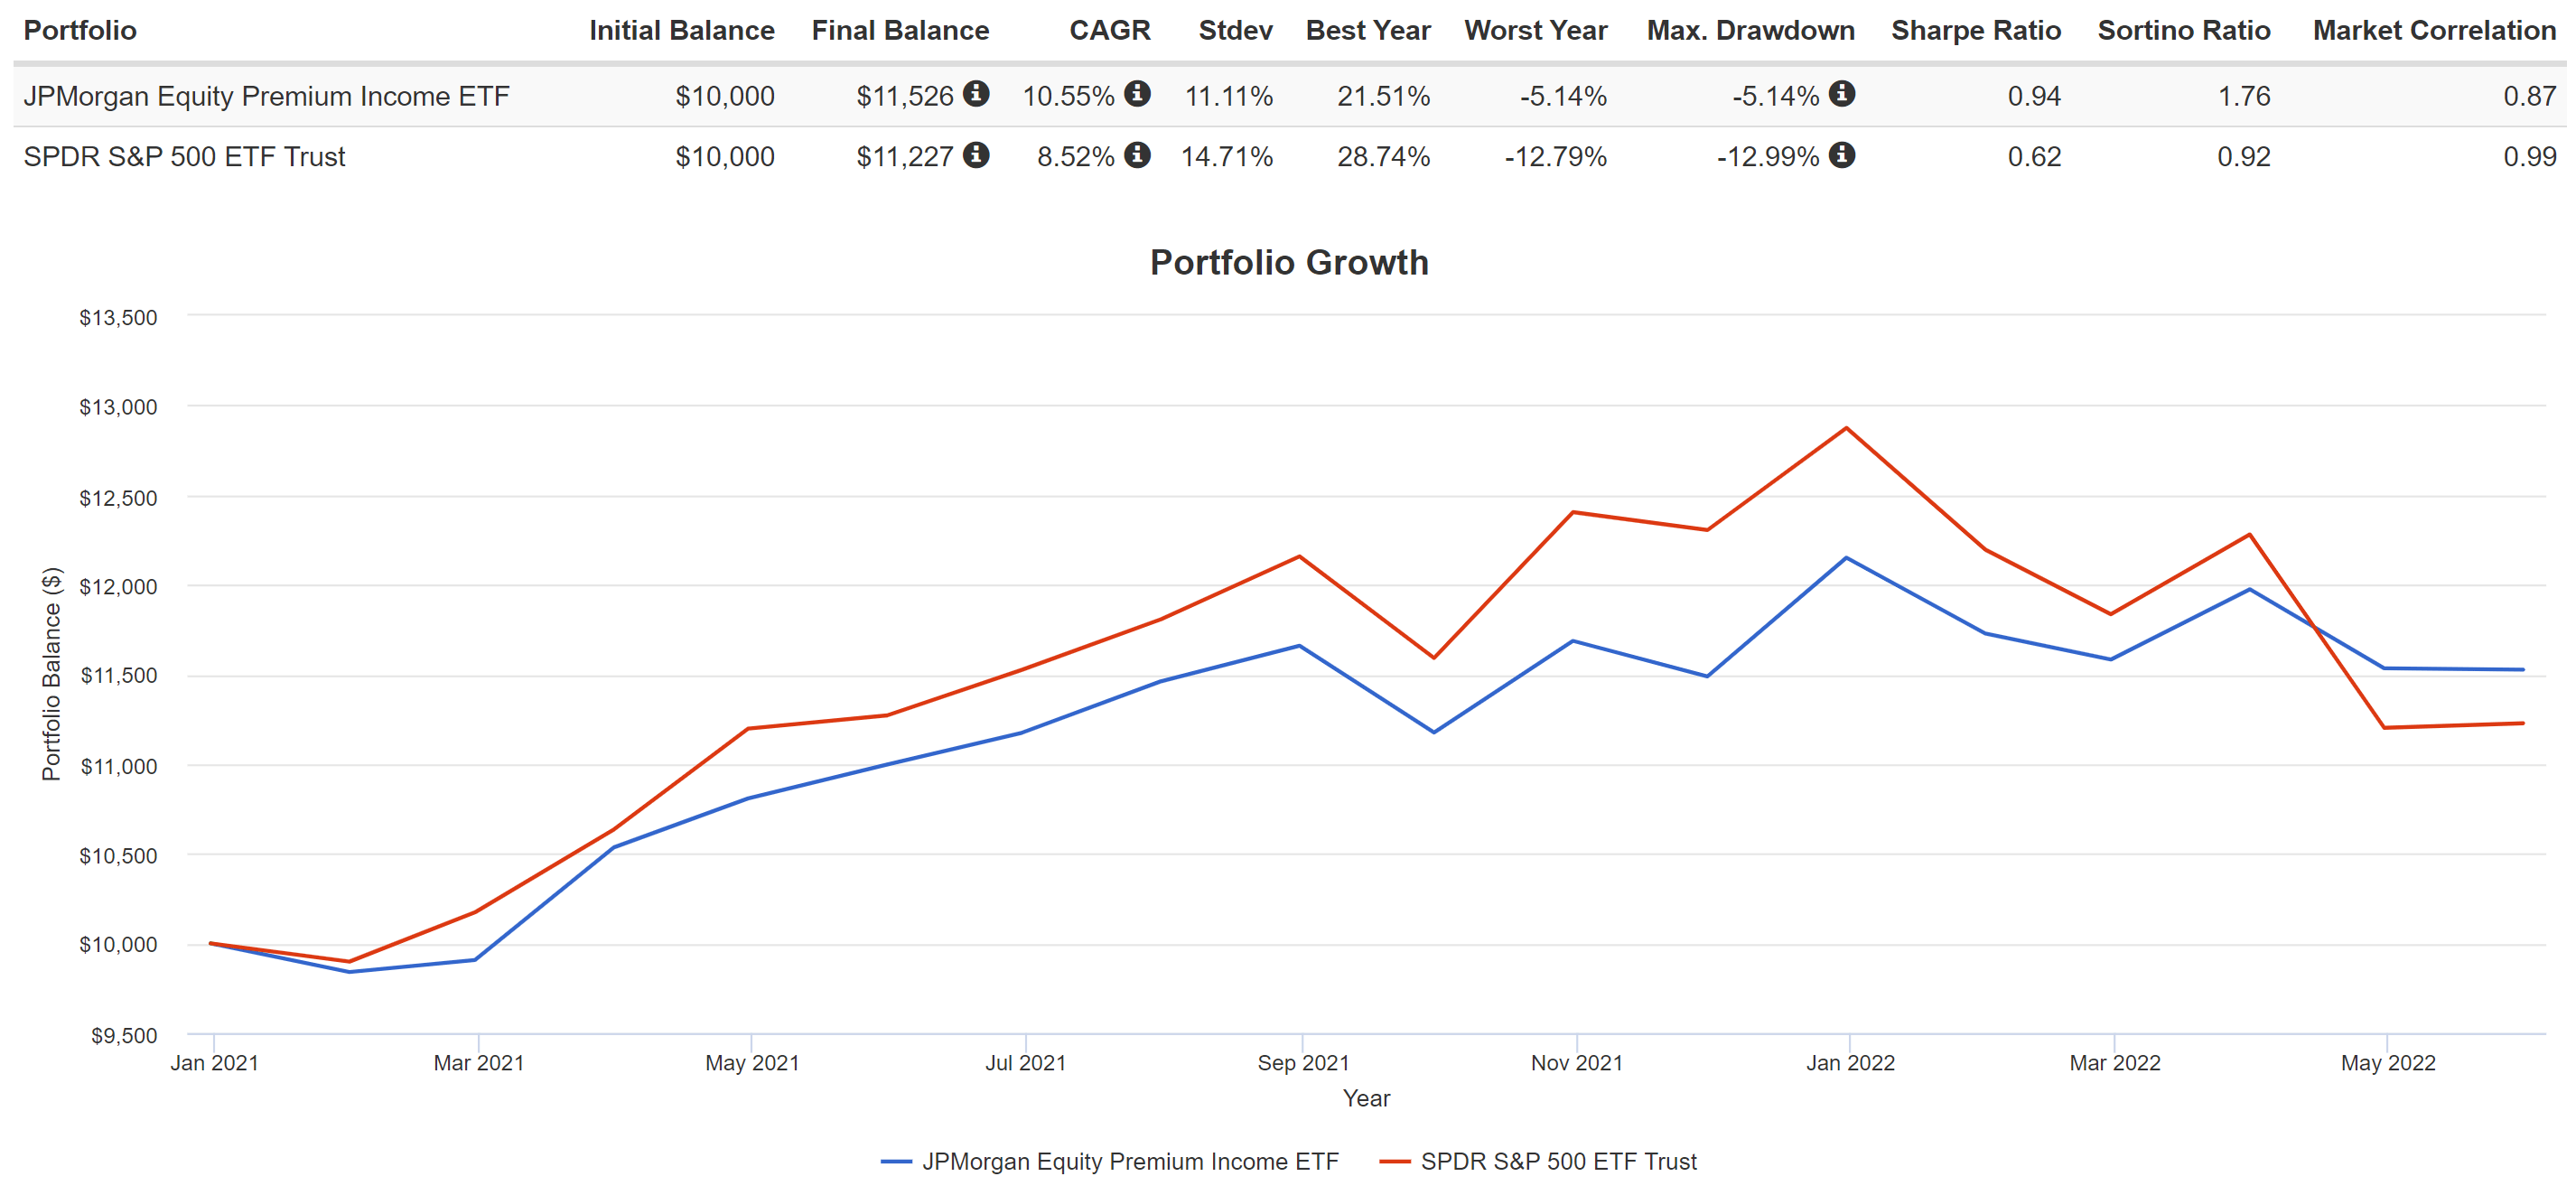
Final thoughts and other risks
Now let’s get back to the two questions that opened this article. First, would JEPI deliver a positive return in absolute terms? And second, would it keep outperforming SPY?
Looking forward,
- My answer to the first question is VERY LIKELY. As discussed above, I agree with the fund underlying approach. My opinion is that the managers have demonstrated an effective approach to systematically picking value stocks and using options to sustainably generate attractive dividend yields. Furthermore, the current valuation of value sectors like healthcare is very reasonable, adding another layer of safety to the fund.
- My answer to the second question, however, is UNLIKELY. The outperformance of JEPI over SPY YTD was largely due to rotation from growth to value. Now the rotation has large completed, and SPY’s current FW PE is about 15.9x, not that different from the value-oriented sectors anymore. Furthermore, the use options, while providing attractive current income, limit the upside potential in the long term.
- Also, note the higher expense ratio from JEPI creates a structural headwind too. A 0.35% expense ratio seems to be negligible in absolute terms. However, these large funds typically deliver about 7% of total pre-tax annual returns in the long term. The expense ratio is therefore about 5% of the pre-tax return and about 6.5% of the after-tax return (assuming your tax rate is in the 30% bracket).
- As such, I would only recommend JEPI to investors who need the current income. And of course, JEPI also offers simplicity in a single fund. For investors who do not need the simplicity and won’t mind a bit of DIY, I would recommend a more dynamic approach combining a core fund (such as SPY) and a few tactical stock holdings as detailed here.
Be the first to comment