

JHVEPhoto/iStock Editorial via Getty Images
Jones Lang LaSalle: Investment Thesis
Jones Lang LaSalle (JLL) has a strong balance sheet with modest debt levels. The company achieved earnings beats over the last five quarters through end of Q1 2022, totaling $8.04. Over the last eighteen months, the share price has increased from $148.37 at Dec. 31, 2020 to the present $175.46. The share price did go much higher, reaching a high of $275.77 on Jan. 4 2022, so it has been a rollercoaster ride for investors in the company stock. The initial upward momentum in the stock was a major driver of SA Quant rating the stock a Strong Buy/Buy between Dec. 31, 2020 and May 6, 2022. Since then, as the share price entered a period of downward momentum, SA Quant rating has changed to Hold. Analysts’ estimates indicate continuing solid growth in EPS, so earnings are not a good reason for the share price fall. P/E multiple has declined from 15.65 at end of 2020 to the present 8.40 at June 24, 2022, so sentiment appears to be the main driver of the falling share price. Sentiment, by its nature is often illogical or irrational. I can see no obvious reason for the near halving of the company’s P/E multiple apart from the possibility initial downward momentum in share price has fueled further downward momentum. My detailed analysis based on consensus EPS and a return to higher historical average P/E multiple indicates returns for buying now and holding through end of 2024 could be in the order of ~24% to over 30%. With P/E multiple presently plumbing the depths at 8.40, I expect a return of upward momentum in the share price. The first green shoot indicating this may now be about to happen can be seen in Fig. 1 below from SA Quant ratings.
Figure 1 – Recent SA Quant Ratings for JLL
SA Premium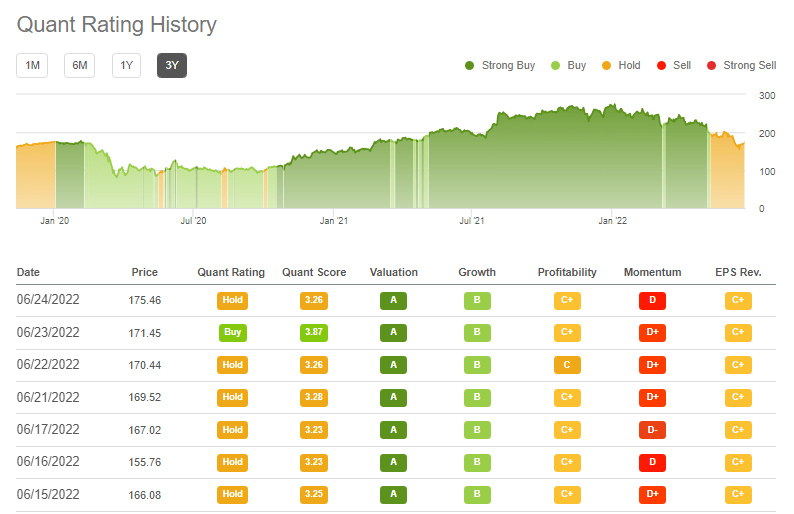
Obviously, the wide range in analysts’ EPS estimates reflects a high degree of uncertainty, and increased uncertainty equates to increased risk. Still, the upside risk is for likely strong double-digit returns, and the downside risk is for a probability of low single-digit, but still positive returns, for buying now and holding through end of 2024. I rate Jones Lang LaSalle a Strong Buy. My usual detailed structured financial analysis follows below.
Looking for share market mispricing of stocks
What I’m primarily looking for here are instances of share market mispricing of stocks due to distortions to many of the usual statistics used for screening stocks for buy/hold/sell decisions. The usual metrics do not work when the “E” in P/E is distorted by the impact of COVID-19. And if the P/E ratio is suspect, so too, then, is the PEG ratio similarly affected. I believe the answer is to start with data at the end of 2019, early 2020, pre-COVID-19 and compare to projections out to the end of 2022 or later, when hopefully the impacts of COVID-19 will have largely dissipated. The JLL stock analysis, summarized in Tables 1, 2, and 3 below, is the result of compiling and analyzing the data on this basis.
Table 1 – Detailed Financial History And Projections
Seeking Alpha Premium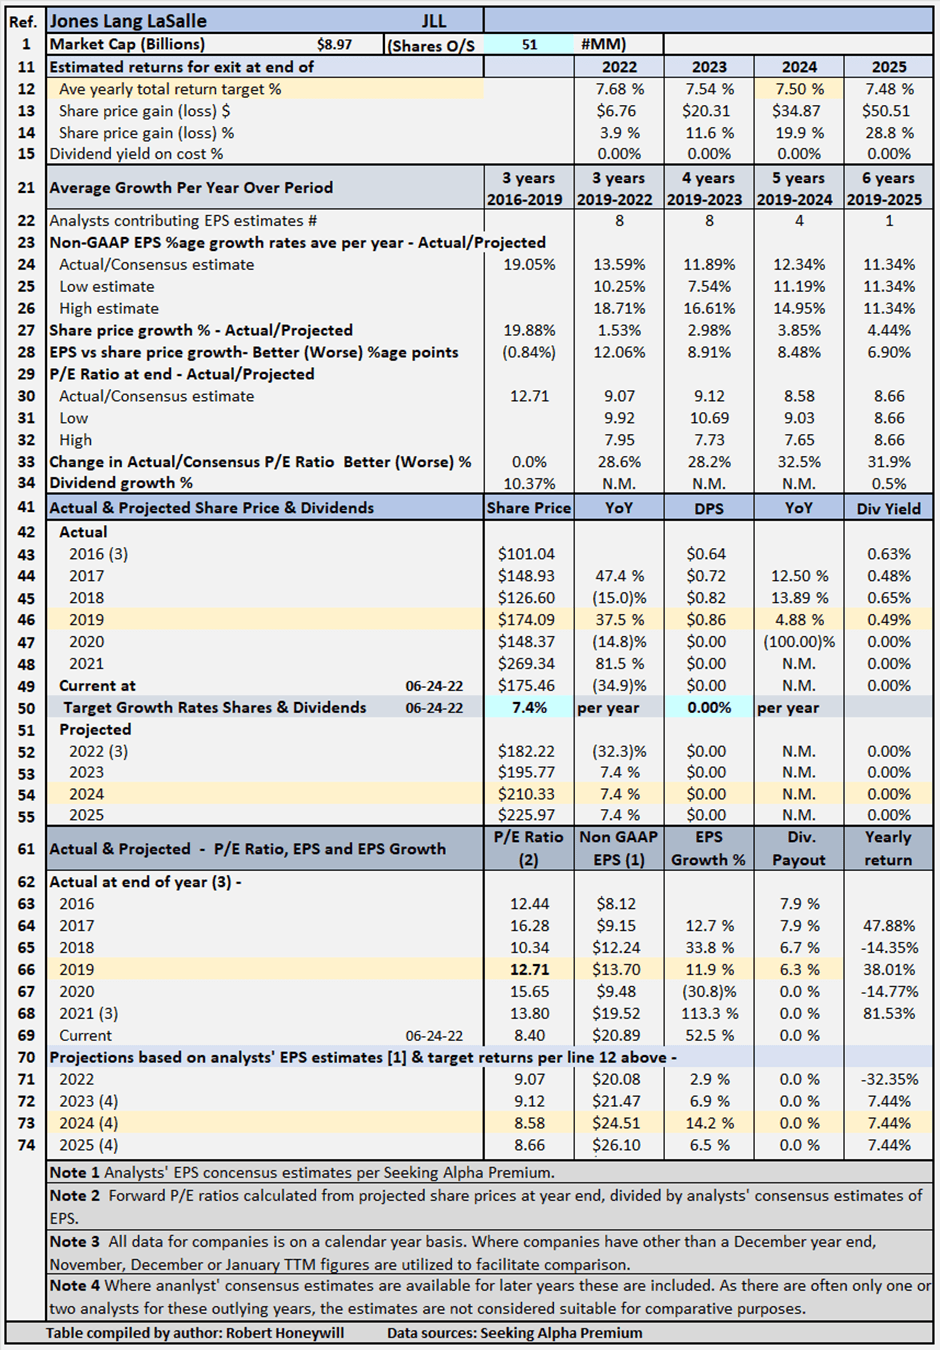
Table 1 documents historical data from 2016 to 2019, including share prices, P/E ratios, EPS and DPS, and EPS and DPS growth rates. The table also includes estimates out to 2025 for share prices, P/E ratios, EPS and DPS, and EPS and DPS growth rates (note – while estimates are shown for analysts’ EPS estimates out to 2023, 2024 and 2025 where available, estimates do tend to become less reliable the further out the estimates go. These estimates are only considered sufficiently reliable if there are at least three analysts’ contributing estimates for the year in question). Table 1 allows modeling for target total rates of return. In the case shown above, the target set for total rate of return is 7.5% per year through the end of 2024 (see line 12), based on buying at the June 24, 2022, closing share price level. As noted above, estimates become less reliable in the later years. I have decided to input a target return based on the 2024 year, which has EPS estimates from four analysts, because it allows for the impact of the projected EPS growth rates to be taken account of in the assessment of the value of JLL shares. The table shows to achieve the 7.5% return, the required average yearly share price growth rate from June 24, 2022, through Dec. 31, 2024, is 7.4% (line 50). There are currently no dividends to contribute to the target 7.5% total return. Table 2 below summarizes relevant data flowing from the assumption of a target 7.5% total return through end of 2024.
Targeting a 7.5% Return
Table 2 – Targeting a 7.5% return
Seeking Alpha Premium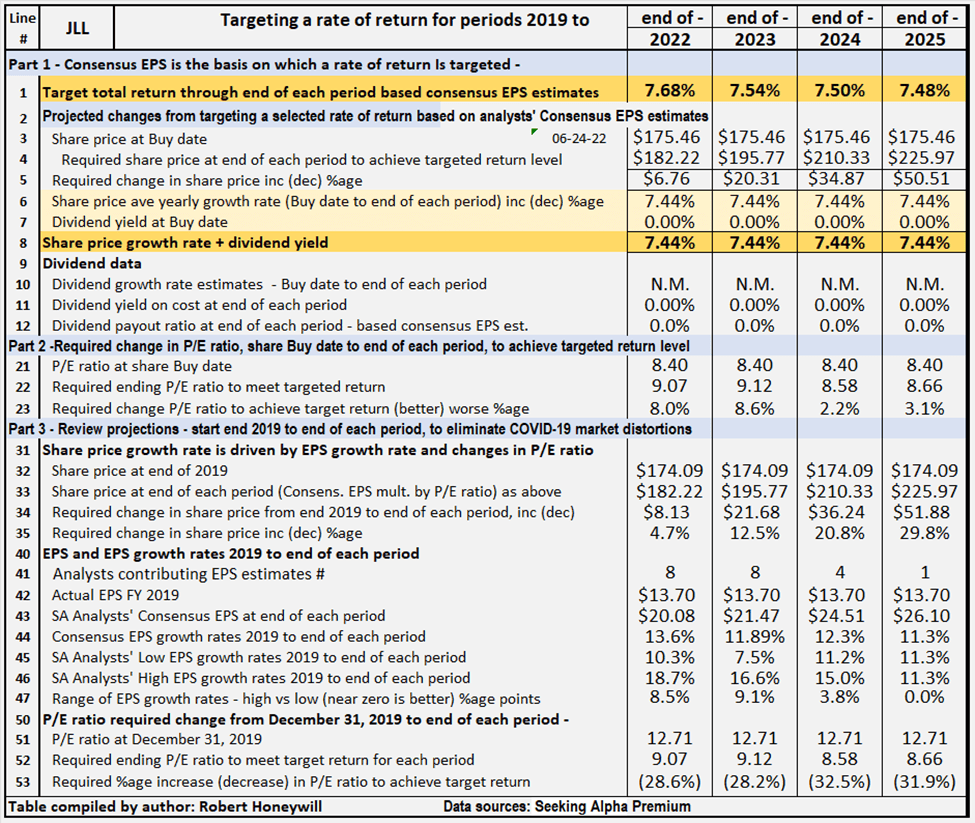
Table 2 provides comparative data for JLL, assuming share price grows at rates sufficient to provide total rate of return of 7.5%, from buying at closing share price on June 24, 2022, and holding through end of 2024. All EPS estimates are based on analysts’ consensus estimates per SA Premium.
Comments on Table 2 are as follows
Part 1 – Consensus EPS (Case 1.1) (lines 1 to 12)
Part 1 shows the amounts the share price would need to increase to achieve a 7.5% rate of return through end of 2024. The share price would need to increase by $34.87 from the present $175.46 to $210.33 at end of 2024, for the 7.5% rate of return to be achieved.
Part 2 – Required change in P/E ratio to achieve target 7.5% return (lines 21 to 23)
Part 2 shows the amount the P/E ratio would need to increase or decrease by, from buy date to end of 2024, to achieve the share price level at the end of 2024 necessary to achieve the targeted 7.5% return. For JLL, the P/E ratio at buy date would need to increase by 2.2% through the end of 2024 for the 7.5% return to be achieved. Requiring an increase in the P/E ratio to achieve a targeted return would normally be regarded as a negative. However, due to the distortions of earnings and sentiment owing to the COVID-19 pandemic, it’s difficult to judge whether the change in P/E ratio is a negative or the result of a distorted starting point. To overcome this difficulty, in Part 3, I review the necessary change in P/E ratio from a different, pre-COVID-19 starting point.
Part 3 – Projected change in P/E ratios from 2019 to 2024 (lines 31 to 46)
In Part 3, I start with the share price at Dec. 31, 2019, before the impact of the COVID-19 pandemic on earnings and market sentiment. The end point is projected to share price at end of 2024, when it’s assumed the market and earnings are no longer materially impacted by the pandemic and EPS growth has brought the P/E ratio back closer to historical levels. For JLL, the share price needs to increase by $36.24 from $174.09 at Dec. 31, 2019, to $210.33 at end of 2024, and as detailed in Part 1, at $210.33, the targeted 7.5% rate of return would be achieved. For JLL, there are a number of givens in our assumptions. Using these givens, the change in the share price from Dec. 31, 2019, to end of 2024, can be expressed as mathematical formulae as follows:
[A] Change in share price, due to effect of EPS growth rate, equals share price at beginning multiplied by (1 plus average yearly Consensus EPS growth rate) to the power of number of years invested.
= $174.09*(1+12.3%)^5 = $311.46 (that would be the result if the share price grew in line with analysts’ consensus EPS growth, and the P/E multiple remained constant)
[B] Change in share price due to change in P/E ratio equals share price adjusted for EPS growth rate multiplied by (1 plus/minus percentage change in P/E ratio).
= $311.46*(1-32.5%) = $210.33 (price required at end of 2024 to provide 7.5% total return, buying at current share price)
The increase of $137.37 ($311.46 minus $174.09) due to the average yearly EPS growth rate is cumulative, and share price will continue to increase the longer the shares are held and the growth rate continues. The decrease of $101.13 due to a change in the P/E ratio ($311.46 minus $210.33) has a one-off effect. A continuing high or low P/E ratio has no impact on future share price growth, only a change in P/E ratio affects share price, not the level of P/E ratio.
Next, rather than targeting a specific rate of return, I look at historical P/E ratios to see the potential impact on returns of a reversion to these levels of P/E ratio. First of all, I should explain a little about the Dividend Growth Income+ Club approach to financial analysis of stocks.
Understanding The Dividend Growth Income+ Club Approach
Copyright: Robert Honeywill 2020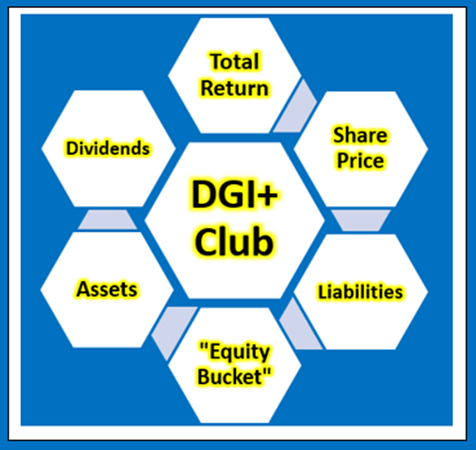
Total Return, Dividends, Share Price
The only way an investor can achieve a positive return on an investment in shares is through receipt of dividends and/or an increase in the share price above the buy price. It follows what really matters in share value assessment is the expected price at which a buyer will be able to exit shares, and expected cash flow from dividends.
Changes in Share Price
Changes in share price are driven by increases or decreases in EPS and changes in P/E ratio. Changes in P/E ratio are driven by investor sentiment toward the stock. Investor sentiment can be influenced by many factors, not necessarily stock-specific.
“Equity Bucket”
Earnings are tipped into the “Equity Bucket” for the benefit of shareholders. It’s prudent to check whether distributions out of and other reductions in the “Equity Bucket” balance are benefiting shareholders.
JLL’s Projected Returns Based On Selected Historical P/E Ratios Through End Of 2024
Table 3 below provides additional scenarios projecting potential returns based on select historical P/E ratios and analysts’ consensus, low, and high EPS estimates per Seeking Alpha Premium through end of 2025.
Table 3 – Summary of relevant projections JLL
Seeking Alpha Premium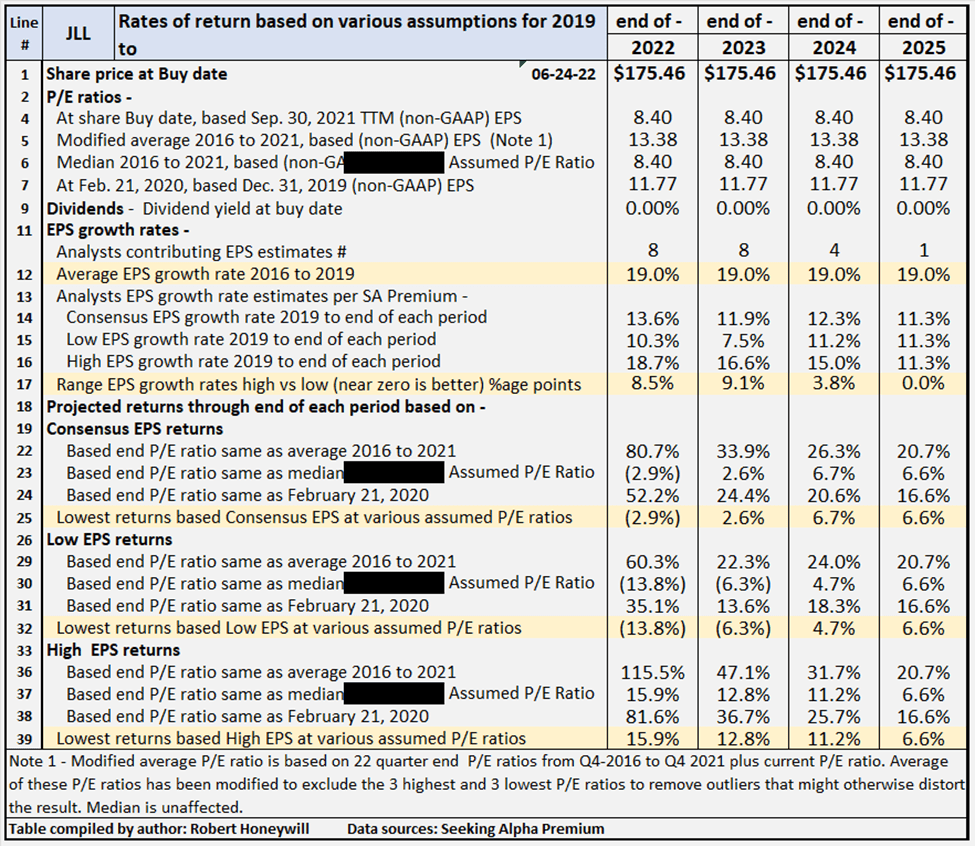
Table 3 provides comparative data for buying at closing share price on June 24, 2022, and holding through the end of years 2021 through 2025. There’s a total of nine valuation scenarios for each year, comprised of three EPS estimates (SA Premium analysts’ consensus, low and high) across three different P/E ratio estimates, based on historical data. JLL’s P/E ratio is presently 8.40. For many companies, their current P/E ratios are distorted by the impact of COVID-19. For JLL, the present P/E ratio is below the range of historical P/E ratios. Table 3 shows potential returns from an investment in shares of the company at a range of historical level P/E ratios. This analysis, from hereon, assumes an investor buying JLL shares today would be prepared to hold through 2024, if necessary, to achieve their return objectives. Comments on contents of Table 3, for the period to 2024 column follow.
Consensus, low and high EPS estimates
All EPS estimates are based on analysts’ consensus, low and high estimates per SA Premium. This is designed to provide a range of valuation estimates ranging from low to most likely, to high based on analysts’ assessments. I could generate my own estimates, but these would likely fall within the same range and would not add to the value of the exercise. This is particularly so in respect of well-established businesses such as JLL. I believe the “low” estimates should be considered important. It’s prudent to manage risk by knowing the potential worst-case scenarios from whatever cause.
Alternative P/E ratios utilized in scenarios
- The actual P/E ratios at share buy date based on actual non-GAAP EPS for FY-2020.
- A modified average P/E ratio based on 23 quarter-end P/E ratios from Q4 2016 to Q1 2022 plus current P/E ratio in Q2 2022. The average of these P/E ratios has been modified to exclude the three highest and three lowest P/E ratios to remove outliers that might otherwise distort the result.
- A median P/E ratio calculated using the same data set used for calculating the modified average P/E ratio. Of course, the median is the same whether or not the three highest and lowest P/E ratios are excluded. In the case of JLL, I have chosen to use an assumed P/E ratio of 8.40, based on current actual P/E ratio, in place of JLL’s historical median of 12.92. I have done this to provide an idea of the impact on returns of the multiple continuing at current levels, rather than increasing back to historical levels.
- The actual P/E ratio at Feb. 21, 2020, share price, based on 2019 non-GAAP EPS. The logic here is the market peaked around Feb. 21, 2020, before any significant impact from COVID-19 became apparent. This makes the P/E ratios at Feb. 21, 2020, reflective of most recent data before distortion of P/E ratios by the impact of the coronavirus pandemic.
Reliability of EPS estimates (line 17)
Line 17 shows the range between high and low EPS estimates. The wider the range, the greater disagreement there is between the most optimistic and the most pessimistic analysts, which tends to suggest greater uncertainty in the estimates. There are four analysts covering JLL through end of 2024. In my experience, a range of 3.8 percentage points difference in EPS growth estimates among analysts is not overly large, suggesting some degree of certainty, and thus greater reliability.
Projected Returns (lines 18 to 39)
Lines 25, 32 and 39 show, at a range of historical P/E ratio levels, JLL is conservatively indicated to return between 4.7% and 11.2% average per year through the end of 2024. The 4.7% return is based on analysts’ low EPS estimates and the 11.2% on their high EPS estimates, with a 6.7% return based on consensus estimates. Those are the lowest of the returns under the consensus, low and high EPS scenarios. At the high end of the projected returns for JLL, which assume P/E ratios return to historical average levels ~13.4, the indicative returns range from 24.0% to 31.7%, with consensus 26.3%. The difference between best and worst cases is an indication of the degree of certainty, or lack thereof, in analysts’ estimates.
Review Of Historical Performance For JLL
JLL Stock History Of Shareholder Returns
In Table 4 below, I provide details of actual rates of return for JLL shareholders investing in the company over the last six years.
Table 4
Seeking Alpha Premium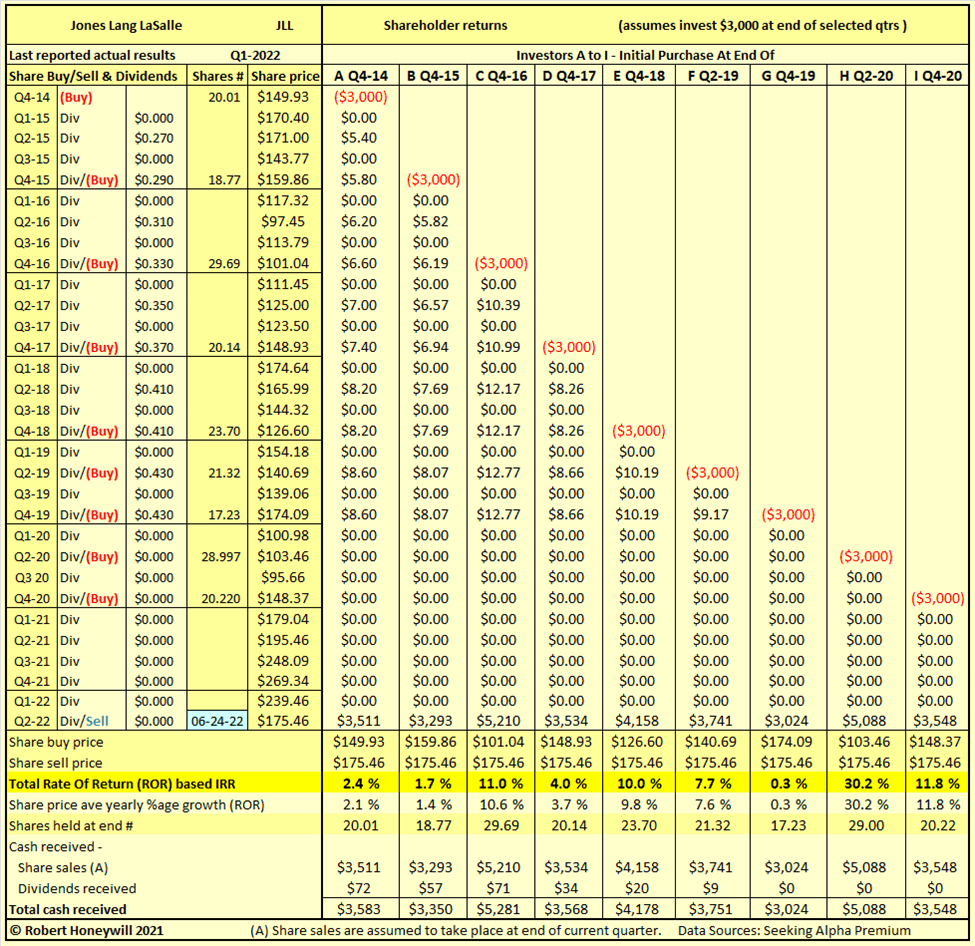
For many stocks where I create a table similar to Table 4 above, I find a wide range of returns indicating a degree of volatility and risk. Table 4 above shows the results for JLL were single-digit returns, ranging from 0.3% to 7.7%, for five of nine different investors, each investing $3,000 over the last six years and holding to the present. The returns for three other investors ranged from 10.0% to 11.8%. The remaining investor shows a return of 30.2% for holding a little over two years. The high return is primarily due to buying at a very low share price of $103.46 soon after onset of the COVID-19 pandemic. Rate of return is affected by duration held, as well as share buy and sell price, so this average return will gradually come down the longer the shares are held. These rates of return are not just hypothetical results. They are very real results for anyone who purchased shares on the various dates and held through to June 24, 2022. In the above examples, the assumed share sale price is the same for all investors, illustrating the impact on returns of the price at which an investor buys shares.
Checking JLL’s “Equity Bucket”
Table 5.1 JLL Balance Sheet – Summary Format
Seeking Alpha Premium & SEC filings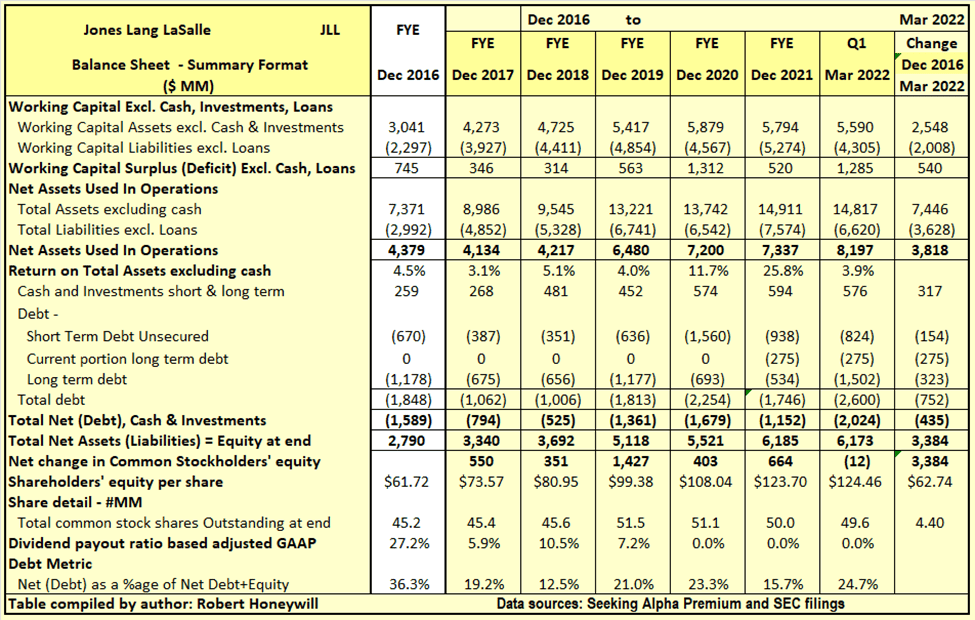
Over the 5.25 years, end of 2016 to end of Q1-2021, JLL has increased net assets used in operations by $3,818 million largely due to the HFF acquisition in FY-2019. The $3,818 million increase in net operating assets was funded by an increase in shareholders’ equity of $3,384 million and an increase in debt net of cash of $435 million. Net debt as a percentage of net debt plus equity decreased from 36.3% at end of 2016 to 24.7% at end of FY-2021. Outstanding shares increased by 4.4 million from 45.2 million to 49.6 million, over the period, due to the HFF acquisition, plus shares issued for stock compensation, partially offset by share repurchases from employees to meet their tax obligations. The $3,384 million increase in shareholders’ equity over the last 5 years is analyzed in Table 5.2 below.
Table 5.2 JLL Balance Sheet – Equity Section
Seeking Alpha Premium & SEC filings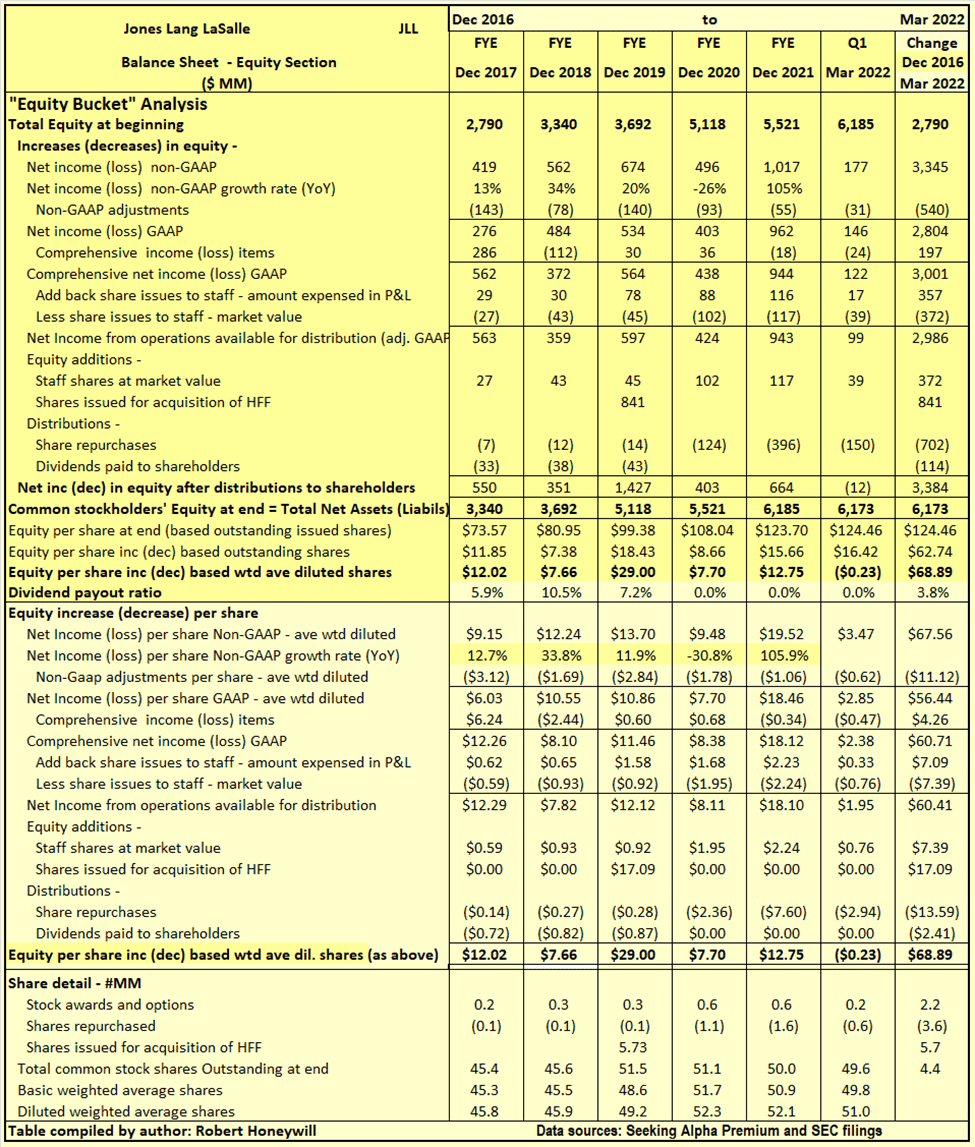
I often find companies report earnings that should flow into and increase shareholders’ equity. But often the increase in shareholders’ equity does not materialize. Also, there can be distributions out of equity that do not benefit shareholders. Hence, the term “leaky equity bucket.” I find this happening to some extent with Jones Lang LaSalle, as explained below.
Explanatory comments on Table 5.2 for the period end FY-2016 to end FY-2021
- Reported net income (non-GAAP) over the 5.25-year period totals to $3,345 million, equivalent to diluted net income per share of $67.56.
- Net income growth has been strong through end of 2019, with a reversal in 2020 due COVID-19 impact. EPS growth averaged 19.05% per year from 2016 to end of 2019 (see Table 1, line 24).
- Over the 5.25-year period, the non-GAAP net income excludes a significant $540 million of GAAP income (EPS effect $11.12) of items regarded as unusual or of a non-recurring nature in order to better show the underlying profitability of JLL. Such exclusions by companies are usually expense items, as is the case for JLL. The net effect is to significantly increase non-GAAP net income above GAAP net income. In JLL case, the adjustments relate primarily to intangibles amortization, for which there is no cash impact, so I do not see these ongoing adjustments as a concern from a “leaky equity bucket” or liquidity aspect.
- Other comprehensive income includes such things as foreign exchange translation adjustments in respect to buildings, plant, and other facilities located overseas and changes in valuation of assets in the pension fund – these are not passed through net income as they fluctuate without affecting operations and can easily reverse in a following period. Nevertheless, they do impact on the value of shareholders’ equity at any point in time. For JLL, these items amounted to positive $197 million (EPS effect $4.26) over the 5.25-year period.
- Amount taken up in equity to account for shares issued to staff over the 5.25 years is $357 million. This compares to an estimated market value of $372 million at the time of issue for these shares. The estimated market value of these shares is very little different to that allowed for in arriving at non-GAAP EPS, so no “leaky equity bucket” here.
- By the time we take the above-mentioned items into account, we find, over the 5.25-year period, the reported non-GAAP EPS of $67.56 ($3,345 million) has decreased to $60.41 ($2,986 million), added to funds from operations available for distribution to shareholders.
- Dividends of $114 million, and share repurchases of $702 million, together totaled $816 million. These were adequately covered by $2,986 million generated from operations, resulting in a net increase of $2,170 million in equity from operating activities.
- This net $2,170 million increase in equity from operations, together with the $841 million of shares issued for the HFF acquisition, and the $372 million capital raised through share issues to staff, resulted in the $3,384 million net increase in shareholders’ funds per Table 5.1 above.
Summary And Conclusions
Per Table 3 above, based on consensus EPS and a return to higher historical average P/E multiple, indicates returns for buying now and holding through end of 2024 could be in the order of ~24% to over 30%. Even if the multiple remains at current depressed level returns from ~5% to 11% are indicated based on SA analysts EPS estimates. With high upside opportunity and low downside risk in respect of returns, and a solid conservative balance sheet, Jones Lang LaSalle is rated a Strong Buy.
Be the first to comment