

Justin Sullivan
Investment Thesis
Johnson & Johnson (NYSE:JNJ) is the world’s largest pharmaceutical company by market cap – currently $453bn – and also by revenue, generating $93.8bn in 2021.
In terms of income, Pfizer (PFE) earned $22.15bn of income compared to JNJ’s $20.9bn in 2021, and this year, it’s conceivable that Pfizer will generate more revenue, forecasting for ~$100bn, vs. JNJ’s forecast for revenues of ~$97.8bn.
This is largely due to Pfizer’s 2 COVID drugs, Paxlovid and Comirnaty, forecast to generate >$50bn of revenues between them this year, however, and it’s highly likely that in 2023 and subsequent years, JNJ revenues and income will be significantly greater than Pfizer’s.
JNJ’s price to sales ratio in 2021 was 4.9x, which matches the average of the “Big 8” US pharma companies, which are, in order of market cap size, JNJ, Eli Lilly (LLY), Pfizer (PFE), AbbVie (ABBV), Merck & Co (MRK), Bristol Myers Squibb (BMY), Amgen (AMGN), and Gilead Sciences (GILD).
Over the past three years, JNJ stock has gained in value by 31%, reaching a price of $172.5 at the time of writing, discounted slightly to May’s all-time peak value of $186. Amongst the “Big 8” US pharmas, this is the worst five-year performance with the exception of Gilead, whose shares have fallen in value by 8%. The sector average gain is 61%.
Perhaps it’s not surprising that a company as large as JNJ struggles to drive share price gains, particularly given that pharmaceutical companies are often valued according to revenue growth potential, and the perceived ability of their drug development pipelines to one day replace the revenue streams of currently commercialized drugs, as patents expire and better therapeutics are brought to market.
In the case of Eli Lilly, for example, despite its generating $28.3bn of revenues vs. Pfizer’s $81bn, it has the higher market cap valuation because investors believe its pipeline assets have greater potential to generate revenue growth. Since JNJ is already generating nearly $100bn of revenues per annum, investors are inevitably more skeptical that the pharma can generate rapid revenue growth.
As such, investing in JNJ is often considered more like buying a fixed interest security than an equity. The company pays a reasonably generous dividend yielding 2.62% at the time of writing, while the share price is generally resilient and doesn’t experience too many troughs – its lowest price in the past five years being $120, at the height of the pandemic induced market selloff in March 2020.
With all that said, JNJ did achieve revenue growth of 13.5% between 2020 and 2021, and if it meets guidance this year, will drive another 5% growth this year. The company also is forecasting for adjusted earnings per share (“EPS”) of $10.65 – $10.75, a year-on-year increase of nearly 10%, which gives a forward price to earnings ratio of ~16X, which beats the historical sector average of ~23x.
All of the above provides some evidence that JNJ is a perfectly good stock to think about holding, providing incremental growth in the value of the share price, a solid dividend, downside protection, and some intriguing growth opportunities.
As important as any pharma’s drug development pipeline is, it’s equally important for a pharma the size of JNJ for investors to understand what they’re buying at the present time, and in this post I will break down JNJ division by division, discuss performance – including Q222 earnings announced on July 19, and speculate about an appropriate share price target.
JNJ Overview – Consumer Health
JNJ Consumer Health Division – historical annual / quarterly performance. (JNJ filings)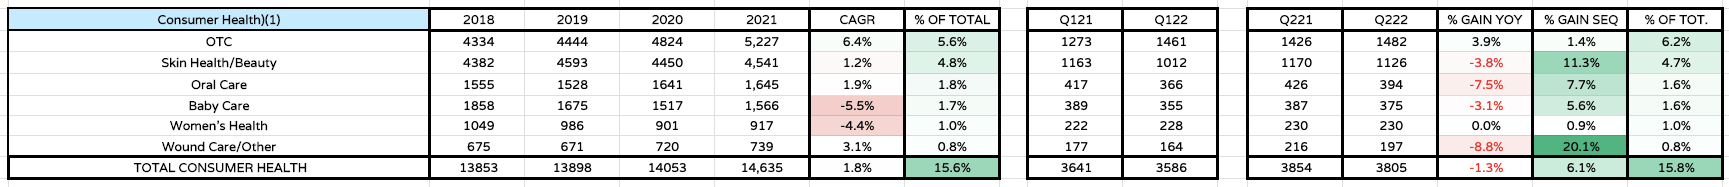
JNJ is probably best known for its consumer health division which provides all sorts of “household name” products such as Band Aid, Tylenol, shampoo, Listerine and numerous others.
As we can see from my table above, this division’s growth between 2018 and 2021 has been incremental – the CAGR is just 1.8%. The most successful division by revenues – OTC – also is the fastest growing, realizing a CAGR of 6.4%, whilst the smaller sectors Baby Care and Women’s Health have suffered somewhat. Nevertheless, JNJ has consistently driven growth in its two largest sectors, OTC and Skin Health/Beauty, which is an encouraging sign.
In Q222, we can see that Consumer Health revenues actually fell year-on-year despite a strong performance from the OTC sector – otherwise, all sectors were flat or down. Management puts this down to numerous factors – COVID-19 related mobility issues, the strong dollar, and the impact of acquisitions and divestitures, offset by price increases.
Consumer Health makes up a smaller proportion of JNJ’s overall business than many people may think – just 16%, so although Q222 results may be a little disappointing, the mitigating factors are understandable, the sequential (quarter on quarter) growth has been strong, and given the current global economic picture, Consumer Health has shown admirable resilience in my view, and could surprise to the upside in the second half for 2022.
Immunology
JNJ Immunology Division – historical annual / quarterly performance. (JNJ filings)
JNJ’s Immunology Division is a global powerhouse, and Medical Devices aside, its largest division, accounting for 18.4% of total revenues of $24.02bn in Q222, and 18% 2021.
On an annual basis the division has driven some impressive growth – a CAGR of 8.5% between 2018 – 2021. Stelara – approved to treat Psoriatic Arthritis, Crohn’s Disease, and other auto-immune conditions – drove >$9bn of revenues in FY21, however its patent protection expires next year, meaning sales will likely peak in 2022, and fall by 15-25% in each successive year. Remicade has already experienced loss of exclusivity (“LOE”) and as we can see, sales have declined by 15% per annum.
Tremfya is JNJ’s long-term replacement for Stelara / Remicade, and as we can see, sales have been growing rapidly – nearly $600m in Q222, which is +24% year-on-year, although only 1.2% sequentially. The issue is that Tremfya – an inhibitor of interleukin-23 approved in plaque psoriasis and psoriatic arthritis and targeting several more markets – faces some stiff competition.
AbbVie’s Skyrizi and Rinvoq are rapidly gaining new approvals and are forecast to share $15bn per annum of revenues at their peak, while Novartis’ (NVS) Cosentyx, Eli Lilly’s Taltz, Pfizer’s Etrasimod and Bristol Myers Squibb’s Zeposia will all challenge for the market share given up by Stelara, and AbbVie’s $20bn per annum selling Humira when they go off patent next year.
As such, one of JNJ’s flagship pharmaceutical divisions looks a little under threat and that ought to be a concern for investors.
Oncology
JNJ Oncology Division – historical annual / quarterly performance. (JNJ filings)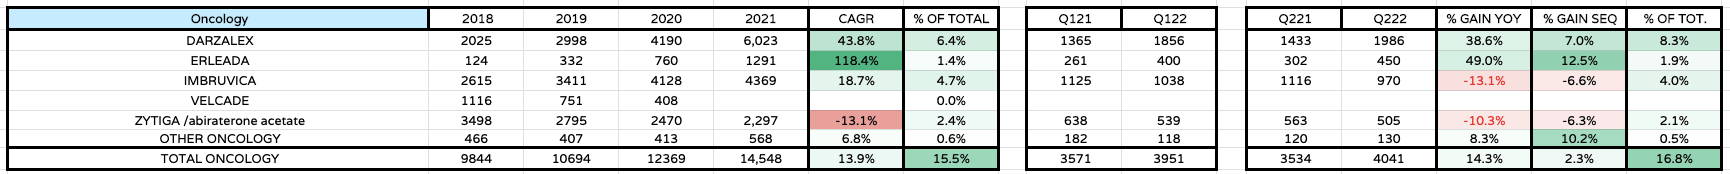
JNJ’s oncology divisions accounted for ~16% of the company’s revenues in FY21, and 17% in Q222. The historical growth has been encouraging – a CAGR of 14%, which is the same amount as the division grew year-on-year between Q221 and Q222.
Darzalex is the star – $6bn of revenues in FY21, and nearly $2bn last quarter – up 39% year-on-year. The multiple myeloma treatment is on track to become a $10bn per annum selling asset by 2026, analysts believe, which helps to offset any losses within the immunology division, as will growing sales of Imbruvica, also considered to have a peak sales of >$10bn by 2026 in some quarters, although a loss of patent exclusivity will follow soon after. Erleada is another exciting prospect in prostate cancer, as AstraZeneca’s Zytiga has its own patent expiry issues.
In summary, oncology looks strong and I suspect JNJ will make it an area of focus in the coming years. Patent expiries are a constant thorn in the side of pharmas, but investors can likely bet on continuing growth within JNJ’s oncology division, as mentioned, offsetting likely losses in immunology.
Remaining Pharmaceutical Divisions
JNJ remaining pharmaceutical divisions – historical annual / quarterly performance. (JNJ filings)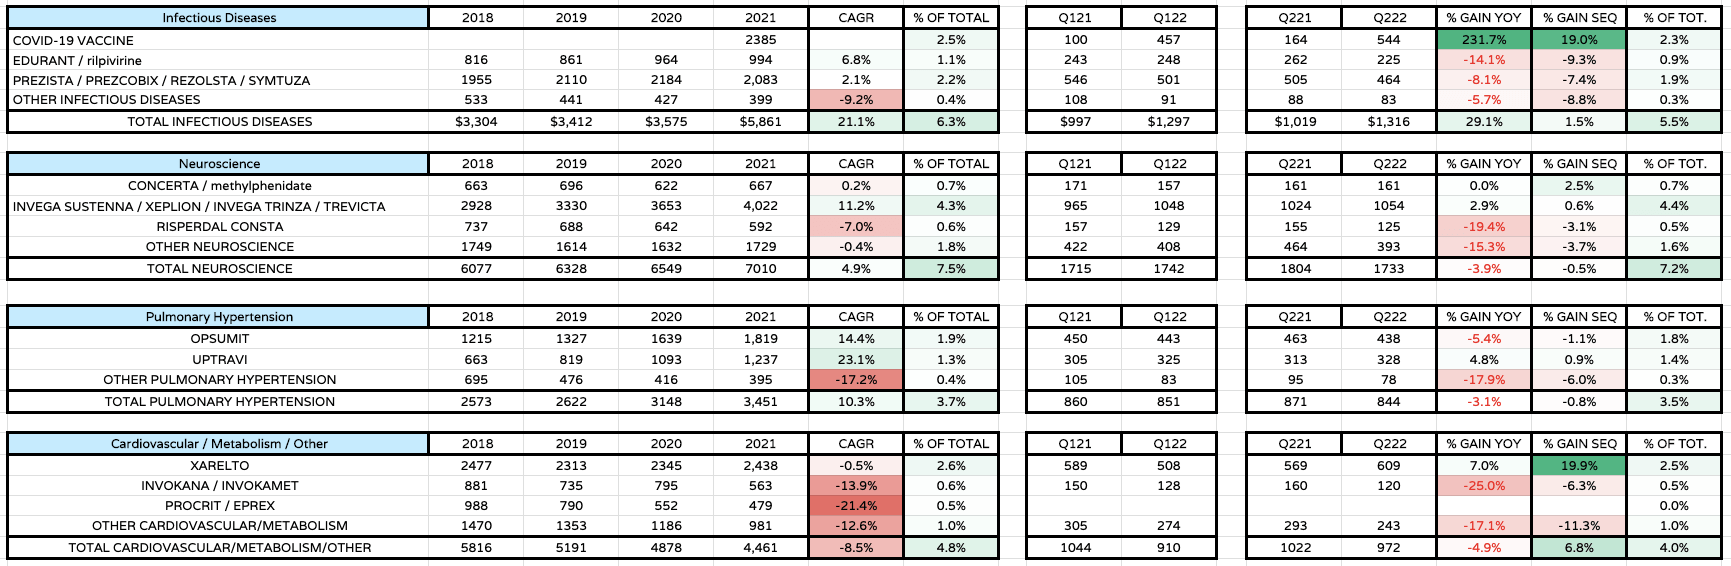
Infectious diseases, Neuroscience, Pulmonary Hypertension and Cardiovascular / Metabolism are JNJ’s remaining pharmaceutical divisions, and as we can see above there are some issues to highlight.
Firstly, the COVID-19 vaccine sales that have helped the Infectious Disease division grow revenues at a CAGR of 21% will likely not last much beyond 2022, as pandemic pressures are forecast to ease, and the single shot vaccine has not been as widely adopted as Pfizer’s Comirnaty or Moderna’s (MRNA) SpikeVax, for example, and is unlikely to thrive in a private market.
Secondly revenues in the cardiovascular division have been falling, although blood thinner Xarelto staged a comeback last quarter. A patent expiry for the drug looms in 2024, however. In pulmonary hypertension, Uptravi and Osumit are performing well, although JNJ paid $30bn to acquire this franchise when it took over Actelion in 2017.
Neuroscience appears a solid division, despite revenues dropping by 4% year-on-year, and 0.5% sequentially, and overall, my conviction would be that investors can expect very marginal growth across these four divisions over the coming years.
Medical Devices
JNJ Medical Devices division – historical annual / quarterly performance. (JNJ filings)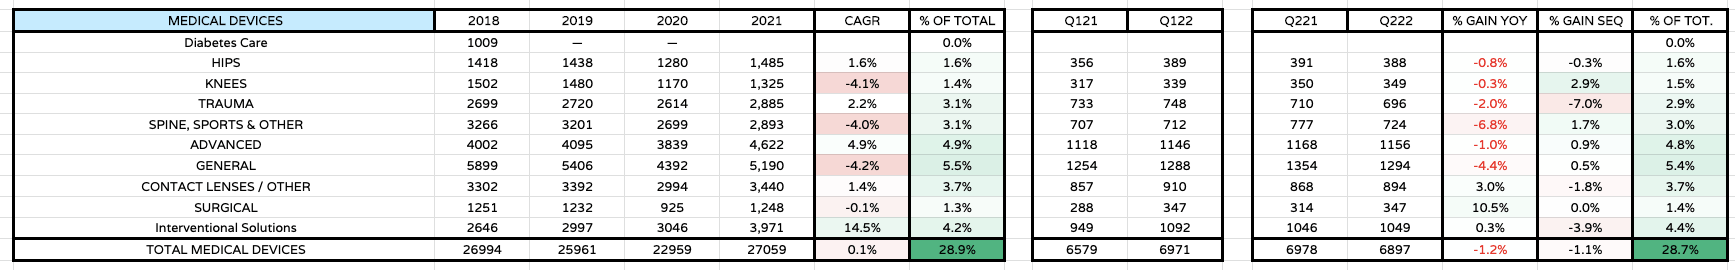
Again, JNJ may not be known for its Medical Devices division, but is in fact the company’s largest, accounting for 29% of total revenues in Q222. As we can see in the table above, growth has been flat in recent years, and performance in Q222 was perhaps disappointing.
Once again, however, management has blamed COVID headwinds and a strong dollar for the underperformance, and Vice President, Investor Relations Jessica Moore had this to say on the Q222 earnings call:
Drivers for growth across the MedTech business include procedure recovery, focused commercial strategies and differentiated new products driving enhanced or sustained market share positions in nearly all of our 11 priority platforms, each generating over $1 billion in annual sales. For additional context, all franchises were affected by regional COVID-19 mobility restrictions and selling days had an immaterial impact on results in the quarter.
I agree with Moore that 11 priority platform driving >$1bn revenues is very impressive, as is $27bn of revenues generated in 2021. Demand for these types of products does not go out of fashion, and given an ageing global population, Medical Devices offers solid growth prospects for the long-term, is practically recession proof, and provides excellent ballast, alongside Consumer Health, against the more fluctuating fortunes of the pharmaceutical division.
JNJ Share Price Target
Over the past 12 months, the spread between JNJ’s high and low share price is the smallest amongst the US’ “Big 8” pharmaceuticals, at 20%. It’s hardly surprising when we consider that JNJ’s market cap is nearly $150bn more than its nearest rival, Eli Lilly, which represents a far more speculative investment opportunity, based on the promise of drugs that are unproven in a commercial setting.
JNJ is therefore likely the least risky investment amongst the US big pharmas, but equally it’s not going to provide investors with too many exciting overnight gains – it’s just too big for that.
JNJ’s net profit margin has risen above 20% in recent years – in Q222 it was nearly 28%, on an adjusted basis, with net earnings being $6.9bn, according to the company’s 8K submission.
I use discounted cash flow analysis and EBITDA multiple analysis to calculate a share price target for JNJ – I will share detailed findings in a separate post soon – and I use a CAGR of 3.5%, with profit margin increasing from 20% in 2022, to nearly 24% by 2030, when I forecast revenues of ~$128bn, and free cash flow of >$35bn, and perhaps >$45bn when we add back depreciation and amortization.
Using a weighted average cost of capital of ~10%, my DCF analysis provides me with a target share price of exactly $173, however – the price at which JNJ shares trade at today! My EBITDA calculation is a little higher – $199, for an average of $186.
Conclusion – Too Big To Fail, Too Big To Grow – JNJ Is Unlikely To Let Its Investors Down
My share price target sums up the JNJ opportunity accurately, in my view. The company is in some ways a victim of its own success. Unlike with other pharmas – or earlier stage biotechs – a billion or so of revenue lost or gained here and there makes very little difference to the share price fortunes of JNJ.
The company’s total liabilities of >$100bn mean it is leveraged to the tune of nearly 5x EBITDA, which is concerning, but the debt is rated AAA at Standard & Poor’s, and JNJ has few cash flow concerns.
Investors may be better off buying JNJ’s debt rather than its equity – the yield is superior to the yield from the dividend, and there is better protection – but with that said, there is always a chance that JNJ develops the next major cancer drug, or the next COVID antiviral – resistance to Pfizer’s Paxlovid is growing – or a cardiovascular or hypertension or diabetes drug that adds another $10bn of revenues to the top line.
JNJ is so large and well resourced it would be almost foolish to bet against a development of that nature, and with so much downside protection in place, it’s a safe bet to make. My gut feeling is that in five years’ time JNJ stock will be worth ~30% more than it is today, just as today’s price is ~30 more than five years ago. That’s a perfectly decent return to contemplate whilst collecting the dividend.
Be the first to comment