

deberarr
Introduction
Goldman Sachs (NYSE:GS) posted Q2 results about a month ago. Although they topped expectations, the slowdown year-over-year has been dramatic. This can also be seen in the share price as its all-time high was over 400 bucks back in the summer of 2021. This is my first article on Goldman Sachs which is why I’m going to do a business overview before diving into the most recent figures as this helps me clarify my thoughts on the business as a whole. I hope the readers find it informative even if you have followed Goldman for a while.
Business Model
I read through all of Goldman’s CEO letters since their listing in 1999 to get a feel of the company. All CEOs from Paulson to Solomon makes it very clear that the business model is inherently cyclical in nature. The business is characteristically transaction driven. The transactions are, in turn, driven by economic activity. Look for example at investment banking. When the economy is running hot, companies expand by investing, M&As, IPOs, secondary equity offerings and debt offerings. Or look at asset management, where the fees are based on the values of the listed or unlisted instruments. These instruments, as we have seen during 2022, can be very volatile and thus impacts the fees Goldman can collect. It’s worth mentioning that private asset fees are more stable than listed asset fees as clients in private assets usually pay a fixed fee (based on their commitment) for a number of years before paying fees on net asset values. Then we have trading, which profits off of client activity. When do clients usually trade? When markets are volatile or when times are good.
One thing that bugs me about banking is that it sometimes seems that the businesses are built for the employees and not for the owners. Think of Salomon Brothers in the ’80s or certain financial institutions during the global financial crisis. The employees got rich off their bonuses due to record earnings in 2007 while the shareholders (and the taxpayers) paid the bill the ensuing years. With the rant out of the way, let’s take a closer look at how Goldman makes money.
Financial Profile
Since Goldman Sachs went public in 1999, the company has returned 8.9% p.a. for its shareholders, multiplied its revenues by 4.4 times, its equity capital by 10.8 times and has 2.9 times more employees. Over the last 10 years the stock has returned 14.9% p.a. while the S&P 500 Financials index (total return) has earned 13.4%. That’s an excess return of about 1.5%. As such, Goldman has been a relatively good stock pick for those who got in early although Goldman has been involved in their fair share of controversies as well.
Long-term financial development (shaded area indicates recession) (GS financial statements)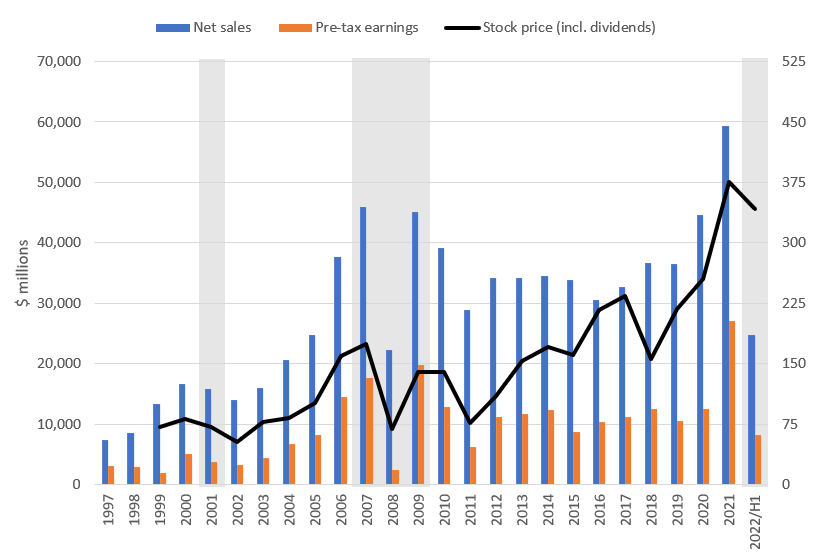
Goldman has stated that their goal is to produce higher and more consistent returns. The key word here is consistent. Looking at Goldman’s long-term financial development (net revenues and pre-tax earnings), we see that Goldman’s business fortunes tends to move fairly consistently with the booms and busts of the economy. The effect on pre-tax earnings is amplified due to the scalable nature of the banking industry. Let me clarify what I mean by that. The largest part of the cost structure in investment banking, asset management, and trading is employee compensation which consists of a fixed and a variable part. The fixed part is easily larger than the variable part and what that means is that when net revenues increase, the cost basis actually stays fairly flat or goes slightly up due to higher bonuses. So the increased revenues fall straight to the bottom-line (pre-tax). This is what I refer to when I mention “scalability of banking” in this article. This is of course also called operating leverage which is perhaps more often used. What’s noteworthy from the graph above is that in year 2021, Goldman finally surpassed their previous record sales in 2007 and record pre-tax earnings in 2009. As we have already noticed from the first half of 2022, the going has slowed quite a lot versus the comparable period in 2021. Year 2022 is however shaping up to be quite a profitable year compared to the period 2010-2020.
Long-term profitability and book value development (GS financial statements)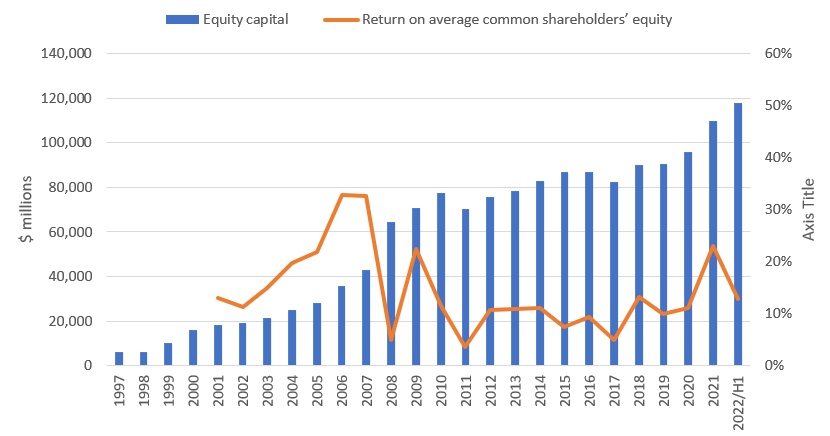
Banking used to be a more profitable business. At least when you compare the 2000s vs. the post 2010 period. In the graph above I have charted the equity capital and return on equity (ROE) development since 1997 to 2021. The average ROE from 2001 to 2010 is 18.5% while the average ROE from 2010 onwards is 10.5%. These figures obviously reflect completely different economic regimes and that’s also the point. With the increasing regulation in the financial industry and additional costs related to it, the return on equity has been squeezed significantly for Goldman and other financial institutions. Year 2021 is the exception. I’d be surprised if the ROE in year 2021 can be achieved sustainably over the 2020s. With the first half of year 2022 in the books, we know that the ROE won’t be as high as it was in 2021. Beyond that, I don’t see any major catalyst that could propel the ROE significantly higher as we most likely won’t have many years as good as 2021. I suspect the ROE to go back to 10-15% range in the future. Let’s now take a look under the hood to see what Goldman actually does.
Business Segments
Below is a recap on Goldman’s business segments. They report under four segments which are:
- Investment banking which includes (1) financial advisory on M&A and other corporate finance transactions, (2) capital raisings (equity and debt underwritings) in addition to (3) providing financing to corporate clients (corporate lending)
- Global markets include trading and financing in fixed income, currencies, and commodities (FICC Intermediation and FICC Financing) in addition to trading and financing in equity securities (equity intermediation and equity financing)
- Asset management invests client assets in order for the clients to make a satisfactory return on their capital. You can think of Goldman as a one-stop shop in the sense that they are basically involved in all different asset classes. They take a management fee for their services plus a possible incentive fee based on performance. They also invest their own assets in equities and debt instruments (public and private).
- Consumer & Wealth management includes consumer finance and wealth management. The consumer banking business issues loans and credit cards. The wealth management segment offers wealth advisory services such as financial planning, tax advice and more to individuals, family offices, endowments, and foundations. They also provide personal banking services such as issuing loans for various purposes in addition to deposits.
Segment split in 2021 (GS financial statements)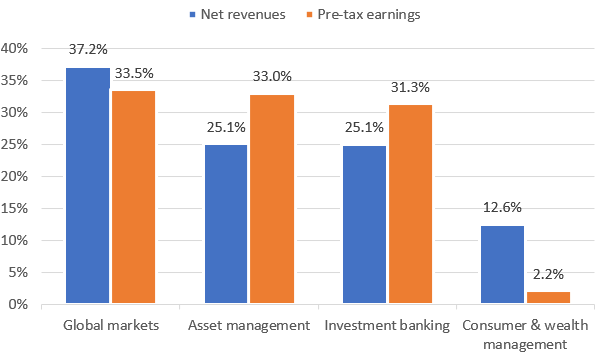
We can see the relative importance of the segments in the graph above. Global markets (trading) is the largest segment by net revenues followed by asset management and investment banking which are roughly equal in size. Consumer & wealth management is the smallest segment. When looking at pre-tax earnings, we see that the relative shares of asset management and investment banking increases i.e. they are more profitable than the other segments. Especially Consumer & wealth management is still in its infancy when considering the economic benefit it brings to shareholders.
Segment net revenues (GS financial statements)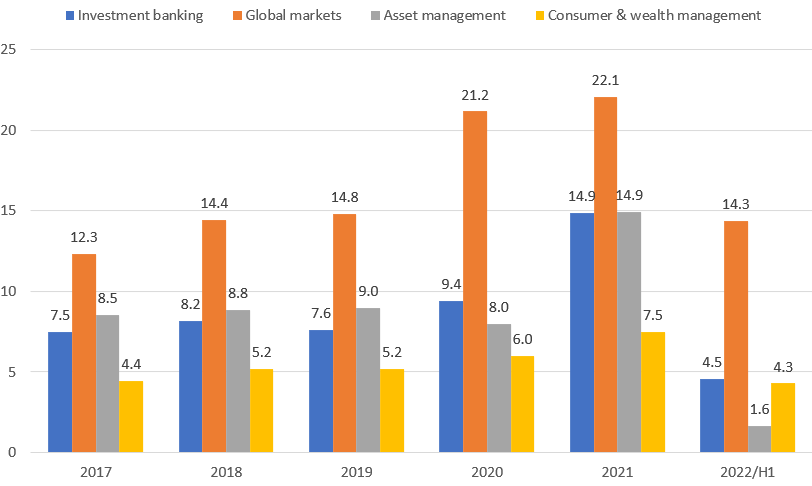
It’s also beneficial to see how the segments have developed over a longer time period. From the graph above we see that investment banking and asset management was actually fairly stable during the 2017-2020 period. There was huge growth in both segments in 2021 with rising markets and good economic activity. In 2022 we see that the party is over for these segments, at least on a topline basis. Turning over to Global markets and Consumer & wealth management, these segments have grown each year and seem to continue that trend in 2022. That’s where the similarities for these segments ends however, as we’ll see in the next graph.
Segment pre-tax earnings (GS financial statements)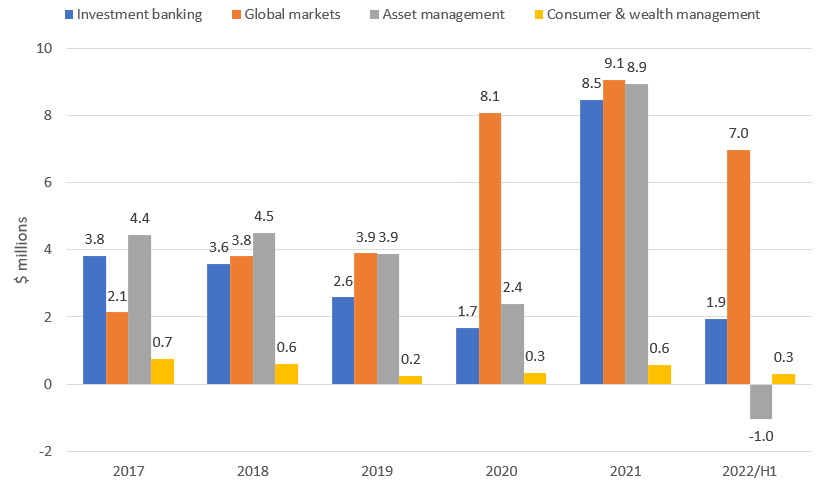
The pre-tax earnings development paints a similar picture on a high level with a few different nuances. Due to the higher profitability of investment banking and asset management, the segments have actually reported the same level of earnings as global markets with the exception of 2020 and 2022. You can also see that it’s the global markets segment that keeps the firm floating while the rest of the segments sink. Consumer & wealth management is still marginally profitable and it will take some time for the segment to produce a meaningful earnings impact for the company as a whole.
This graph is actually a good example of how the scalability of banking works with asset management pre-tax earnings increasing 3.7x and investment banking pre-tax earnings increasing 5.0x in 2021 although topline barely doubled. As we know, operating leverage works both ways which we’ll take a closer look at in the next section.
Q2 Segment Results
The EPS growth was horrible for all segments except Global markets, which benefitted from increased uncertainty and volatility which resulted in more trading by customers. Below are the quarterly high-level figures of the segments.
Investment banking: EPS of $2.12 (-45.7% YoY growth)
Global markets: $6.57 (108.5%)
Asset management: -$1.06 (n/m as EPS went from positive to negative)
Consumer & wealth management: $0.10 (-85.7%)
Adding it all up, we get an EPS (diluted) of $7.73 for the second quarter for Goldman as a whole. The growth versus the previous comparable period was -48.5%. Without Global markets, the results would have been hideous to say the least.
Investment banking
Investment banking topline growth (GS financial statements)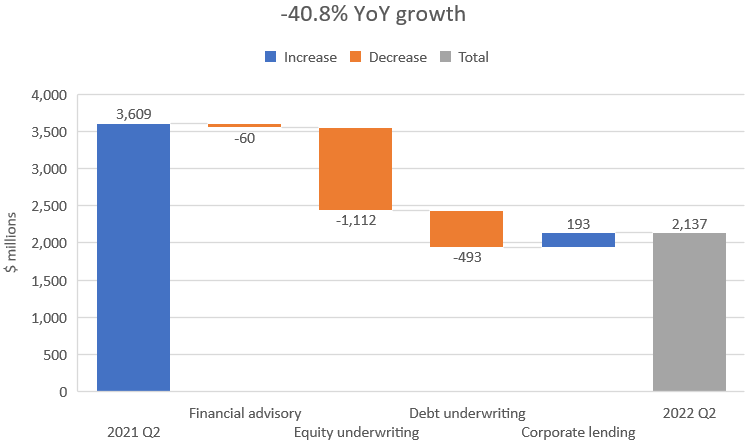
Investment banking had a weak quarter as a whole. Financial advisory (M&A transactions and corporate finance activities) was more or less flat YoY. Equity and debt underwriting were the major underperformers with -89.5% and -51.9% YoY growth. IPO activity has been lackluster so far in 2022 (even beyond Q2) which means equity underwriting volume will probably be fairly weak in Q3 as well. What I hear from the debt markets is that everything is standing fairly still at the moment. Banks have underwritten a lot of debt but they haven’t been able to sell it. Before new underwritings start to materialize the old has to be sold. This obviously implies weakness in the coming quarters for debt underwriting as well. A silver lining: Corporate lending was up 121.4%, mostly due to gains from hedges and increase in revenues from transaction banking.
Global markets
Global markets topline growth (GS financial statements)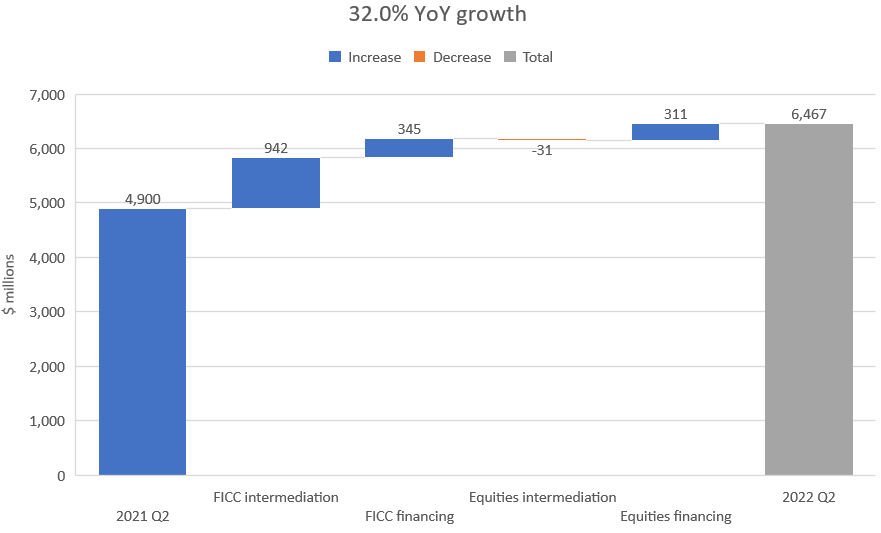
Global markets saved the quarter as it grew 32.0% YoY, mainly driven by increased client activity which in turn was driven by increased geopolitical uncertainty which translates into volatile markets. FICC intermediation generated most topline growth on an absolute basis. Other sub-segments that grew well were FICC and Equities financing. Equities intermediation stayed relatively flat YoY.
Asset management
Asset management topline growth (GS financial statements)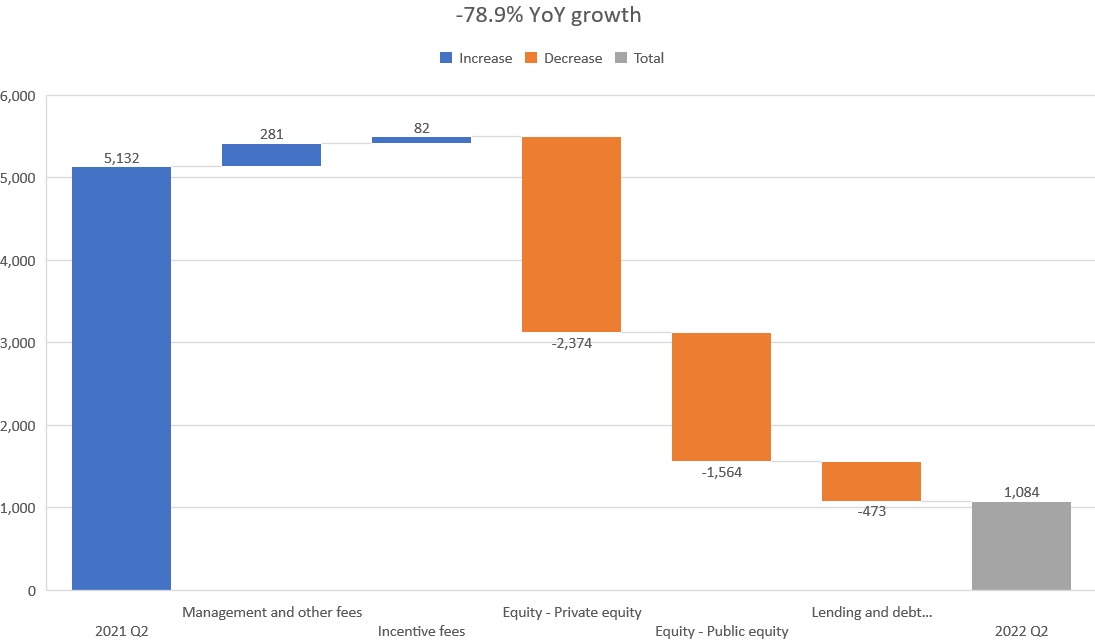
Asset management had the worst quarter of the lot with -78.9% YoY growth. Most of the decline came from the Equity sub-segment (remember that Goldman invests their own assets into public and listed equities) as public equities experienced significant mark-to-market declines (paper losses) while private equities had smaller gains than in the comparable period in 2021. Lending and debt investments also experienced unrealized losses due to mark-to-market declines. Management and other fees were up 38.7% due in part to the acquisition of NNIP and incentive fees.
Consumer & wealth management
Consumer & wealth management topline growth (GS financial statements)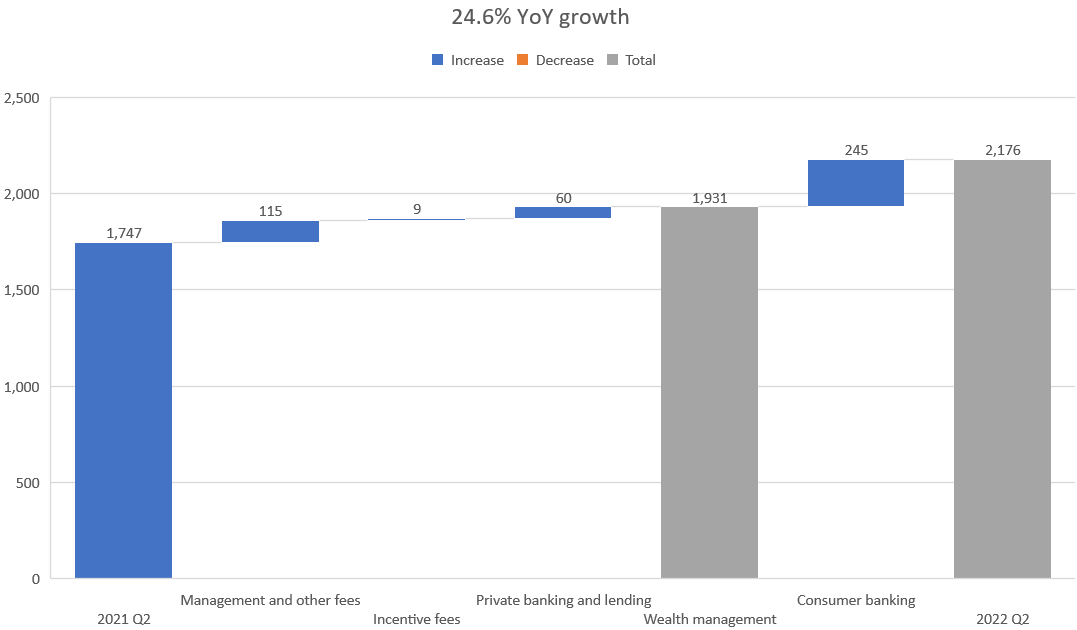
The segment had broad based topline growth as it grew in all sub-segments. Wealth management grew by 13.3% as a whole with management fees making up most of it due to higher placement fees and higher average assets under supervision. Consumer lending showcased significant topline growth as it grew 67.5% due to higher credit card and deposit balances. It could be worthwhile following how the credit card balances develop although bad debts are taken into account in the line item “provisions for credit losses” which was higher than ever before during Q2.
Pre-tax earnings breakdown
Pre-tax earnings growth by segment (GS financial statements)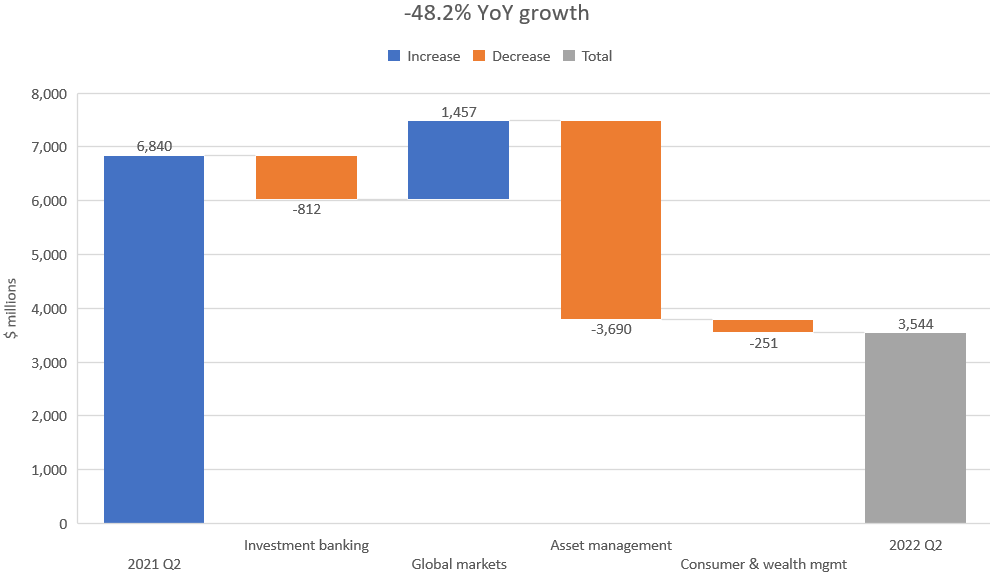
Let’s also take a look at how pre-tax earnings developed for these segments. As you probably can tell already, investment banking and asset management didn’t perform well due to the scalability of banking (which works both ways). As an example, asset management net revenues were down about $4.0 billion while pre-tax earnings were down $3.7 billion as costs didn’t scale back (that’s the fixed part of employee compensation). Investment banking was down 46.1%. Despite the solid growth of Consumer & wealth management, the pre-tax earnings of the segment actually decreased due to (1) increased operating expenses which reflected growth initiatives in consumer banking and (2) provisions for credit losses which probably reflect the increased credit card balances and market volatility. The gem inside Goldman Sachs, Global markets, had pre-tax earnings growth of about $1.5 or 96.3%. The topline growth of the segment was $1.6 which means that basically all of the topline growth fell right through to the government and the shareholders. Great!
Valuation Fair In My Eyes
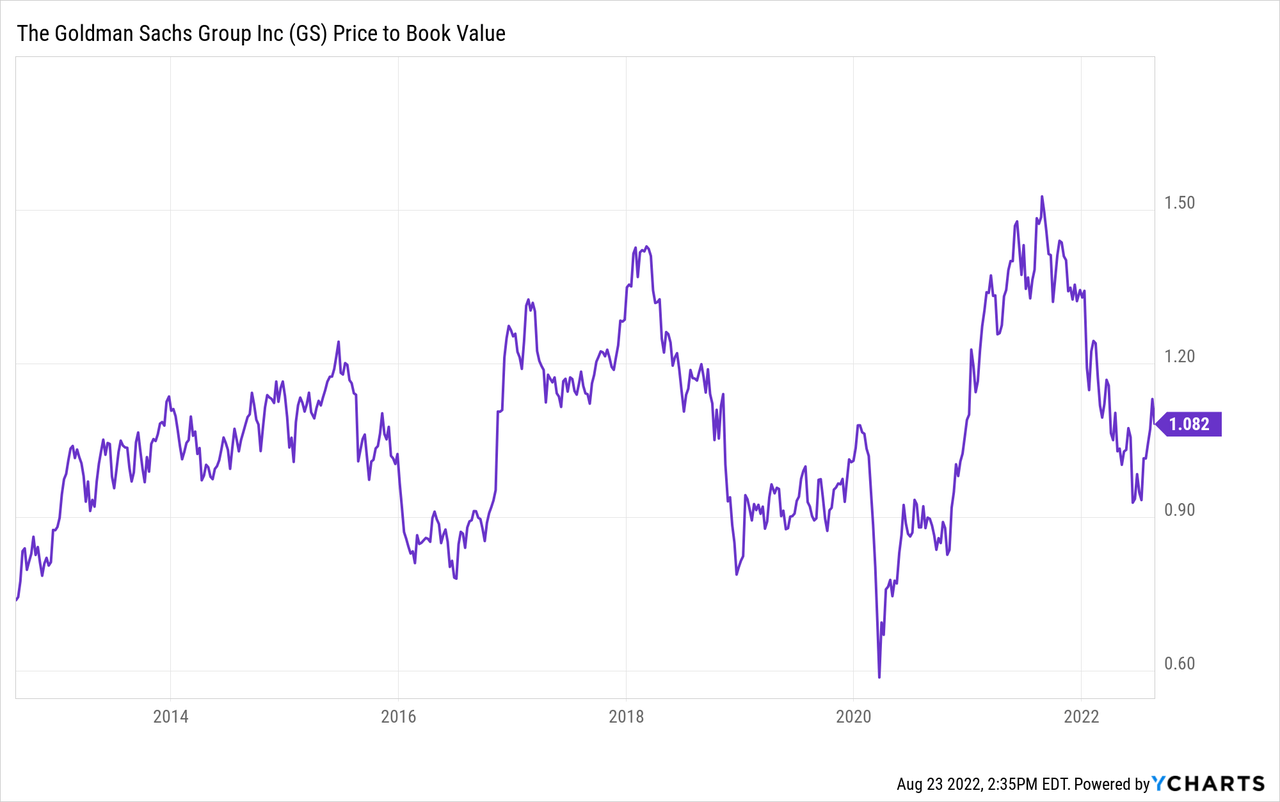
At a current share price of about $342, GS is valued at about $117 billion. For a company that has made $15.7 billion or ~$44 per share on a TTM basis and has a book value of $107 billion or ~$297 per share (BVPS) it initially seems like good value to me. The TTM P/E is 7.8x and P/B 1.15x. However, in this case, it’s probably healthier to estimate what the EPS will be for the full year 2022 and then a sustainable EPS over the long-term as year 2021 is an outlier. The P/B should realistically stay in the historical range as long as business mix and profitability stay the same (assuming the market priced it right historically). During the last 10 years Goldman has been trading at a P/B range of around 0.9x to 1.2x with some brief periods above and below that range. The average seems to be between 1.0x and 1.1x. However, I’m not quite sure which items YCharts uses when it calculates the P/B for Goldman. As I said earlier, my calculated P/B is 1.15x, so slightly above the latest figure in YCharts of 1.08x. So let’s assume 1.10x is the true average here. I’ll come back to P/B later in this section.
So, what can a business like Goldman earn on average over a cycle? That question is fairly hard to answer but let’s say history is a good indicator of the future. Looking first at the EPS development since Goldman went public, we see that the earnings base has grown from about $15 per share during 2012-2016 to about $25 per share during 2018-2020. Year 2021 is obviously an outlier. Although year 2022 has been weak compared to 2021, it shapes up to be a relatively strong year historically thanks to the Global markets segment. It will most likely end up well above $30 EPS. Based on these figures, let’s say Goldman can earn on average about $30 per share over the next 5 years or so i.e. they have made the jump from $25 to $30 on a sustainable basis.
EPS development (GS financial statements)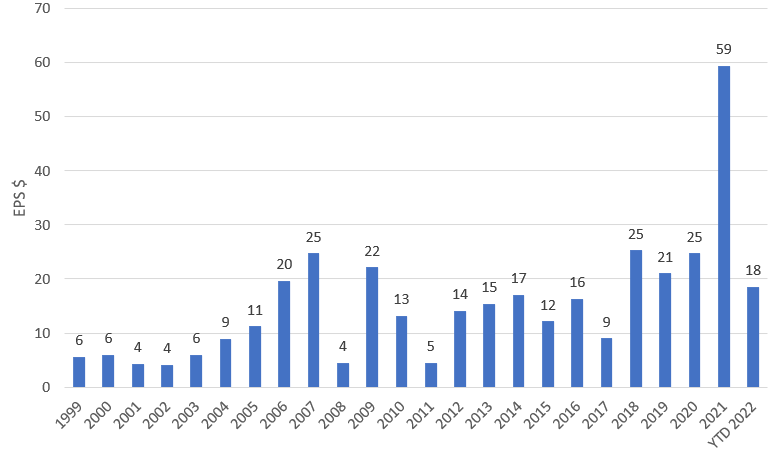
So, what P/E should we ascribe to those earnings? I’ve been looking at banks for some time and my gut tells me they usually trade at 10-12x depending a bit on business mix and general market environment. Let’s do a sanity check and look at what some of the peers are trading at. A few well-known peers that are in the same size bracket as Goldman Sachs are JPMorgan Chase (JPM), Morgan Stanley (MS), and Bank of America (BAC). I’ll throw in P/B for good measure.
| Peer | P/E Non-GAAP (FWD) | P/B (FWD) |
|---|---|---|
| JPMorgan Chase | 10.5x | 1.29x |
| Morgan Stanley | 13.3x | 1.61x |
| Bank of America | 10.8x | 1.12x |
| Median | 10.8x | 1.29x |
Applying the median P/E of 10.8x to the average EPS of $30 we get a share price of $324. However, applying the median book value of 1.29x to the BVPS of $297 we get a share price of $383. It may be more prudent to use the historical P/B here of about 1.10x (which I mentioned above) due to differences in business mix of these peers. This would result in a share price of $327. There’s of course a lot of different approaches you can utilize but based on my assumptions the current price of $342 seems fair (about 5% above my estimated price). There’s no margin of safety however, and as I realize that my assumptions may be way off, I’m staying on the sidelines for now. However, if somebody has a strong conviction that Goldman could earn $35 or more on average over the next five years, then the valuation immediately looks cheap.
Conclusion
To conclude, I wouldn’t recommend buying Goldman Sachs at these prices. If you’re already an owner, I think it’s a good bet to hold on but not expect above average returns. I like Buffett’s analogy that the market throws at you different tickers at different prices, but you don’t have to swing until you’re ready as you can’t strike out. So, I’m going to sit tight and wait for the market to throw that reasonable price at me.
Be the first to comment