

Sundry Photography
Introduction
Johnson & Johnson (NYSE:JNJ) is an American multinational corporation founded in 1886 that develops medical devices, pharmaceuticals, and consumer packaged goods.
While the markets weaken, JNJ has traditionally shown strength in down markets. Today this company had some recent scandals that weakened stock price action over the last few months.
Fundamental strength
It seems that moving into next year; revenue will increase. Net profit should increase as well.
|
YEARLY ESTIMATES |
2022 |
2023 |
2024 |
2025 |
2026 |
|
Revenue |
95,188 |
98,690 |
101,100 |
102,630 |
104,902 |
|
Dividend |
4.37 |
– |
– |
5.19 |
5.46 |
|
Dividend Yield (in %) |
2.68 % |
2.81 % |
2.92 % |
3.19 % |
3.35 % |
|
EPS |
10.09 |
10.55 |
10.94 |
11.24 |
11.50 |
|
P/E Ratio |
16.14 |
15.43 |
14.88 |
14.48 |
14.16 |
|
EBIT |
30,088 |
31,991 |
33,123 |
33,853 |
34,671 |
|
EBITDA |
34,002 |
36,000 |
37,539 |
39,318 |
43,241 |
|
Net Profit |
26,771 |
27,767 |
28,797 |
29,387 |
30,083 |
|
Net Profit Adjusted |
26,771 |
27,767 |
28,797 |
29,387 |
30,083 |
Source: BusinessInsider
Ratios
All the latest two years’ primary fundamental ratios show strength since 2021 as Johnson & Johnson’s Janssen COVID vaccine rollout helped keep the financial ratios more stable for these years during the pandemic.
|
Unnamed: 0 |
2017 |
2018 |
2019 |
2021 |
2022 |
|
Period |
FY |
FY |
FY |
FY |
FY |
|
Current ratio |
2.474 |
1.474 |
1.259 |
1.206 |
1.348 |
|
Quick ratio |
2.039 |
1.082 |
0.939 |
0.912 |
1.037 |
|
Cash ratio |
0.349 |
0.193 |
0.153 |
0.329 |
0.320 |
Mixed News and Catalyst
Sustainability
Sustainability is set at average performance, which makes JNJ substandard for potential long-term investment. As you know, many institutional investors will be compelled to only invest in outperforming companies over the long run.
|
Unnamed: 0 |
Value |
|
Social score |
15.79 |
|
Peer count |
82 |
|
Governance score |
8.55 |
|
Total esg |
25.08 |
|
Highest controversy |
4 |
|
ESG performance |
AVG_PERF |
|
Percentile |
44.38 |
|
Peer group |
Pharmaceuticals |
|
Environment score |
0.74 |
Source: Yahoo Finance
Target Pricing
Recent target pricing has increased after a slight decline ($180 down to $160 approximately) in the summer. I question the slightly higher pricing targets but considering the reduction is not as steep as other stocks, it seems there could be a bottoming process taking hold.
JNJ price vs. target (Custom Platform)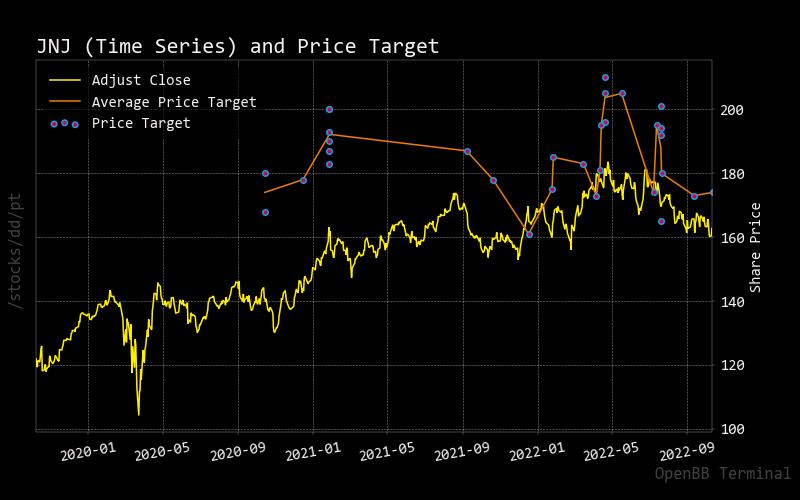
Source: BusinessInsider
Recommendation
It seems that there are more sell recommendations from various market analysts. There is also a smaller amount who have decided to go neutral. Therefore, I leave this JNJ stock on hold.
|
Interval |
RECOMMENDATION |
BUY |
SELL |
NEUTRAL |
|
One month |
STRONG_SELL |
1 |
17 |
8 |
|
One week |
SELL |
2 |
15 |
9 |
|
One day |
SELL |
2 |
14 |
10 |
|
4 hours |
SELL |
6 |
11 |
9 |
|
1 hour |
SELL |
3 |
14 |
9 |
|
15 min |
SELL |
1 |
15 |
10 |
|
5 min |
SELL |
6 |
12 |
8 |
|
1 min |
NEUTRAL |
9 |
7 |
10 |
Source: TradingView
Price vs. Short Volume
Roughly 50% of the total volume traded is short volume. This means there is more neutrality on JNJ, which helps support holding this stock.
JNJ short volume vs. total volume (custom platform)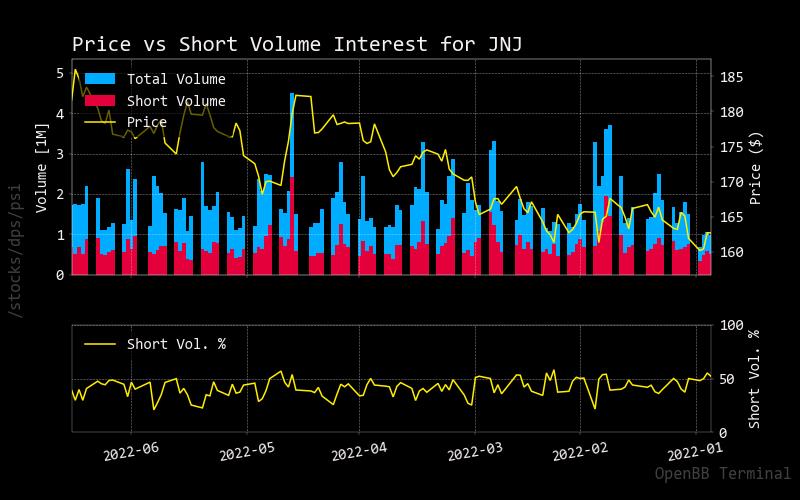
Source: StockGrid
Insider Activity
There are no purchases of this stock outside of sales.
It should be highlighted CEO Mongon Thibaut sold off many shares in the summer.
|
2022-06-09 |
40,000.00 |
111,310.87 |
72.54 |
Buy |
No |
Mongon Thibaut |
|
2022-06-09 |
100.00 |
111,210.87 |
173.0 |
Sell |
No |
Mongon Thibaut |
|
2022-06-09 |
174.00 |
111,036.87 |
173.0 |
Sell |
No |
Mongon Thibaut |
|
2022-06-09 |
6,600.00 |
104,436.87 |
173.0 |
Sell |
No |
Mongon Thibaut |
|
2022-06-09 |
33,126.00 |
71,310.87 |
173.0 |
Sell |
No |
Mongon Thibaut |
Source: BusinessInsider
Technical Analysis
Fibonacci
Momentum has slowed down after a choppy uptrend that started in May 2020. Fully recovering from this decline might not take long, but when an insider CEO sells, it makes you question what he knows.
JNJ Fibonacci (Custom Platform)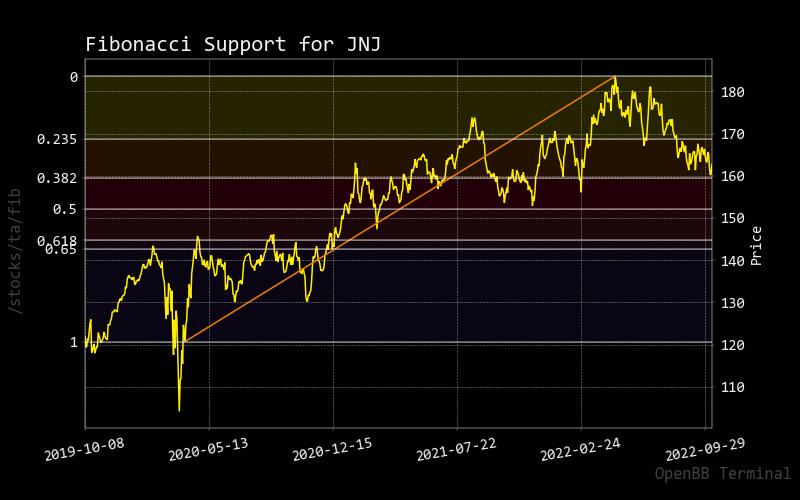
Bollinger Bands
The upper and lower bands are tight around the actual JNJ share price. Tight bands mean there is low volatility compared to other stocks.
JNJ Bollinger Band (Custom Platform)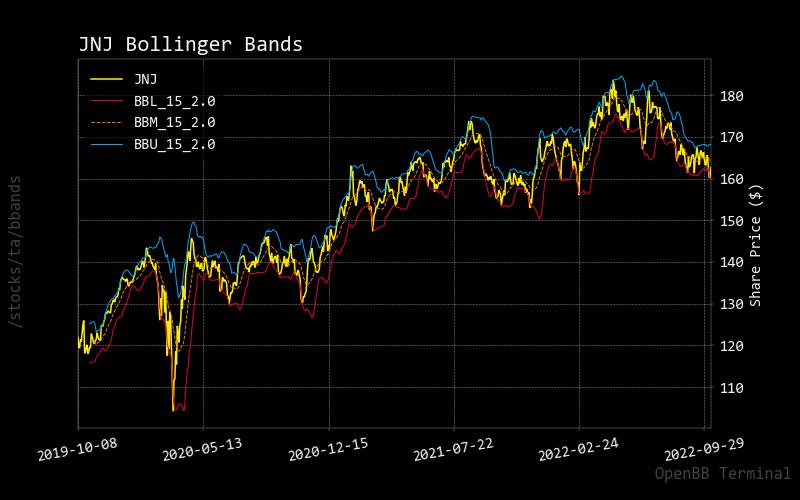
MACD
Note the lower panel of the yellow MACD line of recent late September activity. It reached the zero line and started to decline again. This suggests that JNJ will continue to drop with little momentum in the price. This could be due to the correlation of the negative performance of more significant US market indices.
JNJ MACD (Custom Platform)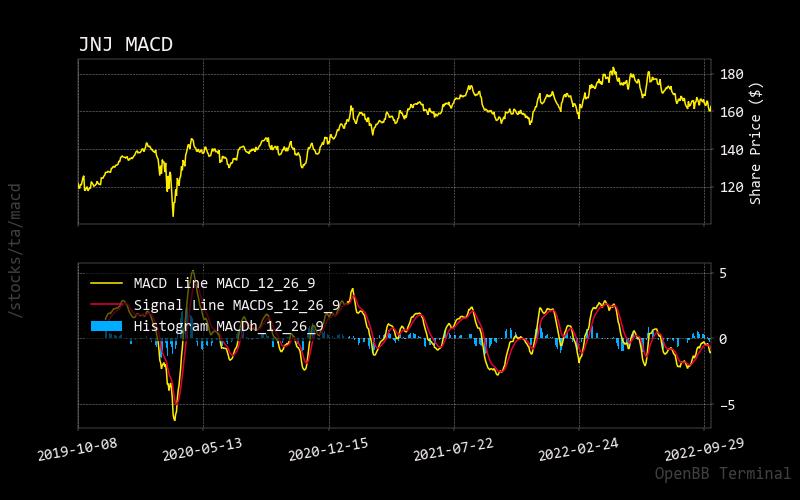
Questionable business practices at risk
Two pending issues are worrying about holding JNJ with:
Talcum powder lawsuit
J&J tries to block baby powder lawsuits by 40,000 patients. A court has a question.
Antitrust business practices
J&J, Alcon Pay $75 Million to End Contact Lens Antitrust Case.
Talc Scandal Clouds Investment Attractiveness Of Johnson & Johnson’s Pharma Business.
Could this negative news drag down JNJ over the long run? I think the stock price would have seen a steeper drop if this news event had not occurred.
Will the $5 billion buyback stabilize the price of JNJ? This was announced a few weeks ago.
J&J plans $5B stock buyback program; affirms FY22 outlook.
Conclusion
There are mixed signals within the fundamental analysis, including strengthening revenue and profitability. There is a high risk of acquiring Johnson & Johnson stock with a pending lawsuit and questionable antitrust business activity. Technical research shows that JNJ was not hit negatively compared to other significant stocks. A buyback program may help minimize declines. As with these mixed views, I recommend holding this stock until important positive news and stock reports become positive.
Be the first to comment