


phototechno
Written by Nick Ackerman, co-produced by Stanford Chemist. This article was originally published to members of the CEF/ETF Income Laboratory on October 24th, 2022.
Nuveen Core Equity Alpha Fund (NYSE:JCE) continues to be an interesting fund. It recently paid out a large special after raising its distribution earlier this year, and that certainly seems like a good sign. However, the way that CEFs work doesn’t necessarily mean too much, as those gains were required to be paid out. The special ended up being a total of $0.7503 between short and long-term capital gains.
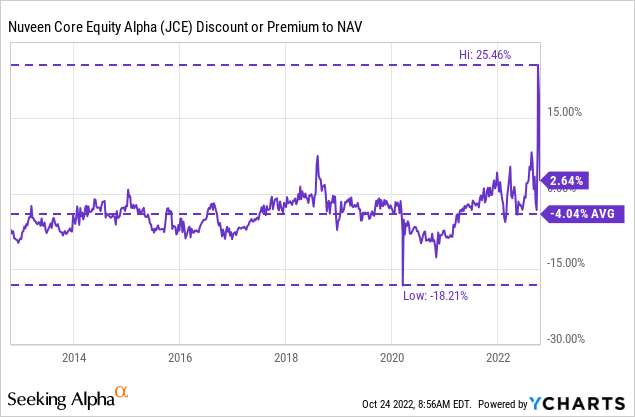
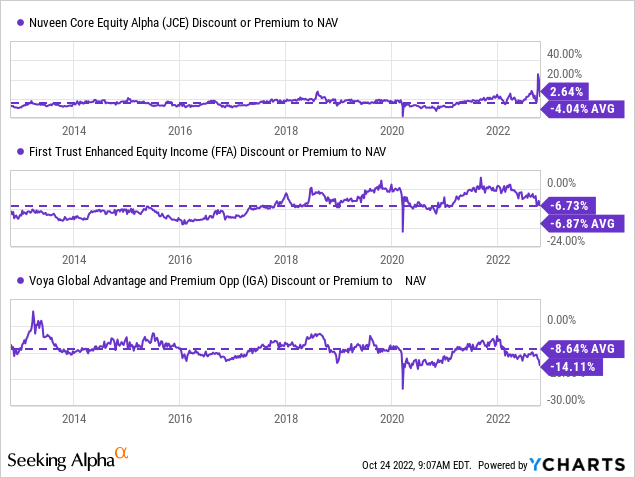
Additionally, the fund has been on quite an unusual run. It recently touched a high premium of over 20% before coming back down to a still slight premium. Though it is still trading above its longer-term average.
Ycharts
Since the fund went ex-div on October 14th for that special, it appears as if that was exactly what investors were chasing. The fund was at a relatively attractive discount only a couple of weeks before.
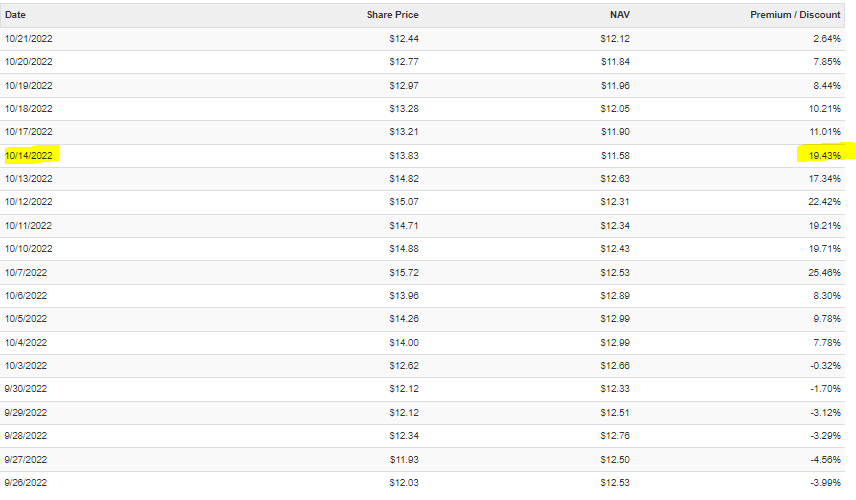
JCE Price/NAV Table (CEFConnect (highlights from author))
While investors might have “missed” this special, the price adjustment means it is cheaper now to buy. As with any dividend-paying company or fund, the price is adjusted for the dividend/distribution. In the case of JCE, investors are now getting an overall much better price than heading into the ex-div day. As we can see in the chart above, it was pushed to over $15 and has now fallen to $12.44 with the last close. All that being said, I think a couple of alternative funds are presenting a better valuation and potential opportunity at this time.
The Basics
- 1-Year Z-score: 0.37
- Premium: 2.64%
- Distribution Yield: 12.71%
- Expense Ratio: 0.99%
- Leverage: N/A
- Managed Assets: $198 million
- Structure: Perpetual
JCE’s investment objective is “to provide an attractive level of total return, primarily through long-term capital appreciation and secondarily through income and gains.”
To achieve this, the fund will invest “in a portfolio of actively managed large-capitalization common stocks, using a proprietary quantitative process designed to provide the potential for long-term outperformance.” They will additionally; “sell call options with a notional value of up to 50% of the Fund’s equity portfolio in seeking to enhance risk-adjusted performance relative to an all-equity portfolio.”
Potential Alternatives
The First Trust Enhanced Equity Income Fund (FFA) and Voya Global Advantage and Premium Opportunity Fund (IGA) are the two funds that operate somewhat similarly with a call-writing strategy with a more attractive valuation.
IGA is quite a bit different overall. They have a global focus as well as a value tilt. With that value-tilt really helping out the fund this year, we can see on a YTD basis that IGA has performed much better than these other two. On the other hand, JCE and IGA both write calls on indexes rather than individual positions. FFA utilizes a mixture of overwriting on an index and underlying positions.
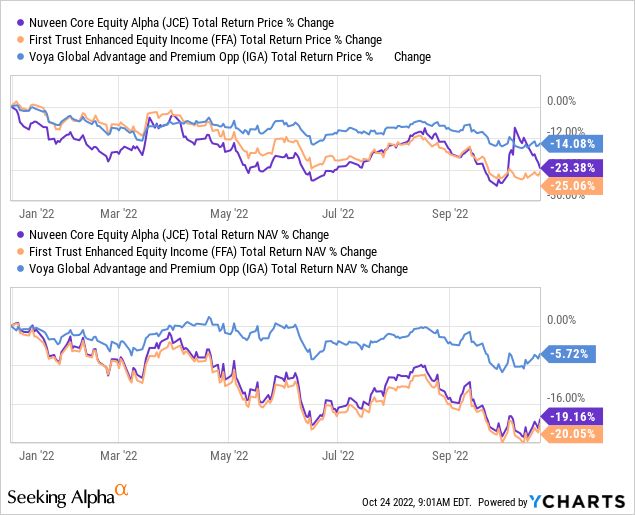
Ycharts
Global investments and value-oriented portfolios have been weaker over the last decade. So naturally, we see that the results have been flipped over the last decade. IGA had been the much weaker performer. In this case, we can see that JCE has even been able to inch out greater performance than FFA.
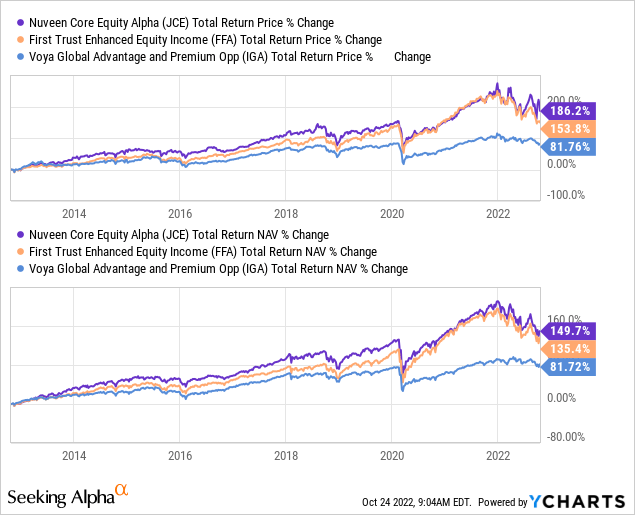
Ycharts
At the same time, the valuation would still favor FFA, which could wipe away any outperformance in the future. FFA could start trading at a premium similar to JCE, or JCE’s valuation could come down. I believe that JCE’s valuation eventually coming down could be more likely, simply due to the historical trading range of the discounts. That being said, FFA is trading right near its average. IGA is well below its average discount despite recently being a much better-performing fund.
Ycharts
Again, IGA isn’t necessarily a great alternative to entirely match the strategy and investments. Yet, I thought it was still a somewhat attractive alternative that could be presented as an option. If anything, the different results we’ve seen in different periods could make an argument for why diversification is king.
JCE’s Distribution Sustainability Caution
When adjusting for the latest special distribution, JCE’s distribution yield comes to 12.71% if it continues the $0.3952 quarterly it had been paying. Due to the premium on the fund, the fund’s NAV distribution rate comes in higher at 13%. This was raised earlier this year from the quarterly $0.3040 level.
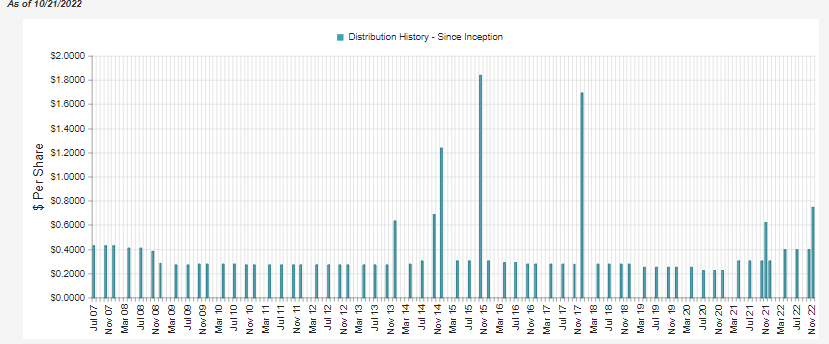
JCE Distribution History (CEFConnect)
13% is quite a high level, and I would consider it perhaps unsustainable. This was impacted after unloading quite a meaningful amount of assets with this latest special. That leaves fewer assets to earn income and further capital gains going forward. That’s why specials are good and bad. They can be great to receive that injection of cash in your account but too large, and they could impact the earnings potential of the fund.
As mentioned, the special was $0.7503, and the fund last had 16,061,944 shares outstanding. That works out to a hefty $12.051 million being paid out of the fund that had only around $200 million in assets overall. That was the fund’s total managed assets at the end of September. Now, that will have been reduced by ~6%.
The reason for paying out such gains in the first place seemed to be tied to last year’s significant realized gains.
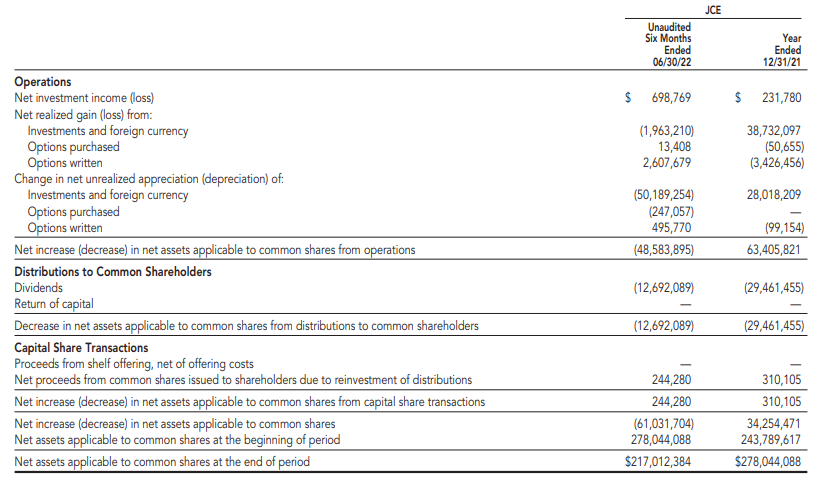
JCE Semi-Annual Report (Nuveen)
At nearly $39 million in realized gains and paying out less than $30 million, it would appear that they were on the hook to pay out more due to their regulated investment company or RIC status.
A roughly $9 million difference might not seem like much, but again due to the small size of the fund, it actually works out to almost $0.58 per share. The special was above that amount, which would indicate that JCE managers could have taken some sizeable short-term gains.
That isn’t too surprising, given that the options writing strategy should prove to be quite profitable. As we can see above, it provided around $2.608 million in realized gains and another $500k in unrealized gains. Those realized portions were enough to offset the realized losses in the underlying portfolio.
Regulated investment companies are required to pay out 98% of ordinary income and 98.2% of capital gains. Either that or they face an excise tax of 4% on what they don’t payout. That would mean both shareholders and the fund just lose out by paying taxes.
All that being said, my concern with an equity fund maintaining its distribution in a bear market should be quite clear. It is particularly harder now with a reduced amount of assets. However, the option writing portion of the portfolio can still leave it in relatively better shape than non-option writing funds. It’s still a high hurdle at around 13% to generate, though.
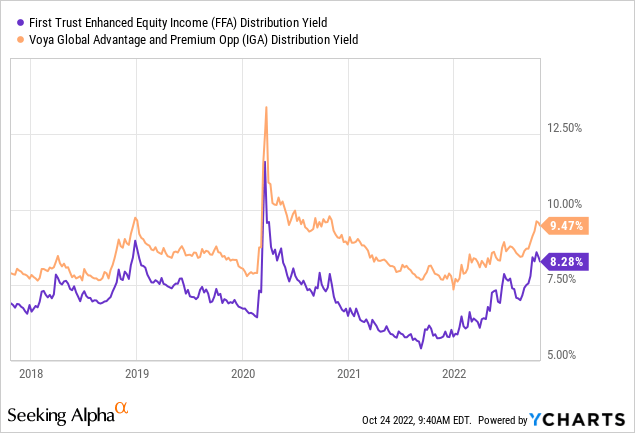
Compared to FFA and IGA, JCE is clearly the higher yielder, which is sometimes what investors tend to weigh more in their decision-making process. However, if you consider sustainability in your process, FFA and IGA seem to be on better footing. To be sure, they are also elevated, but with capital gains potentially harder to come by in a bear market, a lower but sustainable yield could be considered.
(I didn’t include JCE in the chart below as the special is producing some strange results in the charts.)
Ycharts
A Quick Look At The Portfolios
JCE
For the most part, JCE is your relatively standard S&P 500-esque type portfolio.
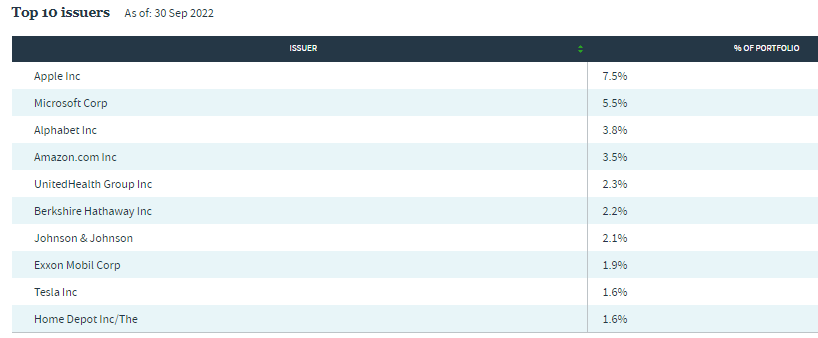
JCE Top Ten (Nuveen)
With these types of top holdings, it isn’t surprising to see technology-related industries as the largest weightings. However, they have some oil and gas exposure too.
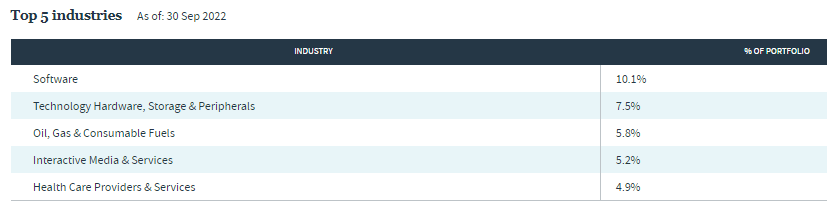
JCE Top Five Industry Exposure (Nuveen)
FFA
FFA’s portfolio is quite similar, one of the main reasons I found it a viable alternative. Given the discount and the similar strategy, it seemed like a clearly better buy.
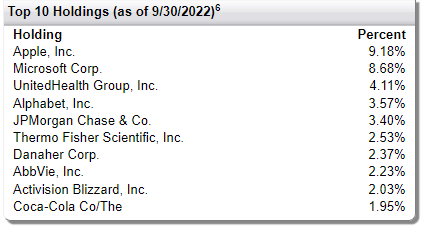
FFA Top Ten (First Trust)
With these types of weightings, tech is the clear dominant weighting at 27.40%.
IGA
As suggested above, IGA’s portfolio is quite a different approach, which helped the fund out this year, relatively speaking. The value-oriented portfolio has been a better place to be than tech stocks in the growth category.
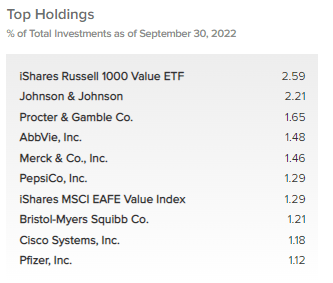
IGA Top Ten (Voya)
With exposure such as this, financials actually come in at the largest weighting of 19.83%; healthcare is at 16.65%, and industrials also come in at 11.34%. Tech only makes up a 6.16% fund allocation with the latest update.
Conclusion
I continue to believe that JCE is an interesting investment. It’s certainly a better value than just a couple of weeks ago. At a more modest premium, it could still be a hold. However, I still consider some other funds to be of better value now. With the special paid-out from JCE that seemed to excite investors, I’m hoping investors took the opportunity to sell out at a 20%+ premium.
Be the first to comment