

Japanese Yen Talking Points:
- The Japanese Yen is showing weakness again as US Yields have started to jump following a series of hawkish comments from FOMC officials.
- Previously, yields were diving on recessionary concerns and that countered the carry trade that had helped to push Yen-pairs like USD/JPY to fresh multi-year highs. At this point, the Yen seems to be highly-related to yield plays in the US, which can allow for strategy across Yen-crosses such as EUR/JPY, GBP/JPY and/or AUD/JPY.
- The analysis contained in article relies on price action and chart formations. To learn more about price action or chart patterns, check out our DailyFX Education section.
We’re in a peculiar spot on the macro calendar as we’ve recently heard from the ECB and last week heard from the Fed. And there’s almost two full months to the next FOMC rate decision which is scheduled for September 20-21. That’s a quarterly rate decision so we’ll be provided with updated forecasts and projections. There’s the Jackson Hole Economic Symposium between here and there and likely we’ll hear some messages from global Central Banks on the topic of inflation so perhaps that adds some information. But, for any rate hikes, unless the Fed does an emergency unscheduled meeting, we’re waiting until September 21st for the announcement.
This is also around the time that we start to hear from various Fed members after the most recently-completed rate decision. And so far this week we’ve seen some pretty pointed comments cross the wires, mostly alluding to the possibility of more rate hikes out of the Fed as opposed to the hope that the bank may be nearing a policy pivot sometime soon. Neel Kashkari, a noted dove (but not a voter this year) reiterated the Fed’s commitment to slowing inflation to 2%. Mary Daly, President of the San Francisco Fed, said yesterday that the Fed was ‘nowhere near done’ with rate hikes as inflation remained elevated. Another noted dove, Charlie Evans, remarked that he’d be open to a 75 bp hike in September (markets are currently a coin flip for 50 or 75 in September). And then last night and again this morning, James Bullard was doing as Bullard does, taking an extremely-hawkish opinion to markets that seemed out of band with the rest of the board.
The net result has been a massive move in yields. What was plummeting on Monday is surging today and a big reason for that is all of this Fed commentary that markets are sorting through. At this point, equities haven’t seemed to show much response to the yield theme but the Yen certainly has.
As looked at previously, rates are a big driver on the Yen and one reason for that is the negative rate policy that remains at the Bank of Japan. And while inflation was scaling-higher around-the-world, it’s, so far, remained fairly subdued in Japan with but a couple of prints above the 2% marker. The BoJ seems undeterred, saying that inflation is likely coming from foreign forces regarding energy, which makes sense as that’s an issue in Europe, the United States and, well pretty much everywhere in the western world at the moment.
That allowed for divergence. With US rates shooting-higher and Japanese rates holding flat, the rollover or swap amount for holding long USD/JPY positions also increases accordingly. And this isn’t isolated as other investors can become intrigued by this rising yield, which can then lead to increased demand. That can then lead to higher prices. In the ‘right’ environment, the carry trade can be attractive for this very reason – it’s a symbiotic relationship of beauty as prices are moving higher to reflect that increased demand brought upon by the higher rates, which can continue to increase demand and so on.
Unfortunately – this doesn’t always last. As the market is getting more and more long, the slightest hint of change can cause reversal. Because while that carry is attractive, it matters little if the principal portion of the investment is losing faster than the carry is gaining. This is what leads to the ‘up the stairs, down the elevator’ logic that will often show around built-in trends.
We started to see that in the Yen last week as yields were breaking down after the Fed. But now that all of this Fed-speak is taking a hawkish turn and with yields reacting – the Yen is showing weakness again. This brings up an interesting point for macro strategy, depending on the currency being paired with the Japanese Yen.
USD/JPY
Given that it’s US rates that’s doing much of the pushing, logically speaking, if one is looking for a return of Yen-weakness on the basis of rising yields, the US Dollar would be an attractive venue to look for continuation of that theme; from a fundamental basis, at least.
Technically speaking, USD/JPY isn’t quite there yet. There has been a vigorous reversal after bottoming on Tuesday morning and this is showing as a ‘V-shaped reversal,’ which could carry some continuation potential. I highlighted the 131.25 level yesterday as a key point of support for bullish or bounce approaches.
But, the big level here at this point is the 135 psychological level, which had previously helped to set support. I’m tracking resistance on that setup around 134.60, a breakout of which exposes a re-test of the 135.00 handle. That’s around the point that bulls can gauge motivation – if a pullback from 135.00 can hold support at 134.60 or higher, the door can remain open to bullish scenarios.
USD/JPY Four-Hour Price Chart
Chart prepared by James Stanley; USD/JPY on Tradingview
EUR/JPY
If we are seeing recessionary concerns get priced-in to the equation, EUR/JPY could be an interesting spot.
Yen-strength could continue to show as carry continues to unwind in USD/JPY and elsewhere – while the Euro hasn’t exactly been a bastion of strength lately. EUR/USD is currently pinned to the parity level so Euro shorts there are challenged by that. But, against the Yen – if there is going to be continuation in falling rates on the back of recessionary fears, EUR/JPY could remain as attractive.
And as a case in point, there’s a similar v-shaped reversal that’s shown in EUR/JPY but sellers have been a bit more aggressive here, showing some resistance off of prior support, around 136.34. There’s another zone of possible resistance sitting overhead, around the 137 handle.
EUR/JPY Four-Hour Chart
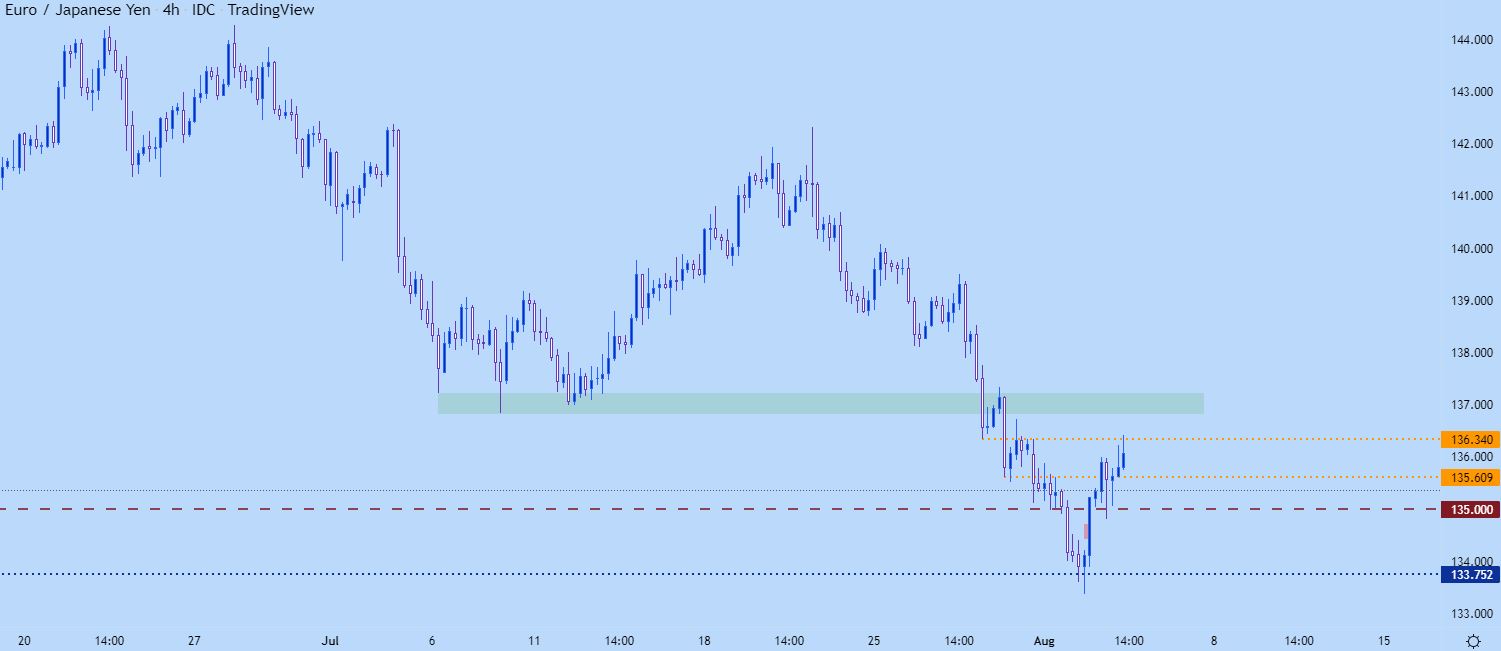
Chart prepared by James Stanley; EUR/JPY on Tradingview
EUR/JPY Longer-Term
The reversal yesterday was outsized and so far that’s continued. I wanted to highlight this chart as I think that it’s an important component to the above.
Yesterday’s bar closed as a hammer and today has so far seen continuation. There’s also a possible morning star formation in there, based on how today closes, putting even more emphasis on seller response today.
The extended wick on yesterday’s candle highlights reversal and that’s what keeps the door open for a push up to 137. Yesterday’s bar isn’t quite a pin bar, as it does not ‘stick out’ from prior price action. But it does highlight a strong reversal nonetheless. If price fails to push above 137 – I will read that as a very bearish item as sellers remained vigilant even in an environment (rising rates) ill-fit for the technical theme.
EUR/JPY Daily Chart
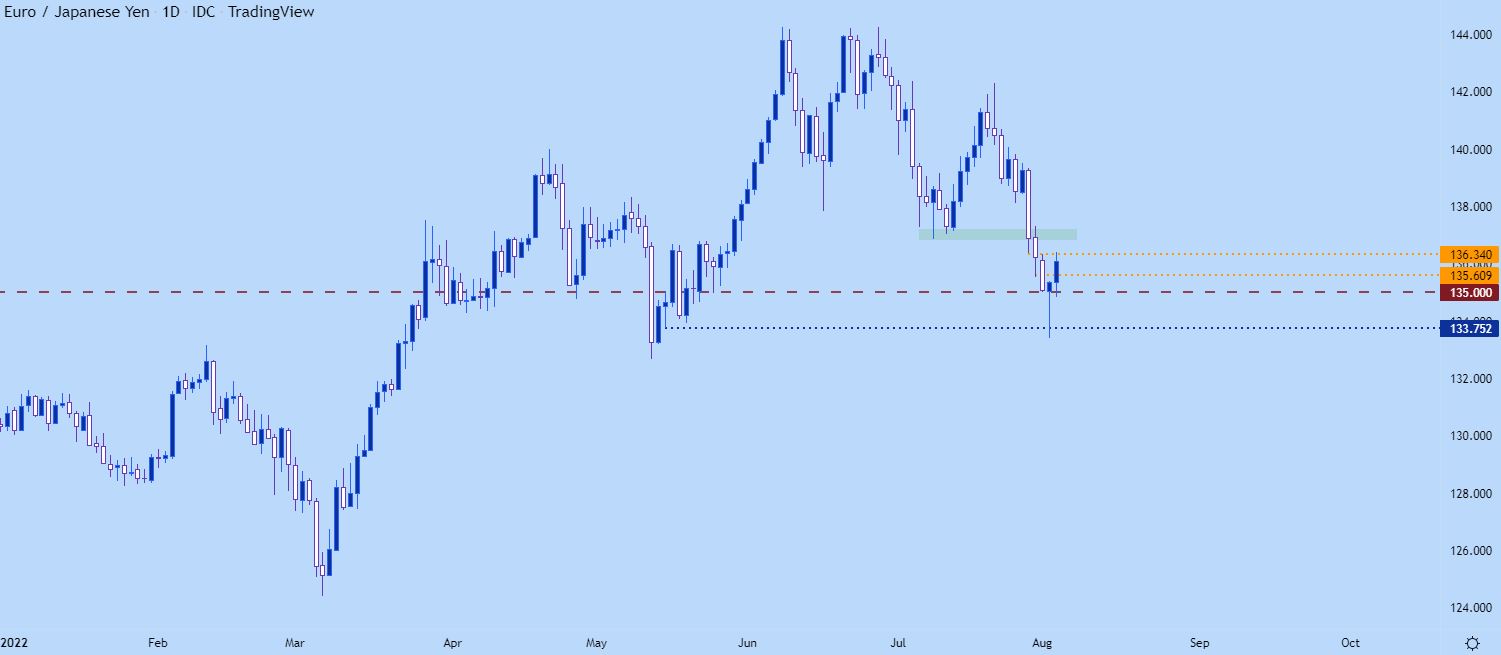
Chart prepared by James Stanley; EUR/JPY on Tradingview
GBP/JPY
There’s a rate decision from the Bank of England tomorrow. Given the turmoil around rates at the moment I’m not really sure how to price-in any expectations there. Price action of late has been somewhat clear, however, as yesterday’s bounce showed-up right at the 50% mark of the 2015-2016 major move, and prices has been aggressively bid since. That’s helped price to recover back-above a key trendline.
That Fibonacci level can be meshed with the 160 psychological level to produce an element of confluence around support. A recent double top break had a neckline at 163.01 and that’s now showing up as short-term resistance.
GBP/JPY Daily Chart
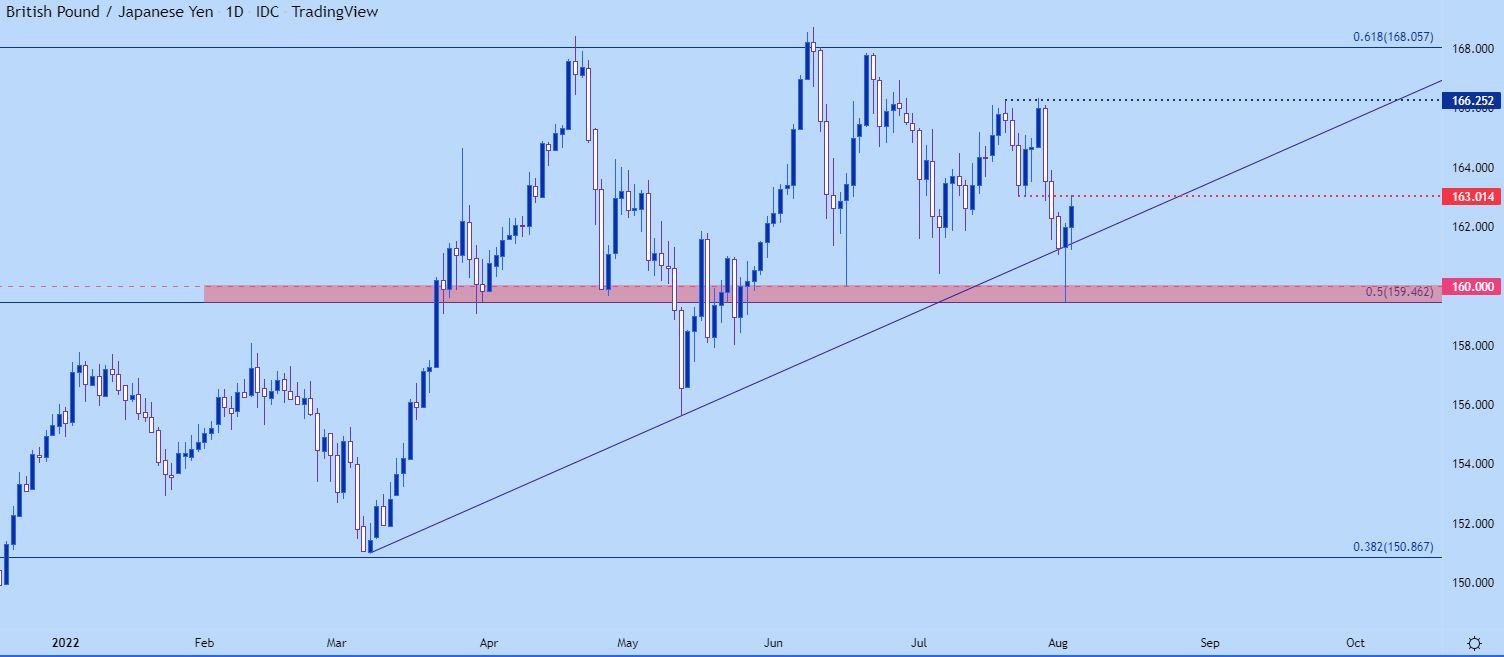
Chart prepared by James Stanley; GBP/JPY on Tradingview
AUD/JPY
I’m going to keep this one fairly simple with just a weekly chart. The notable item here in my opinion is the continued resistance at the 95.00 psychological level. This has been happening for more than three months already and still bulls haven’t been able to break-through. And, of recent, there’s been lower-highs to go along with that continued inability to sustain a lasting break.
It’s not all grim however as there’s also been a rising trendline of support but, given the bigger picture, it’s the lower-highs that are most interesting in my opinion.
At this point we have a symmetrical triangle and when matched up with the prior bullish trend, that makes for a bull pennant formation. Those are normally tracked for trend continuation so there may be bullish scope. But, I’m cautious around that given the lower-highs at 95.00 and I’m keeping the door open for bearish breaks. That’s invalidated on a breach of last week’s high at 95.76.
AUD/JPY Weekly Chart
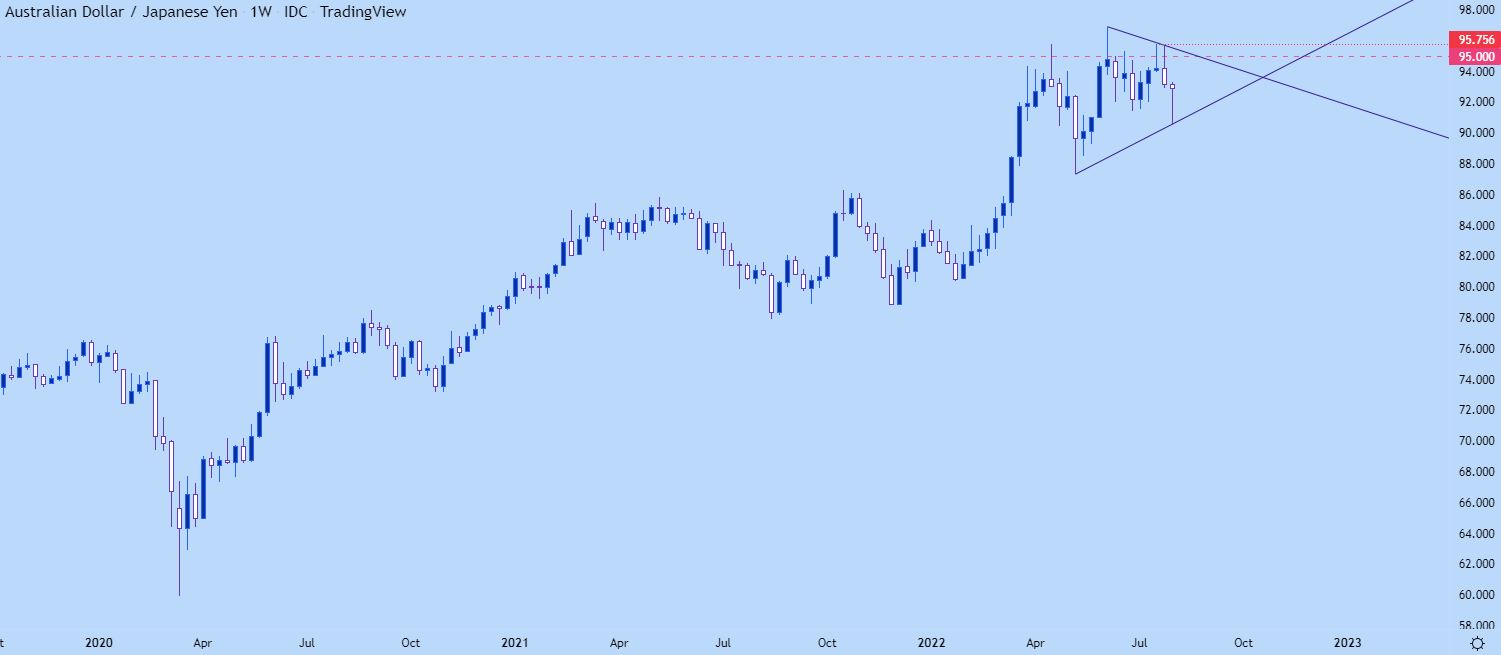
Chart prepared by James Stanley; AUD/JPY on Tradingview
— Written by James Stanley, Senior Strategist for DailyFX.com
Contact and follow James on Twitter: @JStanleyFX
Be the first to comment