

baona
Introduction
Across the two trading sessions leading up to the market close on 11 November 2022, Janus Henderson Group (NYSE:JHG) shares rallied a mighty 18.5%. Over the same period, the S&P500 climbed by 6.5%. After such an extraordinary two-day bounce, a review of my previous BUY call on the stock is warranted. In this note, I discuss some of the issues raised in JHG’s recently released 3Q22 materials and provide an updated assessment of the stock’s fundamental valuation appeal.
Net Flows – AUM Headwinds
Net outflows for 3Q22 were -$5.8bn; not good news, but a big improvement on the 2Q22 net outflow of -$7.8bn. However, digging a little deeper, the 2Q22 net outflow included -$1.3bn relating to the liquidation of a UK property fund – so a better view of the net flow performance is -$5.8bn for 3Q22 against (adjusted) -$6.5bn for 2Q22. As per Chart 1, a slowing in sales was the main area of net flow weakness relative to recent history. JHG attribute the sales weakness to clients and advisers holding back from decision-making due to high levels of market volatility – this seems like a reasonable conclusion in my view.
Chart 1 (data excludes Intech, the sale of which completed 31 March 2022):
Source: JHG 3Q22 Presentation, slide 4.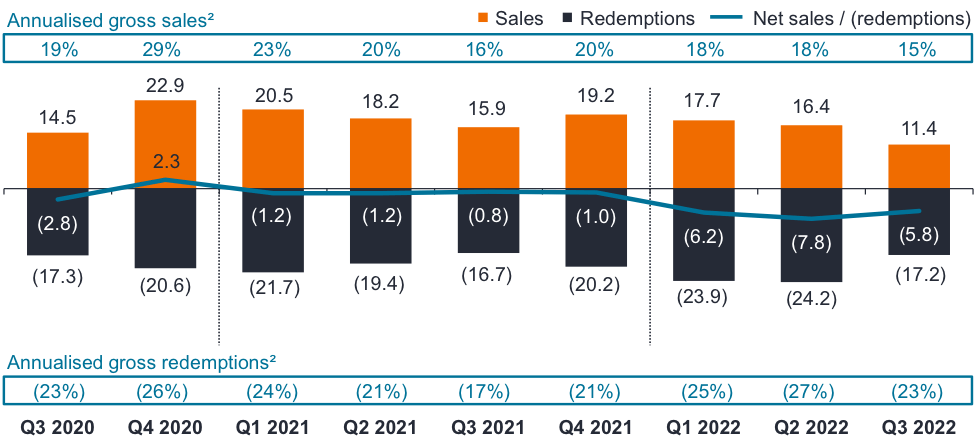
Chart 2 plots JHG’s net flow performance by quarter, both including and excluding Intech, expressed as a percentage of each quarter’s opening AUM (with corresponding AUM including and excluding Intech AUM). Note that these percentages are quarterly rates, not annualized rates. The chart highlights that the net flow performance so far during FY22 has been consistently negative. I struggle to see how JHG’s earnings multiple will re-rate materially upwards until the group enters a phase of consistent positive net flows; this point also holds for other listed fund managers dealing with net outflows – Franklin Resources (BEN) being a prime example (see my previous research here).
Chart 2:
Source: Created by author using data from JHG financial reports.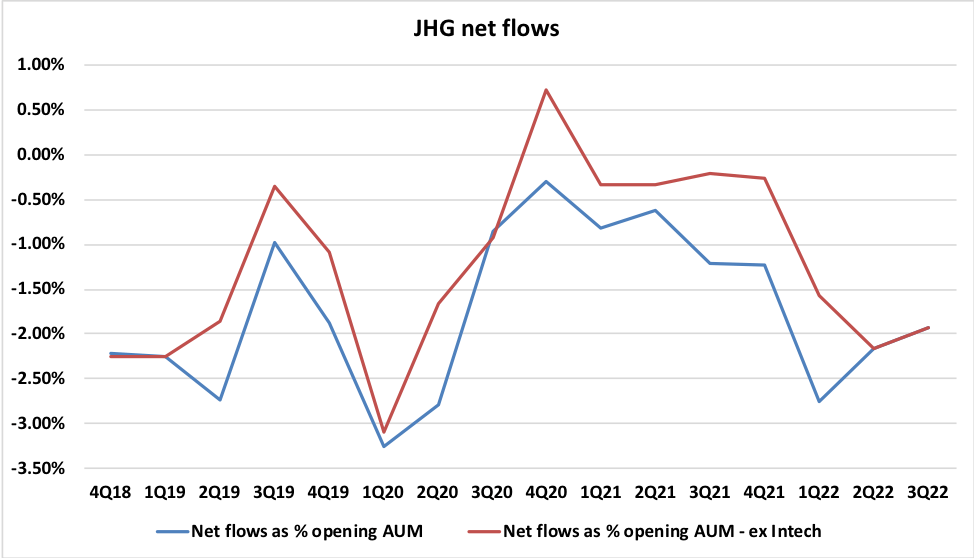
JHG is facing significant headwinds on net flows for the final quarter of FY22. In the 1Q22 management speech, CFO Roger Thomson reported that JHG had been advised of the loss of a large fixed interest mandate ($7.3bn AUM as at 1Q22) relating to a European insurance company client; redemptions associated with the mandate loss were expected to be staggered over the final three quarters of FY22. $0.9bn of this lost mandate was redeemed in 3Q22 and the final ~$2.6bn tranche is anticipated to exit in 4Q22. At 3Q22, JHG’s CFO advised that a large client was moving management of its equity portfolio to an in-house team; as a result, JHG will lose $4bn of AUM in 4Q22. This departing $4bn equity mandate is on a very low base management fee of 12.5bp (calculation based on JHG comments regarding $5m of associated annual management fees), so the immediate income hit will be modest – but the loss of potential future performance fees is an additional negative.
Given that investor and sell-side analyst sentiment towards fund managers is heavily influenced by net flow performance, the two large mandate losses described above will create an additional drag on market enthusiasm towards JHG until mid-2023.
Cost Cutting & ‘Fuel for Growth’
Cost discipline has long been a key feature of JHG’s operations. In bear markets, with income under pressure, it is important that a fund manager has the appetite to make tough decisions on expenses. JHG has identified $40m to $45m of annual cost efficiencies that are to be funded by implementation charges of $30m to $35m. Taking the mid-point of the cost efficiency range, the cost-out is equal to ~3.4% of the FY21 expense base. Around half of the cost savings will relate to headcount reduction. Investors hoping to see these cost savings coming through as an earnings benefit will be disappointed; rather than banking the savings, JHG’s intention is to offset the savings with investments in the business. Given the backdrop of tough operating conditions and downside economic risks, I would rather see JHG hold off on discretionary business investment efforts and deliver cost reductions to the bottom line. The fact that JHG has a recently appointed CEO who wants to put his mark on the business probably explains the decision to use cost savings as ‘Fuel for Growth’.
Acquisitions Ahead
In the 3Q22 management speech, CEO Ali Dibadj fleshed out his strategic plan for JHG, which in part will be funded by the announced cost-out program. The strategy has 3 components – ‘Protect & Grow’, ‘Amplify’, and ‘Diversify’ – as summarized in the chart below:
Source: JHG 3Q22 Presentation, slide 18.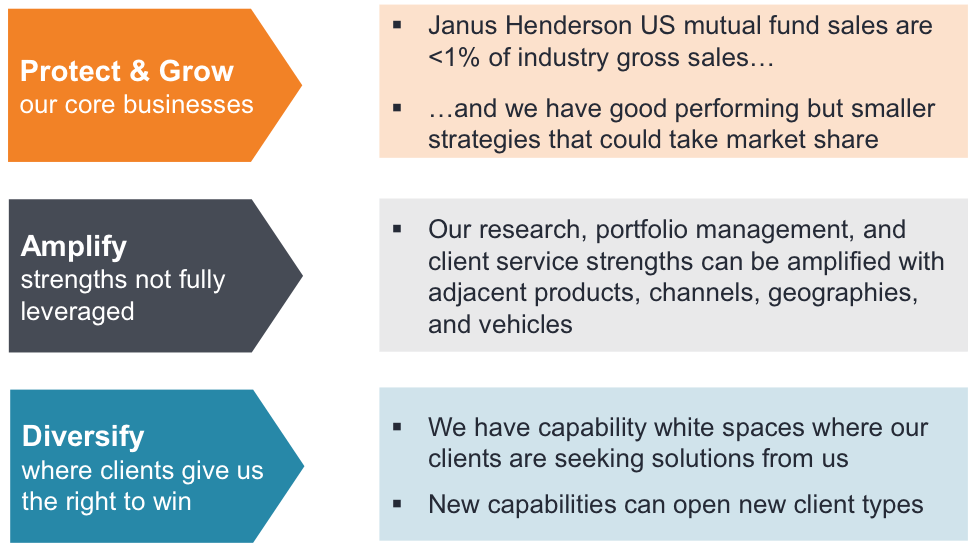
In my view, the ‘Protect & Grow’ and ‘Amplify’ components can be regarded as business as usual activities for a well-run fund management group, and as such I don’t see anything here that is particularly exciting or impactful from a strategic perspective. The ‘Diversify’ component is more interesting and comes with both upside and downside risk – essentially Dibadj is talking about potential acquisitions and team lift-outs to expand product offerings. As discussed in my previous JHG note – ‘Transition Underway’ – my general preference is for companies to expand into new product areas via an organic approach; I am therefore not overly enthusiastic about the ‘Diversify’ component of JHG’s new strategy. That said, assuming that near-term operating conditions remain challenging for fund managers, JHG may actually be able to acquire businesses or talent that will deliver diversification at relatively low prices.
Investment Performance Metrics – Good Enough
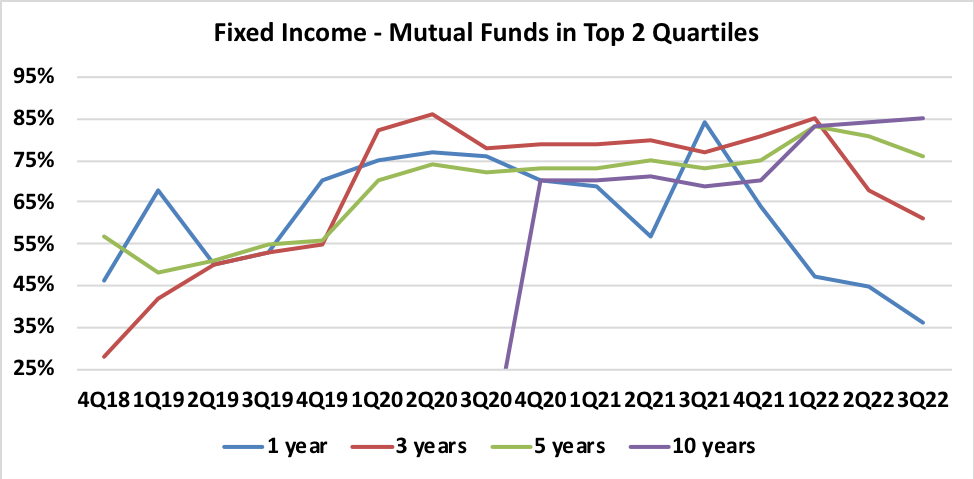
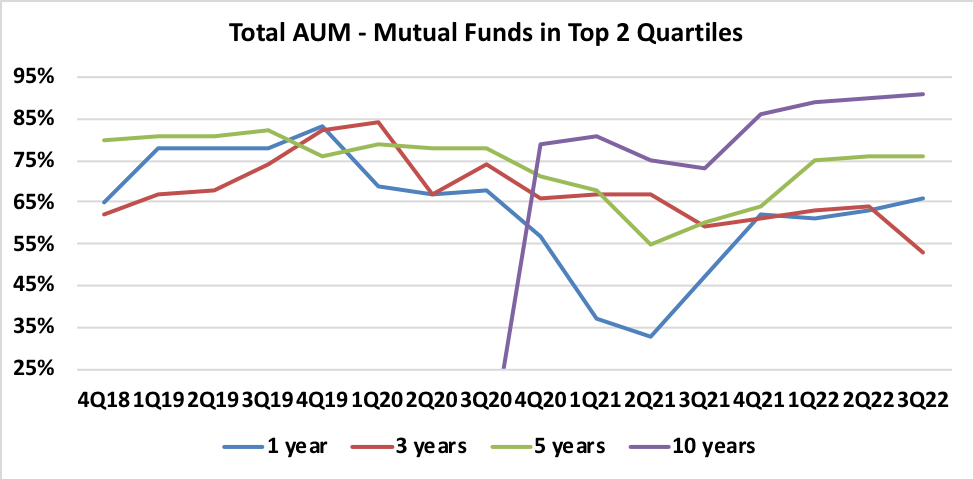
In the charts below I track JHG’s product investment performance relative to peers and benchmarks. The underlying data has been extracted from JHG’s quarterly reports. The data is split into Equity, Fixed Income and Total AUM. Note that the 10-year data only started to be provided from 4Q20 onwards. Let’s start with the peer-relative analysis and then look at the benchmark-relative analysis.
Peer-relative analysis:
Source: author’s calculations based on JHG quarterly reports. Source: author’s calculations based on JHG quarterly reports. Source: author’s calculations based on JHG quarterly reports.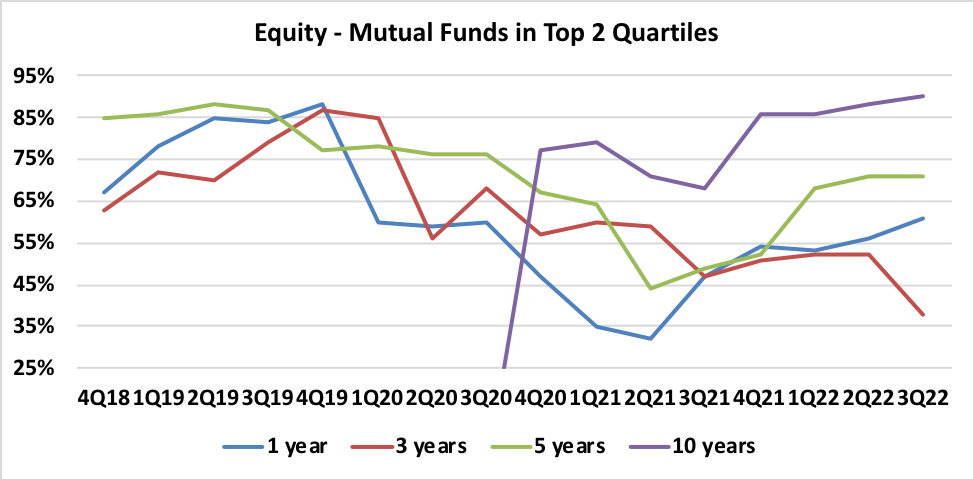
Observations:
- For Equity, generally speaking, peer-relative performance has drifted lower since 2018/2019, particularly on 1-year and 3-years metrics. The 10-years metrics are very solid. At 3Q22, the 3-years measure is the only metric that is ranking below 50% versus peers. My conclusion is that on a peer-relative basis, JHG’s Equity franchise is in good shape.
- Fixed Income metrics have generally improved since 2018/2019, although the 1-year metric has deteriorated in recent quarters. Overall, Fixed Income performance looks good versus the peer group. But investors should keep a close eye on the near-term performance given the slide in the 1-year metric.
- On a Total AUM basis, to feel positive about the ability of investment performance to support AUM growth, I like to see peer-relative metrics above 60%. At 3Q22, JHG is above this mark for all timeframes other than 3-years.
Benchmark-relative analysis:
Source: author’s calculations based on JHG quarterly reports. Source: author’s calculations based on JHG quarterly reports. Source: author’s calculations based on JHG quarterly reports.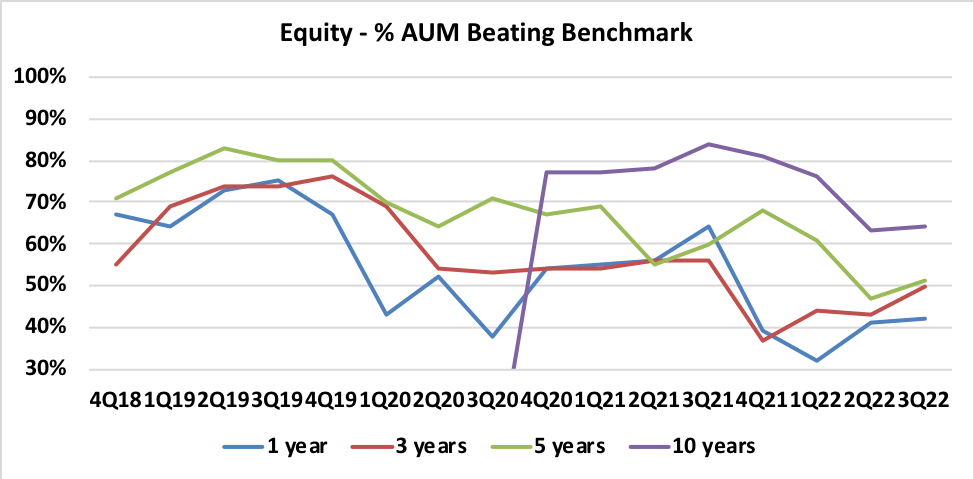
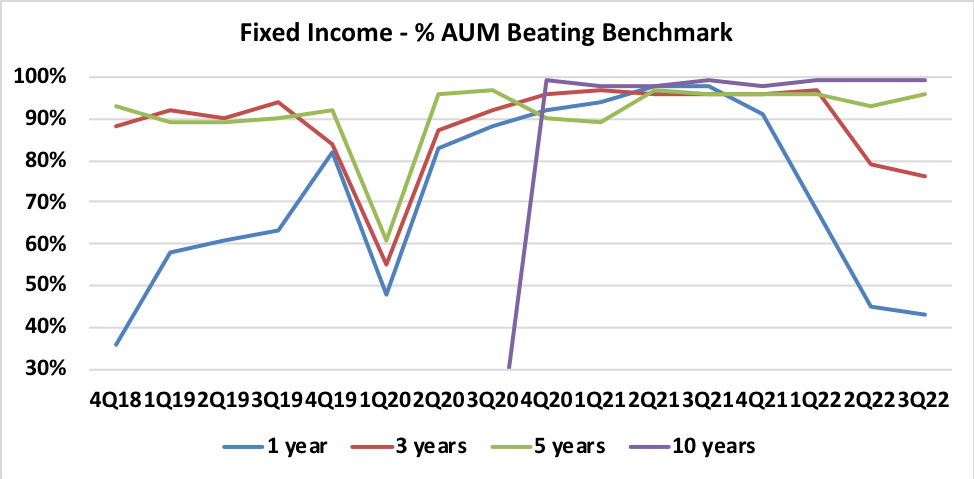
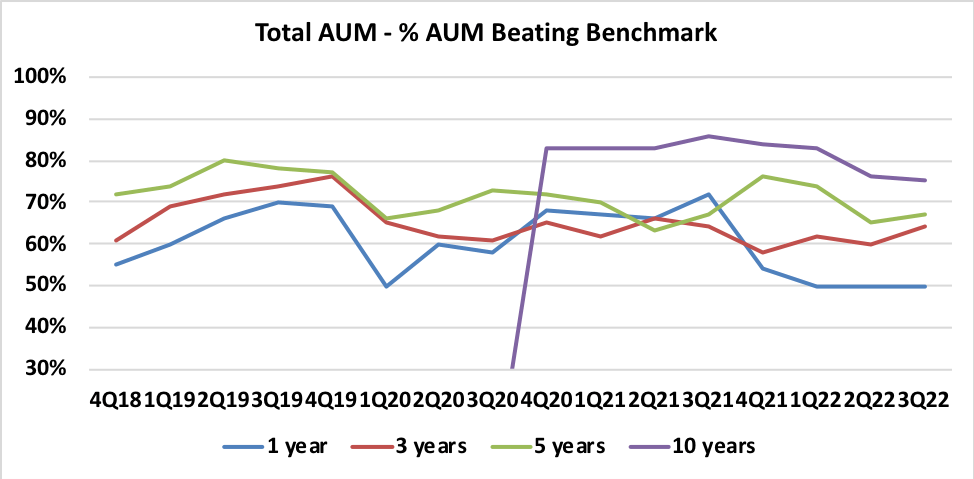
Observations:
- For Equity, benchmark-relative performance has drifted lower since 2018/2019. The 10-years metrics remain solid, but other timeframe results as at 3Q22 are not compelling.
- Fixed Income performance versus benchmark is strong, albeit with significant volatility in 1-year outcomes.
- On a Total AUM basis, benchmark-relative performance has been quite consistent over time and can be described as solid.
Overall, I conclude that JHG’s investment performance statistics can be regarded as moderately positive. Based on this analysis, I do not expect JHG to see high rates of AUM redemption due to performance concerns. However, on the other side of the coin, investment performance is not strong enough to generate confidence that a return to net inflows is imminent.
Updated Fundamental Valuation
In the calculations below, I put forward a simple P&L model for JHG that can readily be flexed to consider a number of scenarios. Note that the calculations are in line with the adjusted results that JHG’s management presentations refer to (as is the analysis presented above). I direct readers to my previous Seeking Alpha JHG notes for a detailed discussion of the normalized earnings valuation methodology adopted.
Under normal circumstances, my Base Case valuation builds up from the most recently published AUM (30 September 2022, 3Q22). Equity markets have moved materially upwards since 30 September 2022, with the S&P500 total return index up by +11.5% and the MSCI World total return index up by +12.6% for the period to 11 November 2022. Working from JHG’s 3Q22 AUM asset mix, my estimated mark-to-market AUM is around +8.7% higher than the reported 3Q22 level. Note that I have also made an explicit allowance in the valuation AUM for the announced mandate losses referenced above. In line with previous research notes, the Bear Case assumes a 5% fall in AUM from the Base Case level, and the Bull Case assumes a 5% increase in AUM. The valuation summary on this basis is shown below.
Table 1:
Source: Author’s calculations using data from JHG financial reports.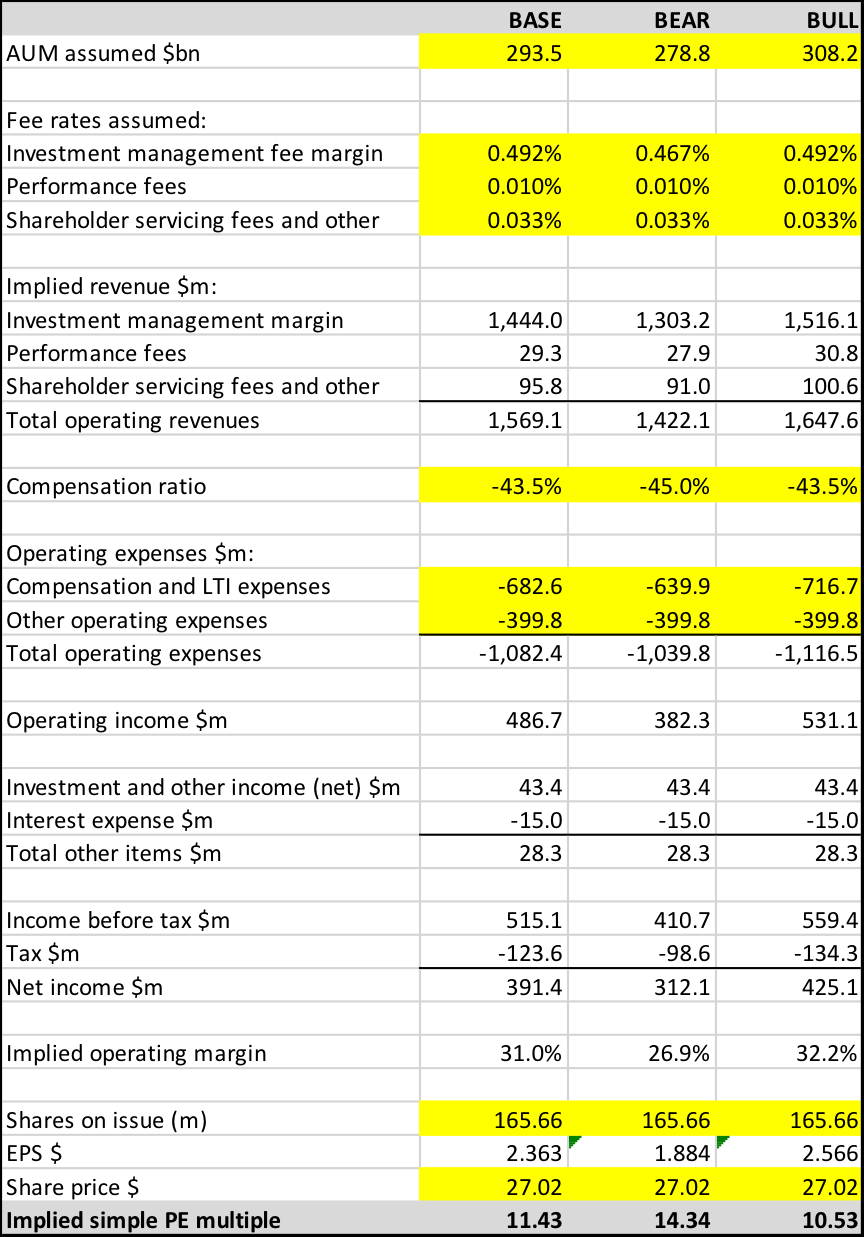
Conclusion – Downgrade From BUY to HOLD
My fair-value benchmark for a fund manager is a P/E of around 12x. At $27.02 per share, the valuation scenario framework outlined above indicates that JHG is trading at a P/E of between 10.5x and 14.3x, with a Base Case of 11.4x. On that basis, JHG looks to be slightly cheap.
However, taking into account the recent spike in JHG’s share price, and being mindful that the stock will have material downside leverage to any equity market correction from the recent boost that followed the 10 November 2022 US inflation rate data release, I see insufficient valuation support to retain a BUY rating. I therefore downgrade JHG to HOLD.
Be the first to comment