

Vera_Petrunina/iStock via Getty Images
Summary
Jack in the Box’s (NASDAQ:JACK or “JITB”) stock has been struggling for years as store growth stalled out post the completion of their conversion to a franchise model. By 2018, frustrated JACK franchisees had voted to oust the CEO and, by 2020, achieved their goal. The company brought in seasoned executive Darin Harris to fix the ongoing issues.
Darin has an impressive track record of turning around struggling franchises. From the get-go he has implemented significant cultural changes putting franchisees and their profitability above all else. As a former franchisee himself for other brands, he knows how to connect with these business owners and the relationship between corporate and the franchisees has improved dramatically. Darin also revamped the executive team, bringing in many of his prior colleagues and coworkers.
During Mr. Harris’ first 2 years as CEO, he has achieved tangible results in turning around JACK. He has repaired the franchisee/franchiser relationship and launched a franchise development program that is showing early signs of success.
These changes have only gained momentum as JACK has now signed development agreements for 218 new restaurants (6 of which have been opened). Impressively too, Jack in the Box’s 2-year stacked same stores sales (SSS) have exceeded the average of its QSR franchise peers (MCD, WEN, Burger King U.S., Taco Bell & KFC) for 8 straight quarters, consistently ranking #1 or #2.
In addition to management changes, JACK looks like a solid compounder as the company has significant potential for further shareholder value creation. JACK has a great balance sheet and low capital intensity due to its franchise business model. This translates to more free cash flow available to shareholders. JACK’s EPS growth has outpaced the market over the medium and long term, and the company is well positioned to potentially achieve this going forward.
JACK currently trades at 9.2x forward earnings, which is a 10-year valuation low. While management did cut EPS guidance by 10% when it reported Q2 earnings, the stock’s 30% decline year-to-date appears overdone. The stock feels like it has finally found a support level in the high 50s low 60s level.
In sum, we have high conviction in JACK and see the stock as a potential double in the next 2 or 3 years. Our downside case assumes a Dine Brands EV/EBITDA multiple (a business in secular decline, different than JACK), which implies a price in high $50s.
Recent Financial Results
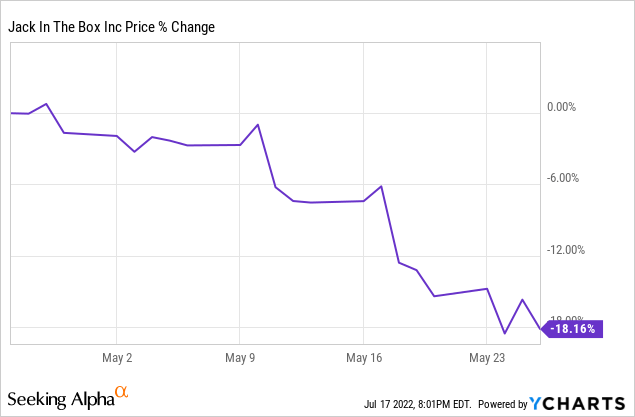
Jack in the Box reported their fiscal 2nd quarter results before the market opened on May 26th. The stock had traded down 18% during the previous 30 days heading into the print, underperforming the market by a significant margin.
Backing out the results of Del Taco, Jack in the Box missed sell-side expectations on Revenue and EBITDA, with results coming in 1.4% and 8% below estimates. JACK also issued one-time EPS guidance for FY22 that was about 10% below street expectations.
The lapping of stimulus, several weeks of omicron in the first month of the quarter, and limited service due to staffing shortages largely offset the benefits from higher prices. Elevated commodity prices and a tight labor market pressured company owned restaurant margins, while the lack of labor availability and a franchisee bankruptcy reduced franchise revenues.
Revenues
JACK’s same store sales (SSS) decreased 0.8% year over year, however SSS were up 20.7% in the prior year quarter, resulting in a 2-year stacked SSS of up 19.6%. SSS were up at company owned restaurants which were more aggressive in taking price than franchisees (franchisees were more aggressive in Q1). Traffic declined 4.5% year over year after increasing 16.8% in the prior year quarter.
Same store sales seem to be in solid shape on an absolute and relative basis. JACK’s 2-year and 3-year stacked same store sales numbers have continued to outpace the peers we track.
Company Reports, Bloomberg, Author’s Spreadsheet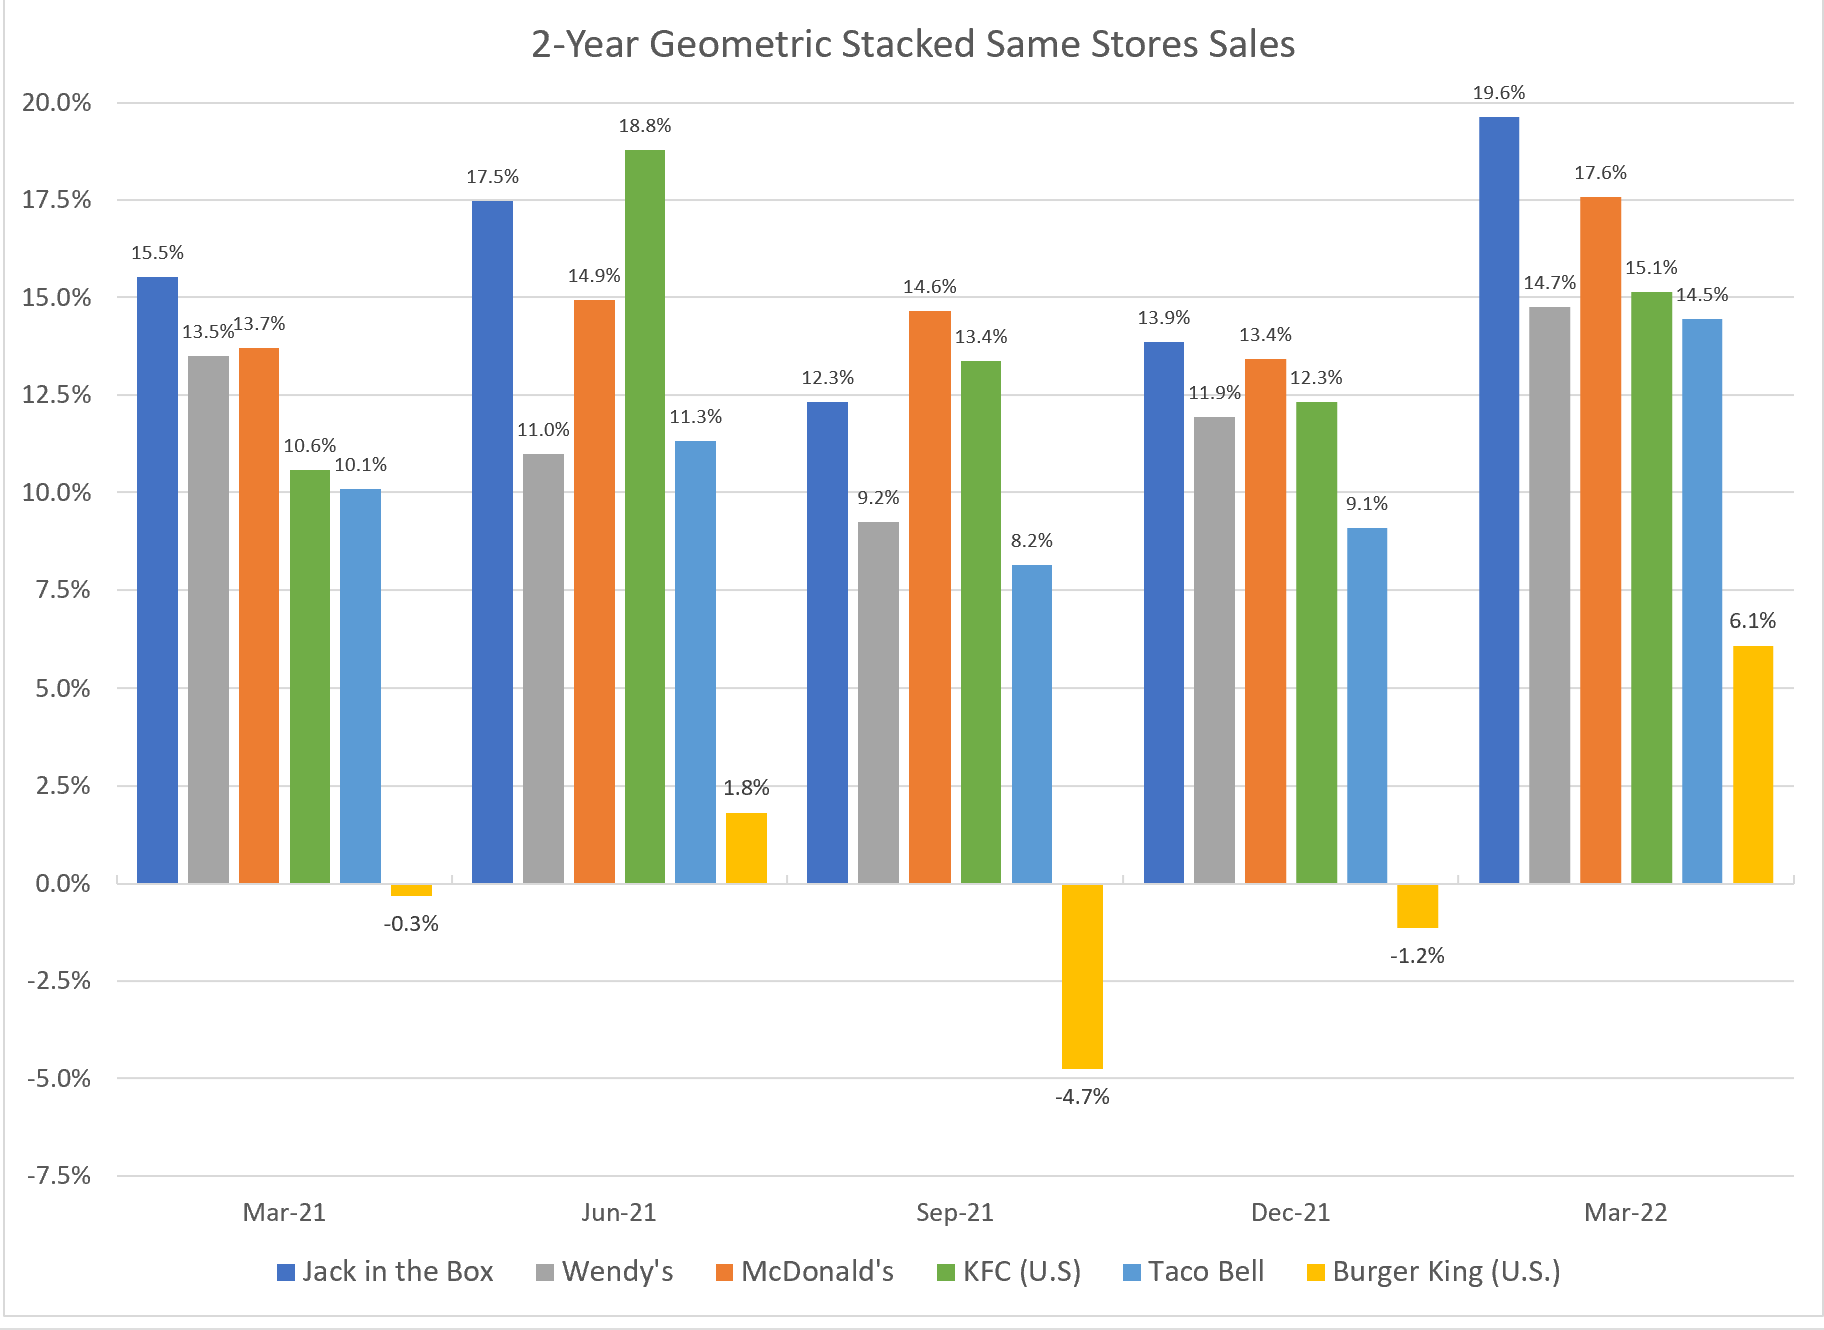
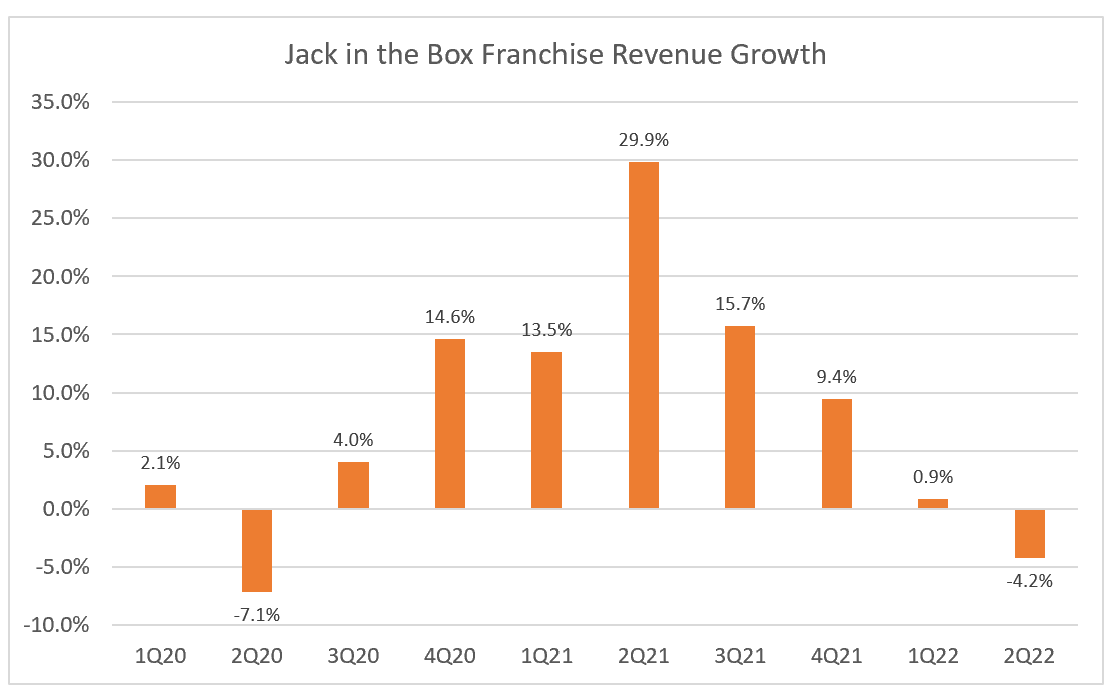
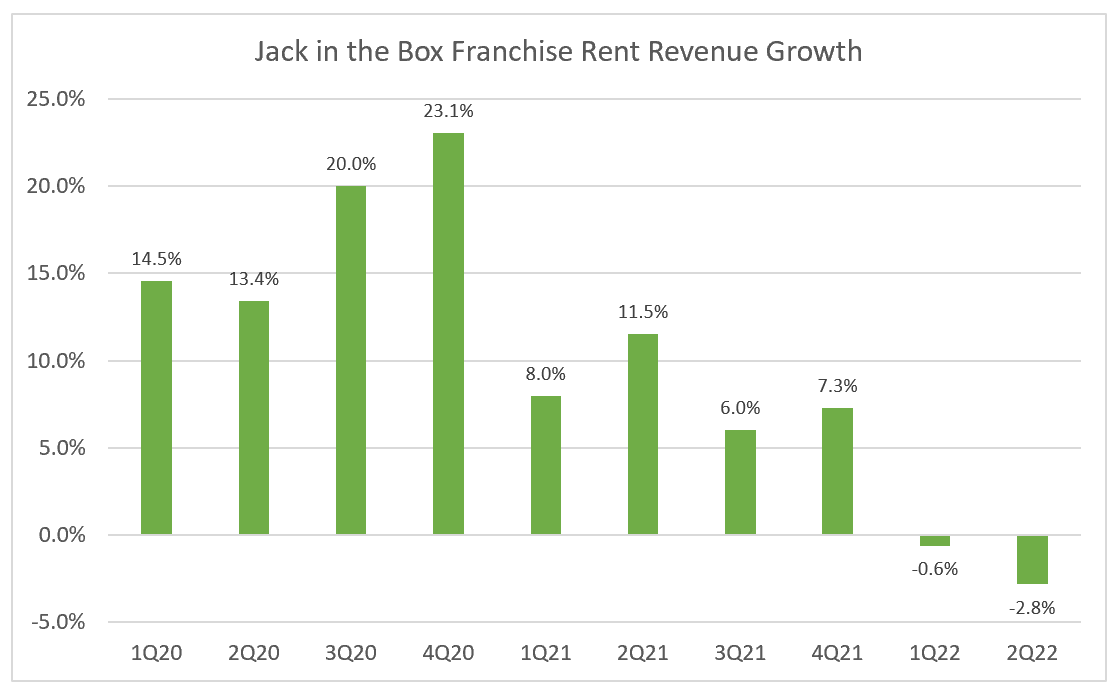
Total franchise revenue fell 4.2% in the quarter. Franchise rental revenues also declined due to a reduction in franchise subleases as well as an impact from deferring $1.2M of revenue in connection with a franchisee bankruptcy proceeding. The revenues from the bankruptcy matter will be recognized upon payment from the franchisee, which based on the disclosure in the 10Q sounds likely.
Franchise royalties & fees declined 5.9% y/y in FQ2 as the number of franchise stores was down 2.2% y/y. Franchise same store sales declined 1.1% after being up 20.6% in the prior year quarter. Lower fees received from the early termination of franchise agreements of $2.1mm as well as a deferral of $0.8mm in connection with the franchisee bankruptcy matter also contributed to the decline.
Company owned restaurant revenues increased 9.6% y/y. The number of company owned units grew 13.9% to 172 as JACK acquired 9 restaurants in the quarter and closed 2 restaurants. Same store sales increased 1.7% as average checks increased 3.7% and transaction volumes declined 2%. The company raised menu prices at company owned stores by 8.2% in the quarter.
Average Unit Volumes at company owned restaurants declined 3.7% in the quarter. AUVs were down largely because of 9 underperforming stores in Nashville and 30 other “Evolving Market” stores that JACK has acquired from franchisees over the last 24 months.
Company reports, Author’s spreadsheet Company reports, Author’s spreadsheet Company reports, Author’s spreadsheet Company reports, Author’s spreadsheet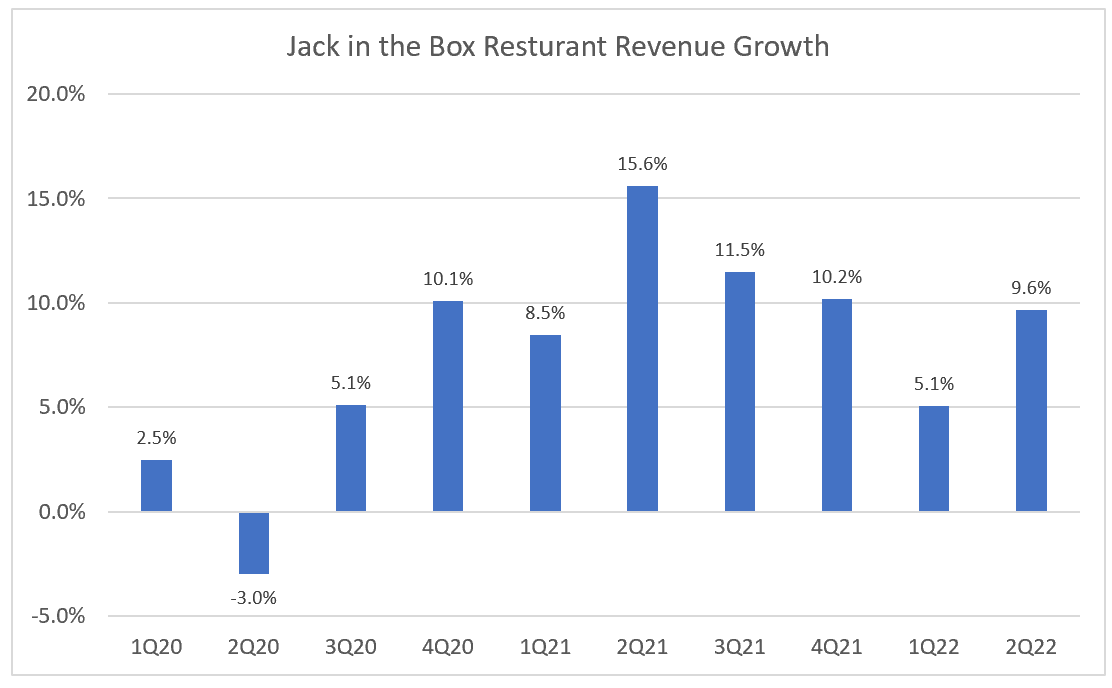
Limited worker availability has forced restaurants to reduce operating hours and close dining rooms across the JACK system. Late night is a particular strength for JACK, and it appears difficult to find workers who want to work overnight (and often deal with people in altered states of mind!).
The decline in same-store sales was largely attributable to staffing challenges, resulting in lost operating hours, headwinds from the final weeks of Omicron and lapping stimulus benefits within the comparable period of the prior year. However, we were pleased to see improvements in both quality and speed of service, something that has steadily improved throughout the fiscal year.
A meaningful number of our restaurants continue to operate at reduced operating hours during the quarter, many would close dining rooms. With that said, compared to the prior quarter, the impact from lost operating hours has notably reduced, and we expect this to be an opportunity during the back half of 2022.
– Tim Mullany, CFO, Jack in the Box Q2 Conference Call
Just 50% of Jack in the Box dining rooms are open across the entire system. These challenges have dampened system sales, reducing royalty and restaurant revenues. These pressures do seem to be lessening as management on the call noted that the company is seeing a decent size bump in unit volumes when dining rooms are able to re-open.
While it’s clear there are several challenges, we still think top line growth is in decent shape. However, we believe growth will return to trend after running above average as a result of lockdowns and stimulus. The company’s digital strategy has attracted wealthier consumers than what the brand has been able to attract historically. Menu innovation and a strong value offering have improved loyalty with lower income customers maintaining their spend at stores.
JACK’s executive team has done a good job of maintaining the market share gains it picked up during the pandemic. Management communicated on the Q2 earnings call that some of the strategies they have employed have been improving their labor situation. They intend to roll out the strategy to franchisees and to the rest of the system, which should help sales in the back half of the fiscal year.
Costs
Moving down the P&L is where JACK really ran into challenges in the quarter. FQ1 numbers showed signs that JACK was doing a solid job of controlling costs. Restaurant operating costs per store had increased by a modest 2.6% and franchise costs as a percentage of franchise revenues were 58.4%, largely in line with the previous couple of quarters.
However, the war in Ukraine resulted in significant volatility in commodity markets and the U.S. labor market has remained extremely tight. This caused a rapid increase in labor and commodity costs for JACK’s company owned restaurants. In sum, the company experienced commodity inflation of 16.4% y/y and labor inflation of 14.2% in the quarter.
The challenges on the cost side in combination with the acquisition of low performing stores in “Evolving Markets” significantly impacted restaurant operating margins pushing them down to 15% for the quarter from 25.9% a year ago. Excluding Evolving Markets, restaurant operating margins would have been 330bps higher.
Commodity & Labor Inflation
The issue of rising costs and labor availability/costs is particularly important in the short term given JACK’s acquisition of Del Taco (which is only ~55% franchised). We would note however that Del Taco’s Restaurant margins have held up well given the current environment.
While we see the cost challenges as short term, we think that commodity and labor market dynamics will be an important factor in the performance of JACK’s stock for the remainder of 2022. While we generally shy away from macro-oriented bets as investors because it’s largely unknowable/outside of a manager’s control, wage inflation is already starting to fall, and commodity prices increases are also moderating.
Base effects as well as the actions of the Federal Reserve to tamp down inflation has started to generate some downward pressure on commodity and labor markets. Additionally, the old adage of “high prices are the cure for high prices” seems to be starting to work its way through the economy as consumers and business seek to find alternative ways to save money.
On the labor side, we note that average hourly earnings y/y growth for limited-service restaurants non-supervisory workers seems to have finally peaked in March of 2022.
BLS, Author’s spreadsheet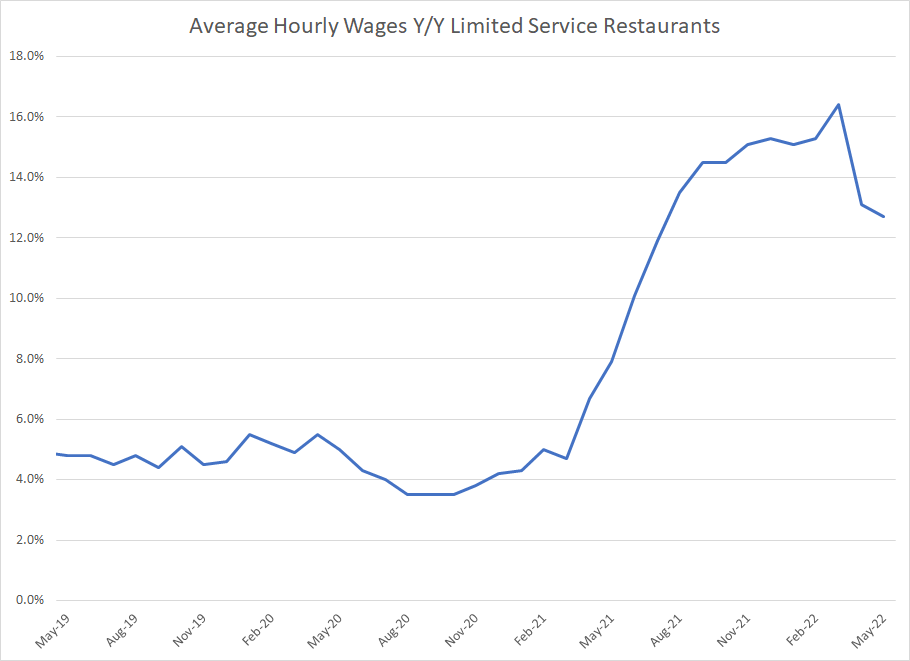
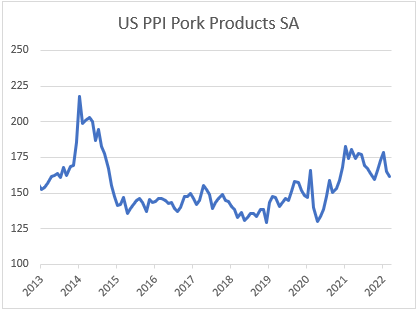
On the commodity front, management specifically cited beef, pork, and cooking oils as the major contributors to JACK’s 16.4% commodity inflation. Looking at PPI data, which measures what producers are getting paid for their goods, it seems that pricing for major input commodities for JACK are coming down or have at least stabilized. As the company does have pricing power, they should be able to restore margins. There’s even the potential to see a benefit from lower commodity prices in the back half of the year.
BLS, Author’s spreadsheet BLS, Author’s spreadsheet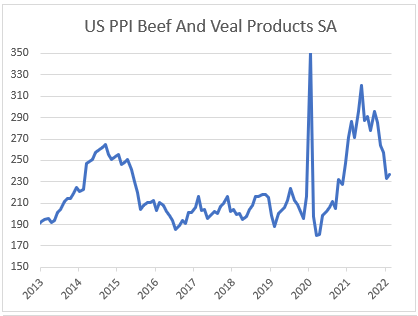
Company Efforts to Control Costs
JACK’s management team has been taking several steps to preserve or improve store profitability during some of the highest levels of commodity and labor inflation experienced in 40 years. The company launched a longer-term program under current management called “Financial Fundamentals”, which tasks the company’s operations team to find ways to improve profitability. The company has also launched a margin task force for finding short-term cost savings opportunities.
Through the implementation of new processes as well as investment in technology, the company thinks they can improve restaurant margins 200 basis points over the next year or so. These innovations can then also be rolled out to franchisees who can improve their own profitability and make Jack in the Box restaurants more attractive to potential franchisees.
On the labor side, JACK’s management rolled out staffing initiatives in the two largest company-owned markets during FQ2. The company has been utilizing contract recruiters, direct mail, improved employee referral programs, and premium pay for late night. So far, the results have been promising with a large increase in interviews, a 7% increase in total employee count in the restaurants they’ve rolled out the new strategy in. Given the signs of improvement we think this bodes well for JACK in terms of getting over the labor shortage challenges that are not only causing cost problems but also are now impacting topline growth.
Management is looking to communicate its strategy with franchisees who are hopefully able to attract more talent so that they can re-open dining rooms and operate at full-service hours. The success of the program would generally solve the issue of dining room closures and limited operating hours impacting the topline.
While there is only so much management can control, we applaud the aggressive actions that JACK is taking. Our view is that while it may take some time to restore restaurant level margins (back its historical mid to high 20s percent range), pricing power and a reduction in inflation suggest the odds are high that they can get back there.
Del Taco
JACK closed on their acquisition Del Taco 2 months into FQ2 giving management some time to take a closer look into the brand. Overall, Del Taco in its current state seems to be a lower quality business than JACK. Restaurant level margins are lower, and the company is only about 55% franchised. However, we think JACK management’s strategy around Del Taco has the potential to create significant shareholder value via synergies and completing the transition to a higher quality capital light franchise model.
On the call, Darin Harris took a few minutes to go over his observations about Del Taco since closing on the acquisition. Both JACK and DT are challenger brands with similar strategies as to how they position themselves in the market. Both brands have been highly innovative on the menu front, and he expects that to continue for both companies in the future. He seemed confident in the ability to realize synergies on several fronts too. Finally, Darin also communicated that the company is in within weeks of finalizing the re-franchising plan for DT.
Overall, this will require some patience, but Del Taco still appears to be 5% accretive to earnings per share on an annualized basis.
Long-Term Financial Targets
Beyond the value creation from the DT acquisition, JACK has made strong progress towards its medium-term goals of 1 to 3% annual restaurant growth from FY23 to FY25 and its longer-term goal of +4% annual restaurant beyond 2025.
JACK added 3 development agreements for an additional 17 restaurant opening commitments in the quarter. The company has also now opened 12 restaurants since the company restarted a push for franchise development starting in FQ2 of 2021. The company has commitments for an additional 206 restaurants, which represents just under 10% of the company’s store base. We’d note that there’s also the 39 Evolving Market restaurants that JACK intends to re-franchise, which we believe is like to happen over the next 12 to 24 months.
As discussed earlier, JITB’s SSS continue to come in strong on a 2-year & 3-year stacked basis. We utilize these measures given the way above trend comps the company experienced because of COVID restrictions and stimulus that benefited the QSR industry’s SSS in 2021.
JACK is executing well towards their longer-term goals, despite hiccups in current margins. We see a catalyst perhaps for the stock when net store openings turn positive, a likelihood sometime over the next 4 quarters.
Valuation & Comparable Companies
Indeed, comp multiples have come down significantly year-to-date as commodity and labor inflation have impacted the entire industry. Jack is now trading at a 44% discount on a P/E multiple basis to its peers, versus a 5-year average of 21%. That is a large 2 standard deviations below the average. If Jack were to just trade back to its average comp discount over time, it would be a 15.6x multiple stock. That implies $103 on the stock, or 52% upside using blended forward EPS estimates ($6.60).
Bloomberg, Company financials, Author’s spreadsheet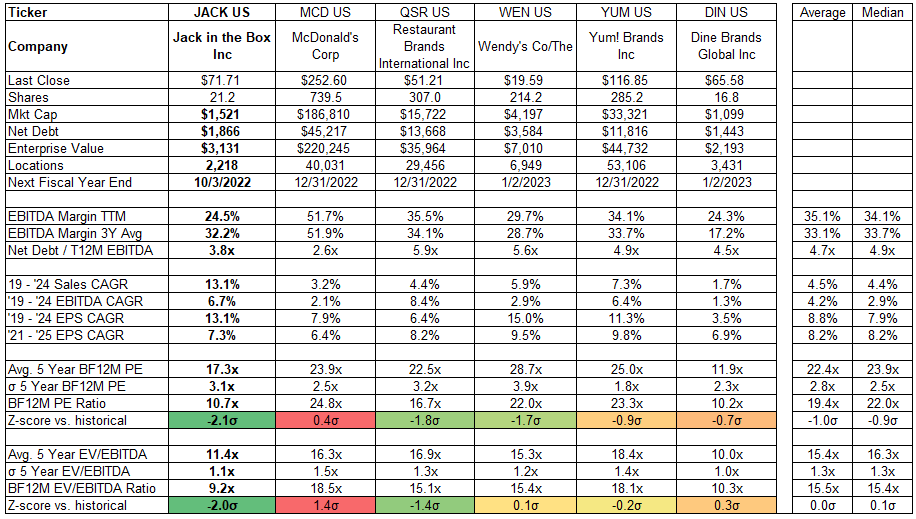
One potential reason for the recent significant increase in discount to peers is due to JACK’s performance during the ’08/’09 recession. JACK has historically attracted a lower income customer than competitors and during the GFC the company’s SSS well underperformed peers.
However, even if a recession may be on the horizon, we believe there are a few key differences between the JACK of ’08/’09 and the JACK of 2022. The first is that in ’08/’09 JACK’s restaurants were largely company owned at the time, meaning that profitability and earnings had significantly more de-leveraging risk during periods of sales declines.
Today, the company including Del Taco and JITB is ~85% franchised. Even if SSS declined 10% across company owned and franchised stores, the hit to the bottom line would be significantly less impactful to earnings and cash flow. Operating income and margins at MCD and YUM were very resilient during the recession.
JACK has also worked diligently since the onset of the Pandemic to grow its digital business, which according to management has attracted a higher income consumer. According to management, they’ve seen increased transactions from the higher income consumers they’ve brought in while less expensive menu items have continued to be attractive to low-income consumers (whose traffic numbers have remained flat during this very challenging period for them).
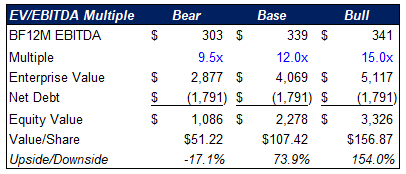
Historically Jack has traded between 10-30x earnings (and an average of 18.8x). With some multiple dilution from Del Taco and given recent results, we think JACK deserves roughly a 15.5x P/E multiple and a 12x EBITDA multiple on blended forward 12-month estimates.
Here is its historical P/E ratio:
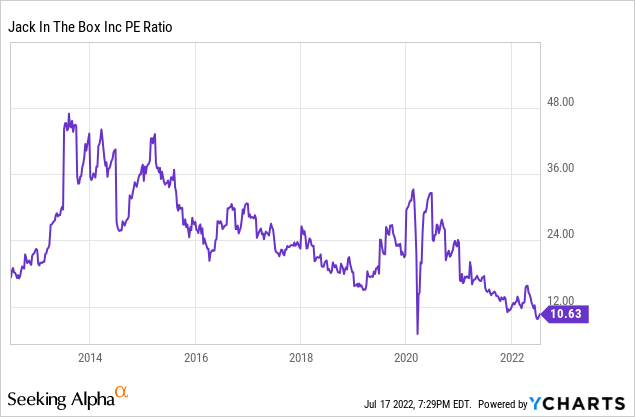
Using these multiples yields a value of over $100 in our base cases, which we think is achievable in 12 to 18 months.
Author’s estimates Author’s estimates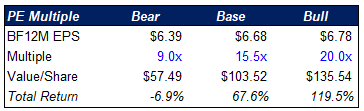
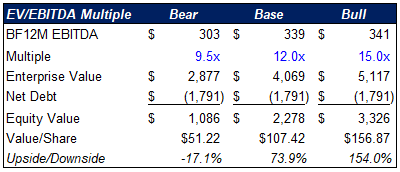
The downside appears fairly limited at this point. We applied a Dine Brands (DIN) multiple (10x EPS and 9.5x EBITDA) to discounted earnings and we suggest JACK has downside to the mid 50s to low 60s (or down about 10% to 15%).
The catalysts for revaluation over the next 12 to 18 months are likely to be lower commodity volatility and improvements on the labor front. We note that JACK reacted positively to the labor market data for May (reported last Friday). The release seemed to solidify peak average hourly earnings growth for leisure and hospitality workers. The limited-service worker wages are delayed by 1-month, so we’ll get more data in July.
As for the long term, if relative and absolute multiples for JACK were to just return to their longer-term averages, we think JACK could end up over a $150 stock in 2025. That is potentially 30% to 35% annualized returns over the next 3 to 4 years.
Author’s estimates Author’s estimates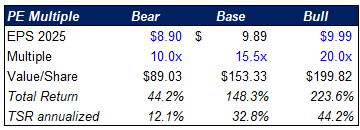
Conclusion
We believe Jack in the Box’s earnings can return towards a trend growth rate of 10% to 15% after having earned excess profits during the pandemic. The company seems to have gained share in its markets and is defending their share gains well under a strong new management team. Short-term pressure on the restaurant space over recession and inflation fears is creating a very favorable risk reward here.
If JACK meets the midpoint of their FY22 EPS guidance ($5.95 per share), they will have compounded earnings at ~12% since fully transitioning to a franchise model in 2018 (and even at the low-end growth would be 11.2% annualized). This is better than S&P 500 and the S&P Consumer Discretionary sector.
Meanwhile the stock has returned -21% during this time frame while the S&P 500 is up 41.5%. JACK today trades at a 43% discount to the S&P 500 and we deem the high ROE, capital light business model well above average.
Our conversation with investor relations, an individual who worked at Dominos during that company’s turnaround the early 2010s, said he sees a lot of similarities between JACK today and DPZ at the time. We’d note DPZ’s annualized total return since June of 2012 is 27.7%, well outpacing the market.
The upside/downside ratio is almost 11 to 1 using our blended forward 12-month scenarios (68.7% upside / 6.3% downside). The stock might sit in the penalty box for a little while longer given the disappointed Q2 results. However, once the company gets past difficult comps and/or the macro data continues to point for a favorable set up in FY23, the stock could have material upside. JACK also currently has 11% short interest and 5.2 days to cover ratio (per Bloomberg). This means that signs of improvement could lead to a short squeeze, potentially resulting in large gaps higher in the stock.
Be the first to comment